. 2023 Jul 20;83(14):2578-2594.e9.
doi: 10.1016/j.molcel.2023.06.003. Epub 2023 Jul 3.

Targeted high-throughput mutagenesis of the human spliceosome reveals its in vivo operating principles

Affiliations

Targeted high-throughput mutagenesis of the human spliceosome reveals its in vivo operating principles

Irene Beusch et al. Mol Cell. .

Abstract

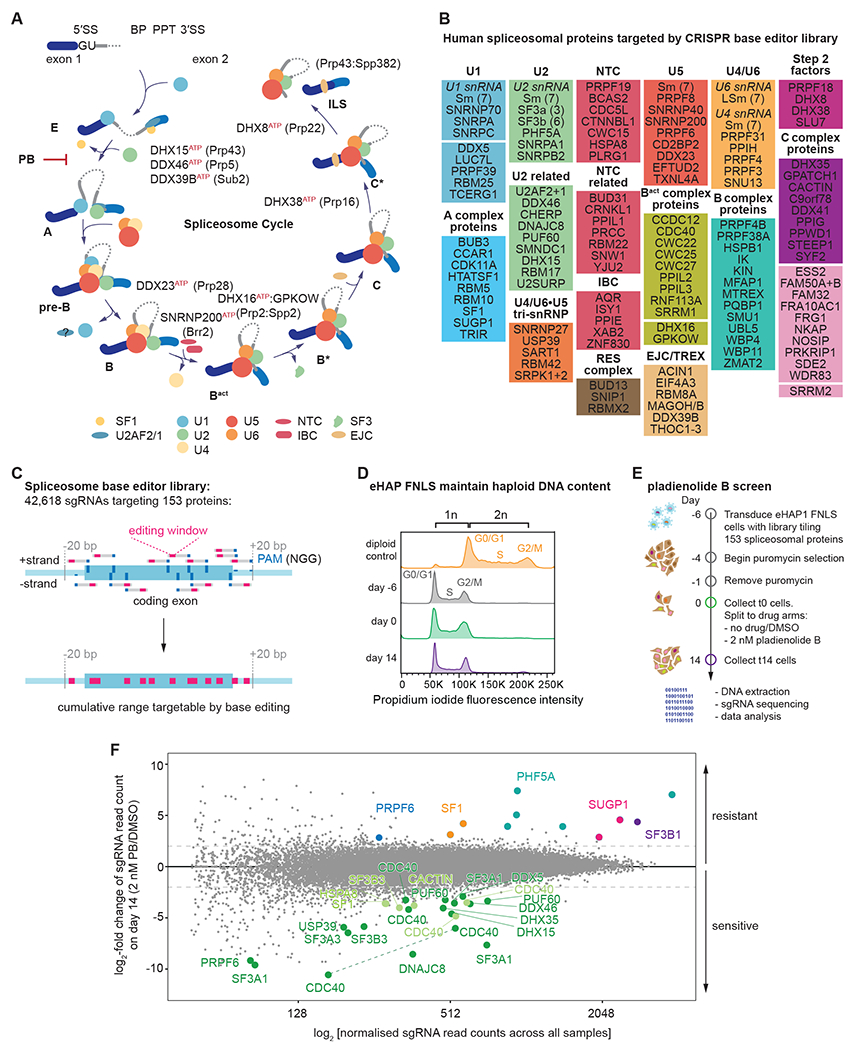
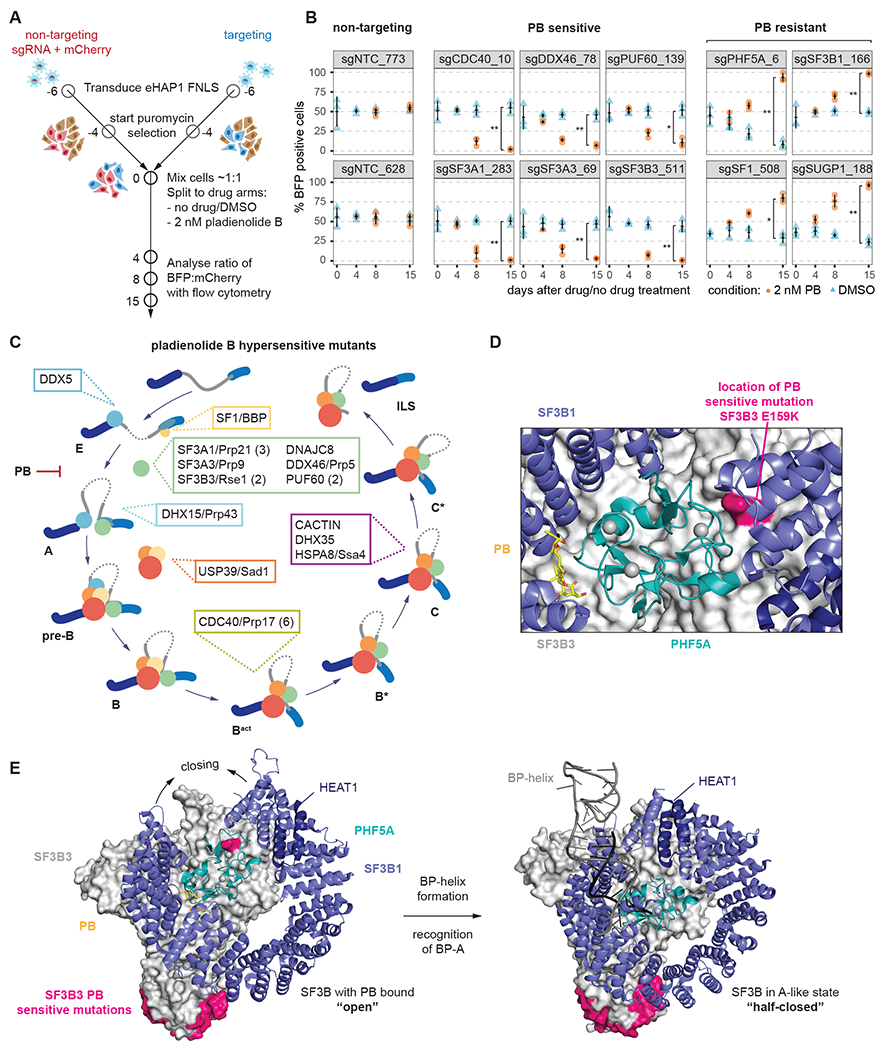
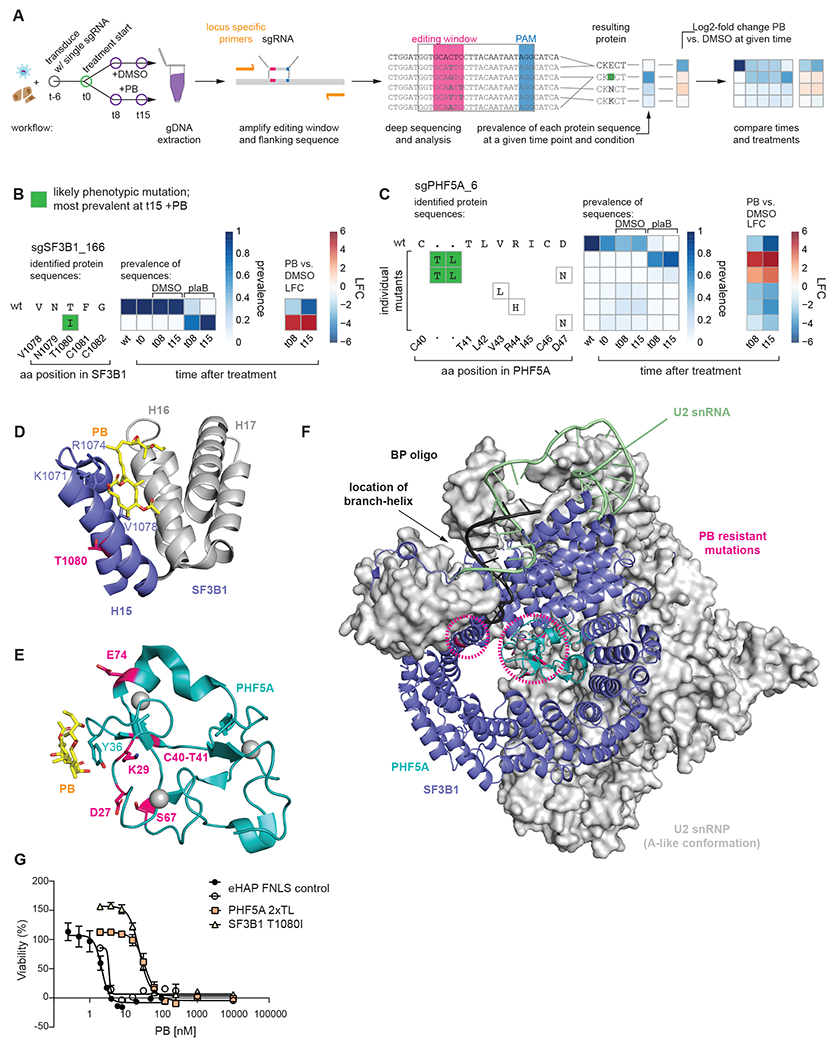
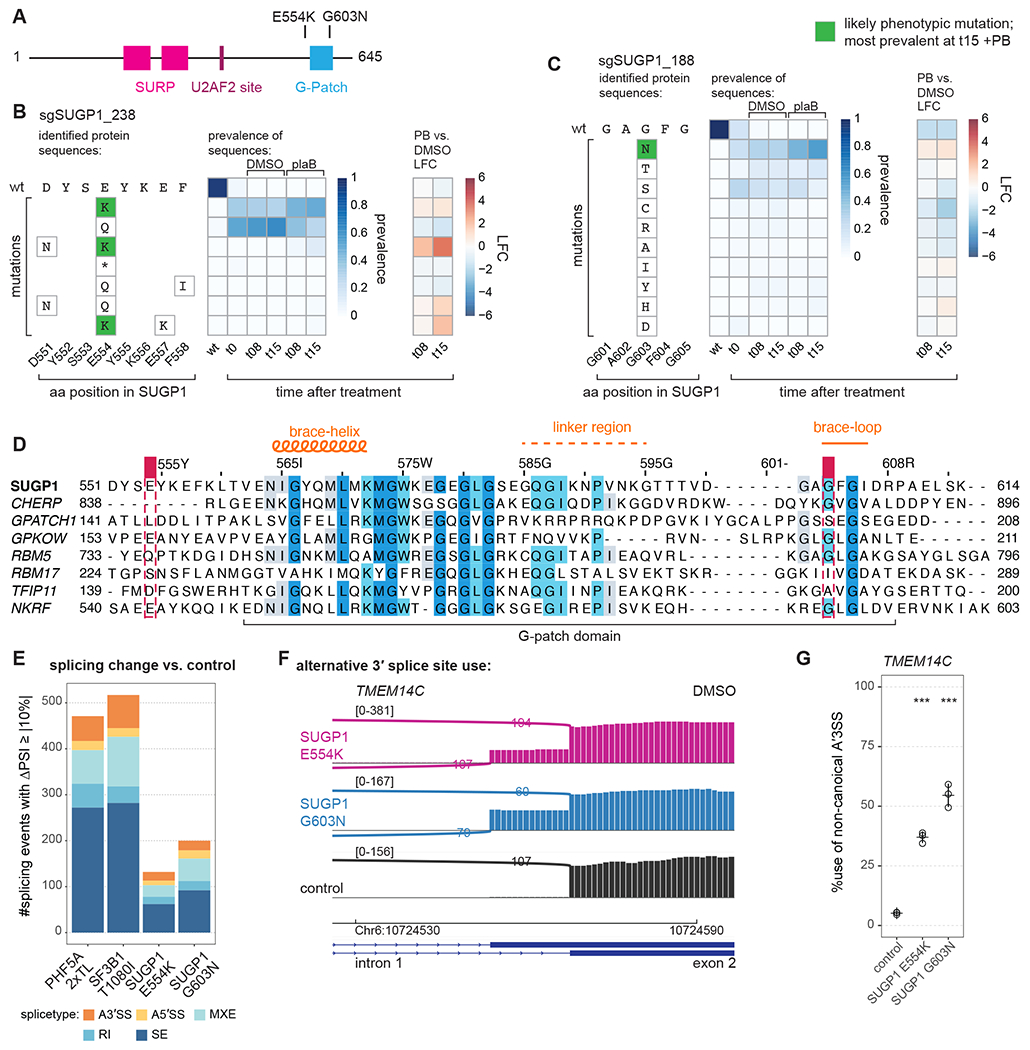
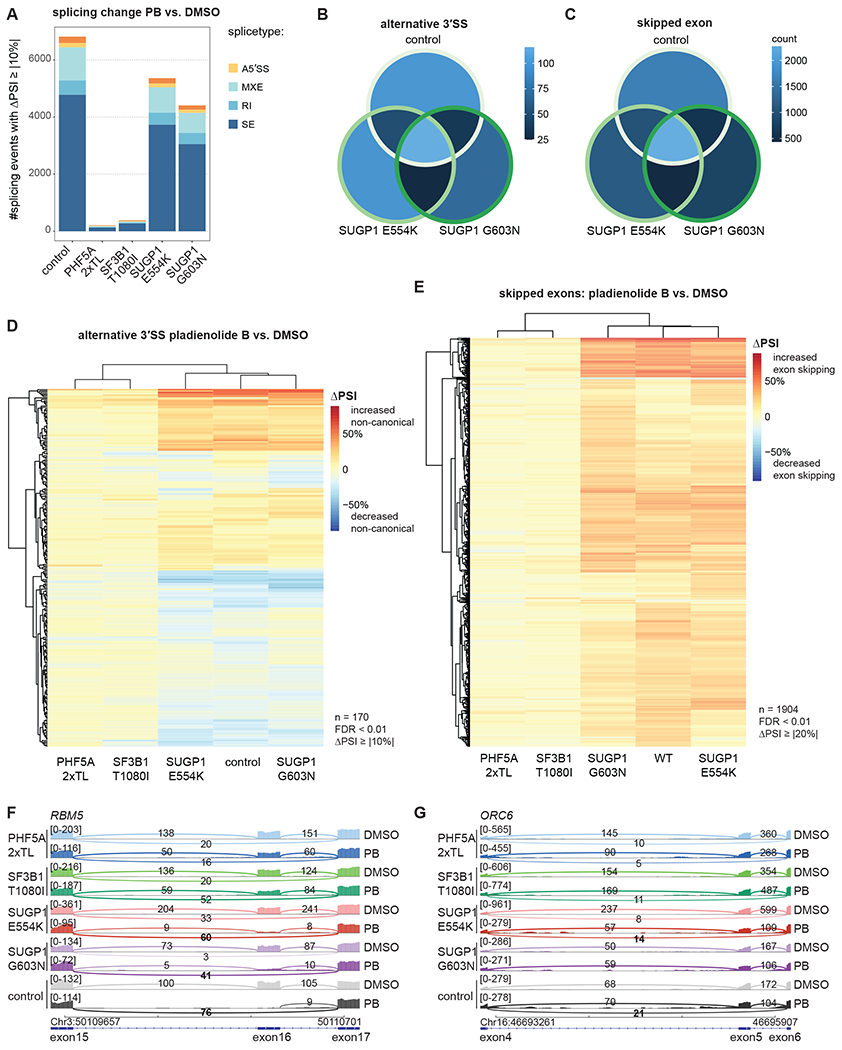
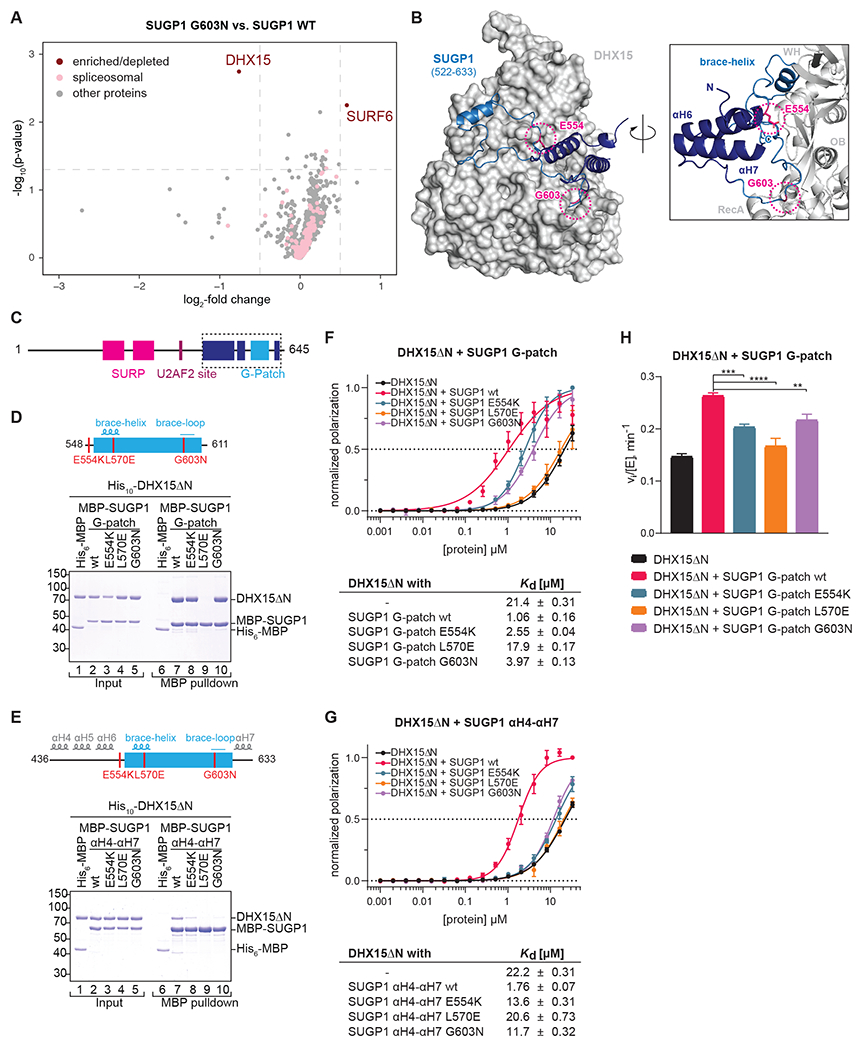
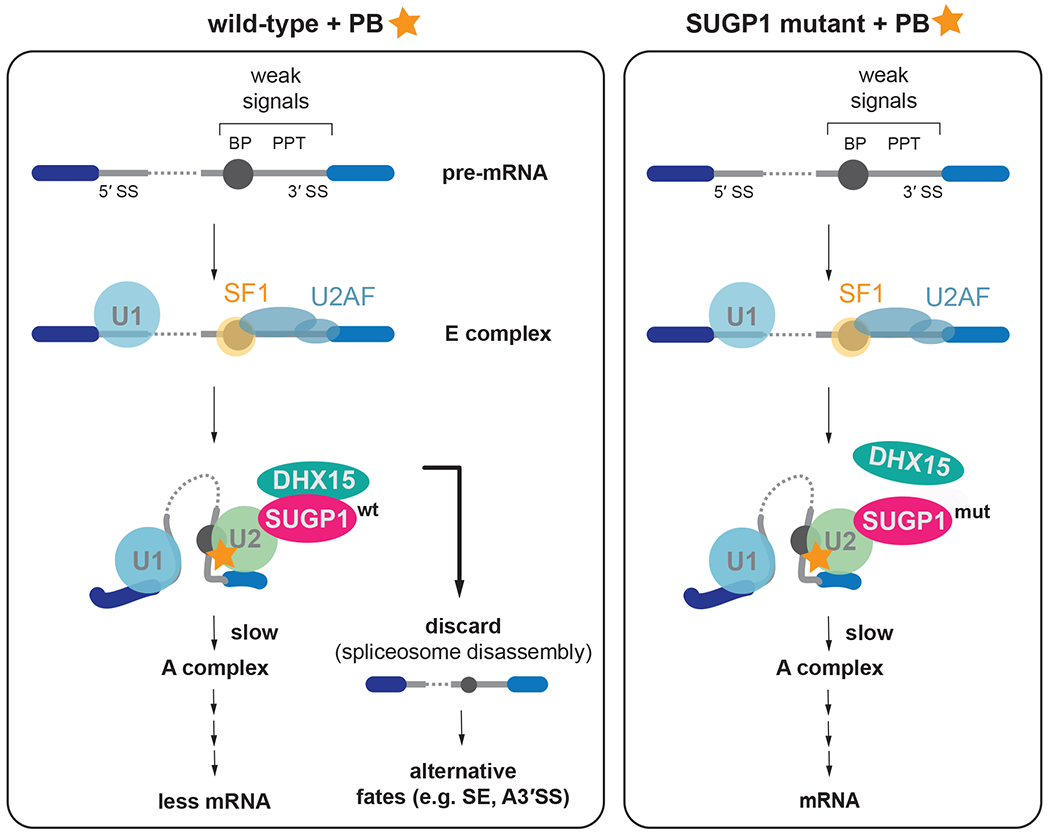
The spliceosome is a staggeringly complex machine, comprising, in humans, 5 snRNAs and >150 proteins. We scaled haploid CRISPR-Cas9 base editing to target the entire human spliceosome and investigated the mutants using the U2 snRNP/SF3b inhibitor, pladienolide B. Hypersensitive substitutions define functional sites in the U1/U2-containing A complex but also in components that act as late as the second chemical step after SF3b is dissociated. Viable resistance substitutions map not only to the pladienolide B-binding site but also to the G-patch domain of SUGP1, which lacks orthologs in yeast. We used these mutants and biochemical approaches to identify the spliceosomal disassemblase DHX15/hPrp43 as the ATPase ligand for SUGP1. These and other data support a model in which SUGP1 promotes splicing fidelity by triggering early spliceosome disassembly in response to kinetic blocks. Our approach provides a template for the analysis of essential cellular machines in humans.


Conflict of interest statement

Declaration of interests The authors declare no competing interests.

Figures

Figure 1.
Figure 1.. CRISPR-Cas9 base editing screen targeting the spliceosome reveals several mutants sensitive or resistant to the small molecule spliceosome inhibitor pladienolide B.
(A) Schematic of intron sequences required for splicing and the spliceosome cycle across the major assembly stages. (B) List of spliceosomal genes targeted by the sgRNA library. (C) Schematic of tiling sgRNA library. Every available PAM sequence (denoted in dark blue) on both strands of the genome is targeted across all coding exons. (D) eHAP FNLS cell line can be maintained in a haploid state. (E) Schematic of the pooled screen. (F) Results of screen. MA-plot comparing day 14 of cells grown in presence or absence of 2 nM PB. For orientation lines indicate a log2-fold enrichment or depletion of two. sgRNA with strong sensitivity to PB are emphasized in green (dark green: p-adj < 0.05, light green: p-adj ≥ 0.05 but highly depleted). sgRNAs resulting in PB resistance are colored by protein target. For clarity, only data points for sgRNAs that passed the confirmation assay are shown. Dashed line: sgRNA targeting the same position and predicted to result in identical mutational outcome.
Figure 2.
Figure 2.. Pladienolide B sensitive mutations occur predominantly in early spliceosomal complexes.
(A) Schematic of the arrayed confirmation assay. (B) Individual sgRNAs and their performance in the confirmation assay. sgRNAs are grouped by category they were found in in the primary screen. Measurements are from three independent transductions (n=3). *; **; ***: Student’s t-Test (paired) P value < 0.05, 0.01, 0.001, respectively. (C) Assignment of proteins targeted by sgRNAs conferring hypersensitivity to PB to the spliceosome cycle. If multiple sgRNAs are found for a protein, their number is given in parenthesis. (D) Close-up of location of PB-sensitive SF3A1 G159K mutation plotted on the structure of SF3b bound to PB. It lies at the interface of SF3B3 (green), SF3B1 (violet) and PHF5A (teal). Zinc ions are shown as grey spheres. (PDB: 6EN4) (E) Comparison of SF3B3, SF3B1 and PHF5A in the structure of SF3b bound to PB and the Alike complex. Locations of PB-sensitive mutations are marked in magenta and zinc ions are shown as grey spheres. (PDB: 6EN4, 7Q4O)
Figure 3.
Figure 3.. Novel resistance mutations in SF3B.
(A) Schematic of workflow to identify phenotypic mutations. Left: Cells are transduced with single sgRNA in an arrayed format. After six days (t0) treatment is initiated and a cell sample is harvested at t0 as well as t8 and t15 for genomic DNA (gDNA) extraction. Middle: Locus-specific primers are used to amplify the editing window and its flanking sequence of the gDNA. The amplicons are then deep sequenced to identify mutations. Right: Mutational outcomes are translated and the resulting protein sequences are aggregated as multiple DNA sequences may result in the same protein sequence. Prevalence of each protein sequence is calculated for each time point and treatment condition. Where applicable, log2-fold changes are calculated between two samples. Finally, time points and treatments can be compared across samples for both prevalence and/or log2-fold change vs. the wild type (wt). Inferred phenotypic mutations (most prevalent at t15 +PB) are indicated by a green background. (B) Editing outcome for sgSF3B1_166. (C) Editing outcome for sgPHF5A_6: In the absence of PB some mutations occur within the editing window around R44. PB treatment enriches for a rare 6 nucleotide insertion occurring from the nicking action of the nCas9, which is part of FNLS. (D) Location of SF3B1 T1080I resistance mutation. T1080 (magenta) is located on the back of H15 facing away from PB and towards H14 (not shown). Known resistance mutations at K1071, R1074, V1078 are shown. (PDB: 6EN4) (E) Location of PHF5A resistance mutations: All mutations are indicated (magenta) and occur on the face of PHF5A involved in PB binding. Known PB resistance mutation at Y36C is also indicated. Zinc ions coordinated by PHF5A are shown as grey spheres. (PDB: 6EN4) (F) Illustration of SF3B1 and PHF5A resistance mutations in context of U2 snRNP (A-like conformation). Mutations (magenta, circled) occur in vicinity to the branch helix and branchpoint adenosine. Zinc ions are shown as grey spheres. (PDB: 7Q4O) (G) Sixty-hour cell proliferation profiling (CellTiter-AQueous cellular viability and cytotoxicity assay) of control eHAP FNLS cell line expressing non-targeting sgRNA and monoclonal cell lines carrying either SF3B1 T1080I or PHF5A 2xTL mutation to PB. Error bars indicate s.d. n = 3 (average of two technical replicates for independent clonal cell lines).
Figure 4.
Figure 4.. Novel resistance mutations in SUGP1.
(A) Schematic of SUGP1 and its domains and motifs. (B) Editing outcome for sgSUGP1_238. (C) Editing outcome for sgSUGP1_188. (D) Sequence alignment of all human G-patch motifs involved in splicing with the NKRF G-patch motif included as a reference. Shaded residues: more than 30% identity. Positions of mutants identified in screen are indicated. Alignment by JalView. (E) Identified splicing changes for mutant vs. control cell lines. Numbers are shown for junctions identified by rMATS with FDR > 0.01 and |ΔPSI| > 10 (ΔPSI: PSI of mutant sample -PSI of control sample, where PSI: percent spliced in). RNA-seq data of total, polyA-selected RNA from three independent clonal cell lines treated for 3 h with DMSO. (A3’SS: alternative 3’ splice site use; A5’SS: alternative 5’ splice site use; MXE: mutually exclusive exon; RI: retained intron; SE: skipped exon.) (F) Sashimi plot for alternative 3’ splice site usage in TMEM14C exon 2 (DMSO). Representative traces for a single clonal cell line are shown. (G) RT-PCR and quantification for alternative 3’ splice site usage for TMEM14C exon 2 (DMSO). Statistical analysis for RT-PCR: one-way ANOVA with Dunnett’s for multiple comparison (two-sided, with control as reference) was performed with R and package multcomp; * p < 0.05, ** p < 0.01, and *** p < 0.001; all with n = 3.
Figure 5.
Figure 5.. RNA-seq analysis of mutants
(A) Analysis of PB-induced splicing regulation in mutant vs. control cell lines. Numbers shown for junctions identified with rMATS with FDR > 0.01 and |ΔPSI| ≥ 10. RNA-seq data of total, polyA-selected RNA from three independent clonal cell lines treated for 3 h with 2 nM PB or DMSO. (B-C) Overlap in and alternative 3’ splice site use (B) and cassette exons (C) affected by PB treatment for all junctions observed in all three sample groups (control vs. SUGP1 E554K vs. SUGP1 G603N). 23% of differentially spliced 3’ splice sites (B) and 29% of differentially spliced cassette exons (C) are affected in all three genetic backgrounds. Splicing junctions with FDR < 0.01 were included. (D-E) Hierarchical clustering of differential splicing of alternative 3’ splice sites (D) and cassette exons (E) for PB treatment, based on PSI (percent spliced in) changes. The heatmap represents ΔPSI values of A3’SS (D) or cassette exons (E) use, respectively, upon treatment with PB at 2 nM for 3 h vs. DMSO as detected in total, polyA-selected RNA using rMATS. Splicing junctions with FDR < 0.01 and |ΔPSI| ≥ 10 (D) or FDR < 0.01 and |ΔPSI| ≥ 20 (E) were considered. (F-G) Sashimi plot for alternative splicing of exon 16 in RBM5 (F) and exon 4 in ORC6 (G) for 2 nM PB vs. DMSO treatment. Representative traces for a single cell line each.
Figure 6.
Figure 6.. SUGP1 interacts with DHX15.
(A) miniTurbo proximity labeling using FLAG-SUGP1-miniTurboID G603N vs. wt overexpressed in HEK293T cells. Enriched biotinylated proteins were identified with TMT-MS. −log10(p-value) is plotted against the log2-fold change (LFC) in a volcano plot (dashed lines: cutoffs at p < 0.05 and LFC > 0.5). (B) AlphaFold2 prediction of SUGP1 (522-633), encompassing the G-patch motif flanked by αH6 and αH7, in complex with DHX15. (C-E) Domain organization and schematic representation of the MBP-hsSUGP1 variants with the introduced mutations colored in red. (D-E) Coomassie-stained gels of protein binding assays using purified MBP-hsSUGP1 constructs and His10-hsDHX15ΔN. MBP-SUGP1 G-patch (D), and αH4-αH7 (E) with either wildtype (wt) protein sequence or carrying the indicated mutation were used as baits and His6-MBP served as a control. Input (1.5% of total) and eluates (24% of total) were loaded. (F-G) Fluorescence polarization of FAM-labeled U12 RNA with His10-hsDHX15ΔN in the absence or presence of MBP-SUGP1 G-patch (F) and αH4-αH7 (G) wt or mutants. Dashed line indicates 50% normalized polarization. Error bars represent standard deviations from the average of triplicate measurements. RNA dissociation constants (Kd) with standard error of means (SEM) were derived from linear regression. (H) Initial ATPase activity rates of His10-hsDHX15ΔN in the absence or presence of MBP-hsSUGP1 G-patch wt or mutants at 250 μM ATP. Error bars indicate standard deviations of three independent measurements, asterisks denote significance (one-way ANOVA with Tukey’s) with ** p < 0.01, *** p < 0.001, and **** p < 0.0001.
Figure 7.
Figure 7.. Model for SUGP1-DHX15 and proofreading at early spliceosome assembly
Left panel: On weak splice sites the transition from E complex to A complex is inhibited as PB binds to the U2 snRNP and prevents the full binding of the branch helix and recognition of the BP-A. These stalled spliceosomes are recognized by SUGP1-DHX15 and are discarded. Less mRNA is being produced in this scenario and more alternatively spliced mRNAs result. Right panel: Mutation in SUGP1 weakens SUGP1 interaction with DHX15, removing the proofreading & discard pathway, allowing more time to assemble A complex and to proceed with splicing.

References

    1. Alsafadi S, Dayot S, Tarin M, Houy A, Bellanger D, Cornella M, Wassef M, Waterfall JJ, Lehnert E, Roman-Roman S, et al. (2021). Genetic alterations of SUGP1 mimic mutant-SF3B1 splice pattern in lung adenocarcinoma and other cancers. Oncogene 40, 85–96. - PMC - PubMed
    1. Anzalone AV, Koblan LW, and Liu DR (2020). Genome editing with CRISPR-Cas nucleases, base editors, transposases and prime editors. Nat Biotechnol 38, 824–844. - PubMed
    1. Beigl TB, Kjosas I, Seljeseth E, Glomnes N, and Aksnes H (2020). Efficient and crucial quality control of HAP1 cell ploidy status. Biol Open 9. - PMC - PubMed
    1. Bejar R (2016). Splicing Factor Mutations in Cancer. Advances in experimental medicine and biology 907, 215–228. - PubMed
    1. Blencowe BJ (2017). The Relationship between Alternative Splicing and Proteomic Complexity. Trends in biochemical sciences 42, 407–408. - PubMed

Publication types