. 2023 Jul 4;6(9):e202201880.
doi: 10.26508/lsa.202201880. Print 2023 Sep.

ACE2-EGFR-MAPK signaling contributes to SARS-CoV-2 infection

Affiliations

ACE2-EGFR-MAPK signaling contributes to SARS-CoV-2 infection

Melanie Engler et al. Life Sci Alliance. .

Abstract

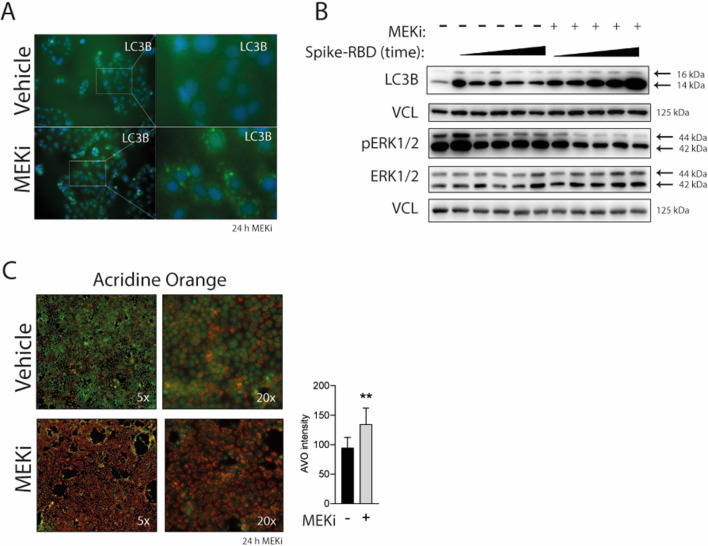
SARS-CoV-2 triggered the most severe pandemic of recent times. To enter into a host cell, SARS-CoV-2 binds to the angiotensin-converting enzyme 2 (ACE2). However, subsequent studies indicated that other cell membrane receptors may act as virus-binding partners. Among these receptors, the epidermal growth factor receptor (EGFR) was hypothesized not only as a spike protein binder, but also to be activated in response to SARS-CoV-2. In our study, we aim at dissecting EGFR activation and its major downstream signaling pathway, the mitogen-activated signaling pathway (MAPK), in SARS-CoV-2 infection. Here, we demonstrate the activation of EGFR-MAPK signaling axis by the SARS-CoV-2 spike protein and we identify a yet unknown cross talk between ACE2 and EGFR that regulated ACE2 abundance and EGFR activation and subcellular localization, respectively. By inhibiting the EGFR-MAPK activation, we observe a reduced infection with either spike-pseudotyped particles or authentic SARS-CoV-2, thus indicating that EGFR serves as a cofactor and the activation of EGFR-MAPK contributes to SARS-CoV-2 infection.


Conflict of interest statement

The authors declare that they have no conflict of interest.

Figures

None
Graphical abstract
Figure S1.
Figure S1.. Spike-receptor-binding domain (RBD) effects on MAPK activation in A549 and MiaPaca2 cell lines and the role of angiotensin-converting enzyme 2 (ACE2) as a negative regulator of epidermal growth factor receptor (EGFR)-MAPK signaling.
(A) Immunoblot of endogenous ACE2 in total protein lysates from HEK293T, Caco-2, A549, A549 lacking the gene for the glucocorticoid receptor (GR KO) and MiaPaca2 cells. (B) mRNA transcripts relative to housekeeping genes of ACE2 and proteases involved in Spike protein cleavage in A549 and Caco-2 cells as measured using qRT-PCR. (C) Caco-2 and A549 cells were infected with VSV-based viral particles pseudotyped with SARS-CoV-2-Spike (Spike-PP) and cell entry was determined by measuring luciferase activity after 24 h. (D) Activation of ERK1/2 and MEK1/2 was determined by detecting phosphorylation level of ERK1/2 and MEK1/2 by immunoblotting in A549 and MiaPaca2 cells treated with 100 ng of Spike-RBD for indicated time points. ERK1/2 and MEK1/2 blots were used as control for their phospho-forms, whereas vinculin and pan-actin were used as loading control. (E) MAPK activation in ACE2 and EGFR siRNA-mediated knockdown (KD) Caco-2 cells after 10 min of Spike-RBD incubation. Scramble siRNA was used as negative control (NC). Target proteins were detected by immunoblotting using specific antibodies. MEK1/2 and ERK1/2 blots were used as control for their phospho-forms, whereas EGFR and ACE2 serve as KD controls, and GAPDH and vinculin were used as loading controls. (F, G) Caco-2 cells transfected with EGFP-CRAF plasmid were treated with 100 ng Spike-RBD for 10 min. (F) Spike-RBD-induced activation of endogenous CRAF (endo-CRAF) and recombinant CRAF (rec-CRAF) was detected by immunoblotting using specific antibody against activating phosphorylation at Ser338 of CRAF. (G) Spike-RBD-induced complex formation of EGFP-CRAF with EGFR and ACE2 in response to Spike-RBD treatment for 10 min was analyzed by subjecting Caco-2 cells expressing EGFP-rec-CRAF to GFP-TRAP assay. Protein levels were determined by immunoblotting in the input, flow-through (FT), and GFP-TRAP–precipitated fraction (GFP-TRAP). (H) HEK293T cells were transfected with human ACE2 (rec-ACE2) and stimulated with 10 ng/ml EGF for 10 min. Total cell lysates were used for pull down (PD) assay using GST-CRAF-RBD as bait, followed by immunoblotting, using RAS antibody to detect active GTP-bound RAS.
Figure 1.
Figure 1.. Treatment of Caco-2 cells with the receptor-binding domain (RBD) of the SARS-CoV-2 spike protein (Spike-RBD) leads to epidermal growth factor receptor (EGFR)-MAPK pathway activation.
(A) Activation of EGFR-MAPK signaling was determined by detecting phosphorylation level of ERK1/2, CRAF, and EGFR by immunoblotting in Caco-2 cells treated with 100 ng Spike-RBD for 10 min. Data for quantification (right graphs) were normalized to total protein amounts of ERK1/2, CRAF or EGFR, and loading controls, respectively. Spike-RBD binding to the cell was proven by immunoblotting using a His-tag specific antibody, whereas vinculin serves as loading control. Asterisks indicate a significant difference from controls (P < 0.05, t test). Error bars represent the SD of n = 3 independent experiments. (B) Caco-2 cells were treated with 100 ng/ml Spike-RBD for the indicated time points and activation of ERK1/2 was detected by immunoblotting using a phospho-ERK1/2-specific antibody. (C) Graphical illustration of Spike-RBD-induced EGFR-MAPK activation in the presence of inhibitors and neutralizing antibodies. (D) MAPK activation in response to Spike-RBD in the presence of viral entry inhibitors to determine the specificity of Spike-RBD-mediated MAPK activation. Caco-2 cells were treated with Spike-RBD (100 ng/ml) for 10 min in the presence or absence of SARS-CoV-2-neutralising antibodies (bamlanivimab, casirivimab, and imdevimab, all 10 μg/ml added 30 min before Spike-RBD). The MEK inhibitor U0126 (10 μM) was used as a control of MAPK activation. Phosphorylation of EGFR, CRAF, MEK1/2, ERK1/2 was analyzed by immunoblotting using phosphorylation-specific antibodies. Spike-RBD recombinant protein was determined using antibodies raised against His-tag. Source data are available for this figure.
Figure 2.
Figure 2.. Spike-receptor-binding domain (RBD) binding induces the localization of angiotensin-converting enzyme 2 (ACE2) and epidermal growth factor receptor (EGFR) to active RAS–CRAF kinase complexes.
(A, B, C, D) The effect of siRNA-mediate knock down (KD) of ACE2 and EGFR on Spike-RBD induced EGFR-MAPK activation in Caco-2 cells. (A) Quantification of MAPK activation, ACE2 abundance, and Spike-RBD binding in scramble control (NC), EGFR, and ACE2 KD cells after 10 min of Spike-RBD incubation. Target proteins were detected by immunoblotting using specific antibodies. MEK1/2 and ERK1/2 blots were used as controls for their phospho-forms, whereas GAPDH and vinculin were used as loading controls. (B) Quantification of RAS and EGFR activation in ACE2 KD cells after a 10-min Spike-RBD treatment. Active RAS were monitored by pull down assay using as bait GST fused to CRAF kinase RAS-binding domain (CRAF-RBD), followed by immunoblotting. Equal levels of bait levels were verified by Ponceau S staining. Quantification was performed using Image Lab software; phospho-proteins were normalized to their total levels and loading controls and active RAS was normalized to the total RAS levels and loading control. (C) Detection of ACE2 in complexes of CRAF kinase was monitored by pull down assay using GST-CRAF-RBD in ACE2 KD and scramble control (NC) Caco-2 cells. ACE2 in pull down samples was tested using ACE2 antibody, whereas vinculin was used as loading control. GST-CRAF-RBD equal loading was performed via Ponceau S staining. (D) Detection of ACE2 and EGFR in CRAF kinase complexes in response to ACE2 KD and Spike-RBD stimulation for 10 min. ACE2 and EGFR presence in CRAF complexes were determined by pull down assay using GST-CRAF-RBD. ACE2 and EGFR in pull down samples were monitored using ACE2 and EGFR antibodies, respectively, whereas vinculin was used loading control. GST-CRAF-RBD equal loading was performed via Ponceau S staining. (E, F, G) Expression of recombinant ACE2 (rec-ACE2) inhibits RAS-MAPK signaling in HEK293T cells. Activation of the MAPK pathway was detected by immunoblotting using phospho-specific antibodies, EGFR, CRAF, and ERK1/2 blots were used as control for their phospho-forms, whereas pan-actin and vinculin serve as loading controls. (E) Activation of MAPK was analyzed in Mock and rec-ACE2 cells either under starvation or EGF induction (10 ng/ml for 10 min). Quantification of CRAF and ERK1/2 activation was done in EGF-induced samples only. (F) Activation of MAPK was analyzed in Mock and rec-ACE2 cells only under starvation. (G) EGF-induced activation of RAS was monitored by pull down assay using GST-CRAF-RBD, followed by immunoblotting using pan-RAS-specific antibody. Data information: (A, B, E, G), data are represented as single data points and mean ± SD, (F) as single data points, of n = 3 independent experiments. Asterisks indicate a significant difference from controls P < 0.05 (t test). Source data are available for this figure.
Figure 3.
Figure 3.. Activation of the MAPK by Spike-receptor-binding domain (RBD) is reduced by epidermal growth factor receptor (EGFR) and MEK1/2 inhibitors.
(A) Inhibition of ERK1/2 and EGFR activation by the MEK1/2 inhibitor (MEKi) U0126 (10 μM) and EGFR inhibitor erlotinib (5 μM) in the presence of Spike-RBD. Caco-2 cells were treated with the respective inhibitor 30 min before the addition of Spike-RBD (100 ng/ml) for 10 min. Active ERK1/2 and EGFR levels were monitored in total cell lysates by phospho-specific antibodies, whereas total levels were determined with ERK1/2 and EGFR antibodies. Vinculin was used as loading control. Quantification of active levels of ERK1/2 (pERK1/2) and EGFR (pEGFR), normalized to their total levels and loading controls, respectively. Data information: data are represented as single data points and mean ± SD of n = 3 independent experiments. Asterisks indicate a significant difference from controls P < 0.05 (t test). (B) EGFR translocation to vesicular compartments in response to MEKi. Caco-2 cells were treated with MEKi (10 μM) for 24 h and EGFR localization was determined by immunofluorescence using anti-EGFR antibody coupled to AlexaFluor 488 (green). Nuclei are counterstained with DAPI (blue), whereas polymerized actin filaments were stained using phalloidin coupled to AlexaFluor 594 (red). Quantification of intracellular EGFR intensity was performed using the CellProfiler software. Data information: data are represented as single data points per cell and mean ± SD. Asterisks indicate a significant difference from controls P < 0.05 (one-way ANOVA). (C) EGFR translocation to early endosomes in response to MEKi (10 μM). Caco-2 cells were treated with MEKi for different time points and immunofluorescence staining of EGFR coupled to AlexaFluor 594 (red) and EEA1 coupled to AlexaFluor 488 (green) was performed. Representative picture shows colocalization after 25 min of MEKi treatment. Arrows indicate subcellular localization or colocalization of the tested targets. Source data are available for this figure.
Figure S2.
Figure S2.. Epidermal growth factor receptor (EGFR) and MEK1/2 inhibitors inhibit MAPK activation and induce EGFR translocation.
(A) Blots used for quantification of Fig 3A. Inhibition of ERK1/2 and EGFR activation by MEKi (10 µM) and EGFRi (5 µM) in Caco-2 cells treated with 100 ng/ml Spike RBD for 10 min. Active ERK1/2 and EGFR levels were monitored in total cell lysates by phospho-specific antibodies, whereas total levels were determined with ERK1/2 and EGFR antibodies. Vinculin was used as loading control. (B) EGFR translocation to vesicular compartments in response to EGFRi (erlotinib). Cells were treated with EGFRi for 24 h and EGFR localization was determined by immunofluorescence using anti-EGFR antibody coupled to AlexaFluor 488 (green). Nuclei are counterstained with DAPI (blue), whereas polymerized actin filaments were stained using Phalloidin coupled to AlexaFluor 594 (red). (C) EGFR translocation to early endosomes in response to MEKi. Caco-2 cells were treated with MEKi (10 µM) for 3 or 6 h and immunofluorescence staining of EGFR coupled to AlexaFluor 594 (red) and EEA1 coupled to AlexaFluor 488 (green) was performed. (D) Caco-2 cells were treated with MEKi (10 μM) for indicated timepoints and co-staining was performed using EGFR coupled to AlexaFluor 594 (red) and LC-3B coupled to AlexaFluor 488 (green) was performed.
Figure S3.
Figure S3.. MEK1/2 inhibitor enhances autophagic flux and the amount of acidic vesicles.
(A) Representative immunofluorescence images of LC3-B coupled to Alexa-488 (green) in control and MEKi (10 μM)-treated Caco-2 cells. Nuclei were counterstained with DAPI. (B) Caco-2 cells were treated with Spike RBD (100 ng/ml) in combination with DMSO or MEKi (10 μM) over the period of 24 h. Levels of LC3-B, and ration of LC3-I to LC3-II, were analyzed via immunoblotting at different time points (10, 30, and 60 min, 6 and 24 h). (C) Acridine orange was used to label acidic vesicular organelles in control and MEKi-treated cells after 24 h. Acidic vesicular organelle intensity was quantified using image J.
Figure S4.
Figure S4.. MEK1/2 inhibitor effect on cell viability, and Spike-PP infection in response to epidermal growth factor receptor (EGFR) inhibitor (erlotinib) and angiotensin-converting enzyme 2 (ACE2) and EGFR knockdown (KD), respectively.
(A) Inhibition of ERK1/2 and MEK1/2 activation by the MEK1/2 inhibitor (MEKi) U0126 (10 μM) in the presence of Spike-PP. Caco-2 cells were treated with MEKi 30 min before the addition of Spike-PP for 10 min. Active ERK1/2 and MEK1/2 levels were monitored in total cell lysates by phospho-specific antibodies, whereas total levels were determined with ERK1/2 and MEK1/2 antibodies. Vinculin was used as loading control. (B) Immunofluorescence staining of Caco-2 cells incubated with Spike-PP using phospho-ERK1/2-specific antibody coupled to AlexaFluor 594 (red), whereas infected cells were identified by EGFP expression (green). Nuclei were counterstained using DAPI. (C) EGFR and ERK1/2 was monitored using phosphorylation-specific antibodies in protein lysates of Caco-2 cells treated for 10 min with VSV-G-PP and Spike-PP by immunoblotting. EGFR and ERK1/2 blots were used as control for their phospho-forms, whereas GAPDH was used as loading control. Quantification of phosphorylated EGFR and ERK1/2, normalized to total levels and loading control, respectively. (D, E) Cytotoxic effects of MEKi (U0126) and EGFRi (erlotinib). (D) Relative cell viability of Caco2 cells in the presence of indicated MEKi or EGFRi concentrations as determined by presto blue measurements after 24 h. (E) Detection of cleaved caspase 3 (c-Casp3) in total cell lysates from Caco2 cells treated for 24 h with 10 μM MEKi or 100 μM chloroquine (CQ). ß-actin was used as loading control. (F) Caco-2 cells were infected with Spike-PP and cell entry was determined by measuring luciferase activity after 24 h in the presence of indicated concentrations of EGFR inhibitor. Asterisks indicate a significant difference from control (**P < 0.01; ***P < 0.001; ****P < 0.0001; one-way ANOVA). (G) ACE2 and EGFR KD cells were generated using siRNAs targeting ACE2 or EGFR, respectively. Scramble siRNA was included as negative control (NC). KD and NC cells were infected with Spike-PP and counterstained with Hoechst after 24 h. Replicates were used for quantification of Fig 4B.
Figure 4.
Figure 4.. Epidermal growth factor receptor (EGFR) is a co-factor for SARS-CoV-2-pseudotyped VSV particles.
(A) Inhibition of MEK1/2 reduces SARS-CoV-2 infection in Caco-2 cells. Cells were infected with VSV-based viral particles pseudotyped with SARS-CoV-2-Spike (Spike-PP) and cell entry was determined by measuring luciferase activity after 9, 16, and 24 h in control (vehicle), MEKi (U0126, 10 μM) or EK1 (fusion inhibitor, 5 μM)-treated cells. Representative images on the right showing Spike-PP infected cells (green). (B) ACE2 and EGFR knock down cells were generated using siRNAs targeting ACE2 or EGFR, respectively. Scramble siRNA was included as negative control (NC). KD and NC cells were infected with Spike-PP and the percentage of infected cells (green) after 24 h was calculated using Hoechst (blue) to counterstain the nuclei. (C) EGFR and ERK1/2 activation was monitored at different time points using phosphorylation-specific antibodies in total cell lysates of control particles pseudotyped with VSV glycoproteins (VSVG-PP) and Spike-PP-treated cells. EGFR and ERK1/2 blots were used as control for their phospho-forms, whereas vinculin was used as loading control. ACE2 and EGFR in CRAF kinase complexes in response to Spike-PP were determined by a pull down (PD) assay using GST-CRAF-RBD followed by immunoblotting, using ACE2 and EGFR antibodies, respectively. Ponceau S staining of GST-CRAF-RBD served as loading control. (D) Detection of ACE2 and EGFR in CRAF kinase complexes in response to 10 min of incubation of Spike-PP alone or in combination with EK-1 (5 μM) or bamlanivimab (10 μg/ml). ACE2 and EGFR presences in CRAF complexes were determined by a PD assay using GST-CRAF-RBD followed by immunoblotting, using ACE2 and EGFR antibodies, respectively. Activation of RAS was monitored in the PD samples using a panRAS antibody. Ponceau S staining of GST-CRAF-RBD served as loading control for the bait, and ACE2, EGFR, panRAS, and vinculin served as controls in total cell lysates. (E, F) EGFR and phospho-EGFR localization in response to VSVG-PP and Spike-PP incubation for 24 h. Nuclei are counterstained with DAPI (blue), whereas EYFP expression was monitored to identify infected cells. (E) EGFR localization was determined by immunofluorescence using an anti-EGFR antibody coupled to AlexaFluor 594 (red). (F) Activation of EGFR was monitored by phospho-EGFR Tyr1068-specific antibody coupled to AlexaFluor 594 (red). Data information: (A, B), data are presented as single data points and mean ± SD of n = 4 independent experiments. Asterisks indicate a significant difference from controls P < 0.05 (one-way ANOVA). Source data are available for this figure.
Figure 5.
Figure 5.. Inhibition of epidermal growth factor receptor (EGFR)-MAPK signaling reduces infection with authentic SARS-CoV-2.
(A, B) Immunolocalization of EGFR (A) and phospho-EGFR (B), both coupled to AlexaFluor 594 (red) in response to 24 h SARS-CoV-2 infection. Nuclei are counterstained with DAPI (blue), whereas anti-SARS-CoV-2 nucleocapsid (NC) antibody coupled to Alex 488 (green) was used to identify infected cells. Pictures were analyzed using CellProfiler to quantify EGFR translocation and phospho-EGFR intensity within the nuclear/perinuclear space. Data information: data are presented as single data points and mean ± SD of single-cell intensities. Asterisks indicate a significant difference from controls P < 0.05 (one-way ANOVA). (C) Authentic SARS-CoV-2 leads to increased EGFR activation and is abolished by MEKi. Caco-2 cells were infected with SARS-CoV-2 in the presence or absence of MEKi and were analyzed after 10 min via immunoblotting. Activation of EGFR was detected using phospho-Tyr1068-specific antibody, EGFR blot was used as control for total protein amount, whereas vinculin was used as loading control. Quantification of active phosphorylated EGFR, normalized to total EGFR and loading controls, respectively. Data information: data are presented as single data points and mean ± SD of n = 3 independent experiments. Asterisks indicate a significant difference from controls P < 0.05 (t test). (D) Viral infection was quantified after 24 h in control (vehicle) and MEKi-treated cells. Infected cells were identified by staining for SARS-CoV-2 nucleocapsid protein using anti-NC antibody coupled to Alexa 488 (green) and nuclei were counterstained with DAPI (blue) for quantification using CellProfiler software. Data information: data are presented as single data points and mean ± SD of n = 5 independent experiments. Asterisks indicate a significant difference from controls P < 0.05 (t test). (E) Infection rates in Caco-2 cells were quantified by qRT-PCR (1 d post-infection) and TCID50 (2 d post-infection). Data represents two independent experiments, each performed in triplicates. Arrows indicate subcellular localization of tested targets. Source data are available for this figure.
Figure S5.
Figure S5.. Fluorescence microscopy and immunoblots of Caco2 cells infected with authentic SARS-CoV-2.
(A) Immunoblots used for the quantification are depicted in Fig 5C. Authentic SARS-CoV-2 induced activation of EGFR after 10 min and inhibition by MEKi. Active EGFR levels were monitored in total cell lysates by phospho-specific antibodies at Tyr1068, whereas total levels were determined with EGFR antibodies. Vinculin, actin, and GAPDH were used as loading control. (B) Viral infection was quantified after 24 h in control (vehicle) and MEKi-treated cells. Infected cells were identified by staining for SARS-CoV-2 nucleocapsid protein using anti-NC antibody coupled to Alexa488 (green) and nuclei were counterstained with DAPI (blue). Replicates were used for quantification of Fig 5D. (C) Infection rates in Caco-2 cells were quantified by qRT-PCR (1 d postinfection) and TCID50 (2 d postinfection). Data represent two independent experiments, each performed in triplicates. Plots were created with GraphPad Prism 9.

References

    1. Albiges L, Foulon S, Bayle A, Gachot B, Pommeret F, Willekens C, Stoclin A, Merad M, Griscelli F, Lacroix L, et al. (2020) Determinants of the outcomes of patients with cancer infected with SARS-CoV-2: Results from the Gustave Roussy cohort. Nat Cancer 1: 965–975. 10.1038/s43018-020-00120-5 - DOI - PubMed
    1. Bayati A, Kumar R, Francis V, Mcpherson PS (2021) SARS-CoV-2 infects cells after viral entry via clathrin-mediated endocytosis. J Biol Chem 296: 100306. 10.1016/j.jbc.2021.100306 - DOI - PMC - PubMed
    1. Bestle D, Heindl MR, Limburg H, Van Lam van T, Pilgram O, Moulton H, Stein DA, Hardes K, Eickmann M, Dolnik O, et al. (2020) TMPRSS2 and furin are both essential for proteolytic activation of SARS-CoV-2 in human airway cells. Life Sci Alliance 3: e202000786. 10.26508/LSA.202000786 - DOI - PMC - PubMed
    1. Blandin AF, Cruz Da Silva E, Mercier MC, Glushonkov O, Didier P, Dedieu S, Schneider C, Devy J, Etienne-Selloum N, Dontenwill M, et al. (2021) Gefitinib induces EGFR and α5β1 integrin co-endocytosis in glioblastoma cells. Cell Mol Life Sci 78: 2949–2962. 10.1007/s00018-020-03686-6 - DOI - PMC - PubMed
    1. Braicu C, Buse M, Busuioc C, Drula R, Gulei D, Raduly L, Rusu A, Irimie A, Atanasov AG, Slaby O, et al. (2019) A comprehensive review on MAPK: A promising therapeutic target in cancer. Cancers (Basel) 11: 1618. 10.3390/cancers11101618 - DOI - PMC - PubMed

Publication types