. 2023 Jul 5;14(1):3958.
doi: 10.1038/s41467-023-39761-2.

Whole genome sequencing identifies genetic variants associated with neurogenic inflammation in rosacea

Affiliations

Whole genome sequencing identifies genetic variants associated with neurogenic inflammation in rosacea

Zhili Deng et al. Nat Commun. .

Abstract

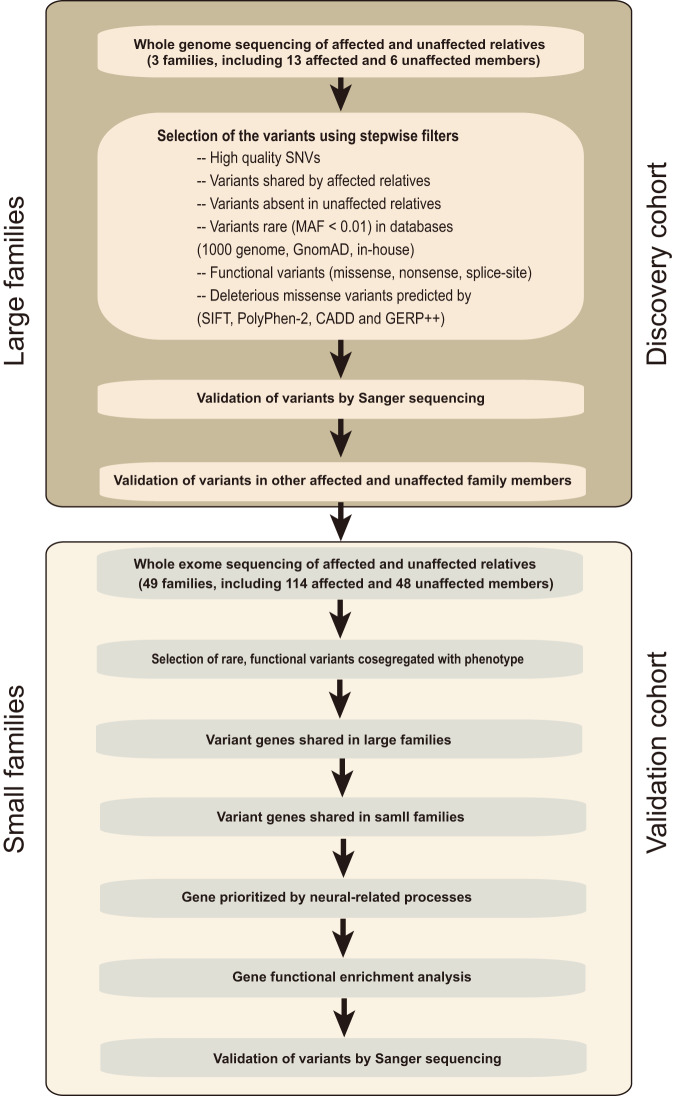
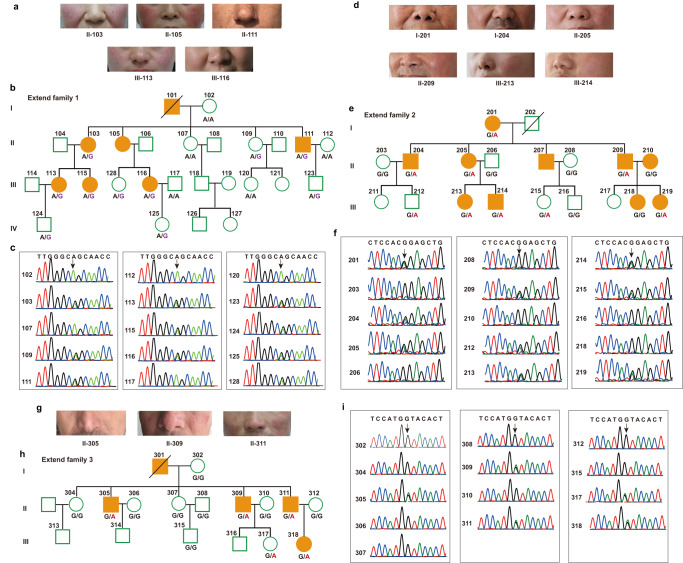
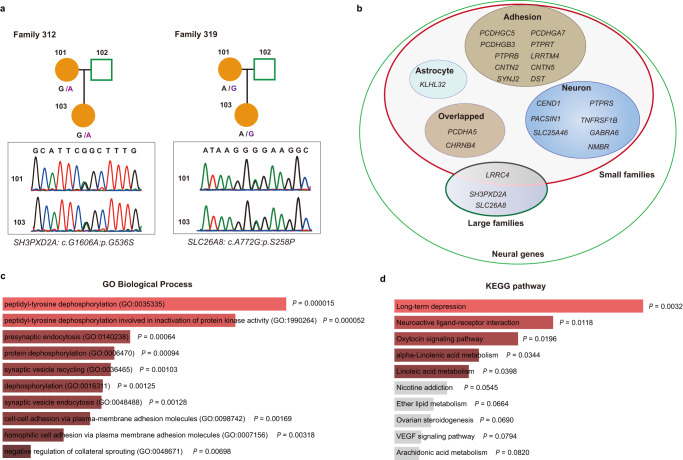
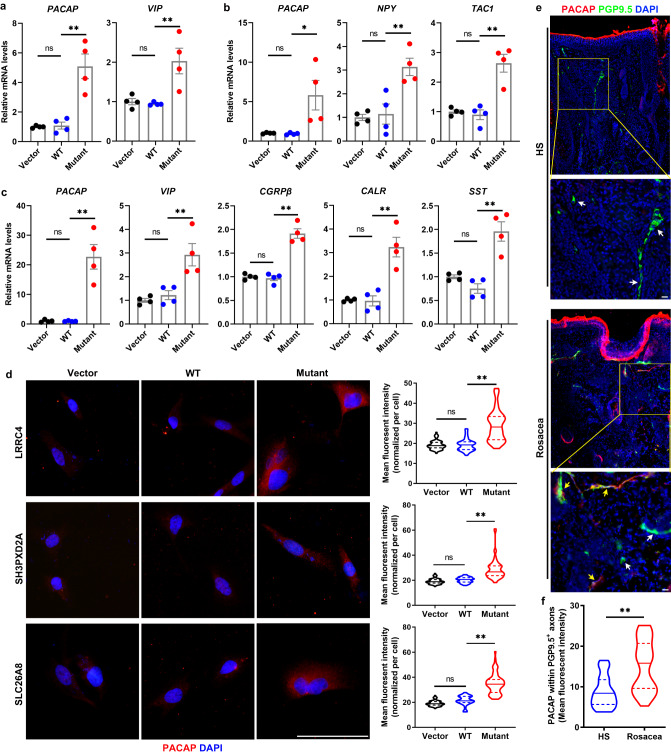
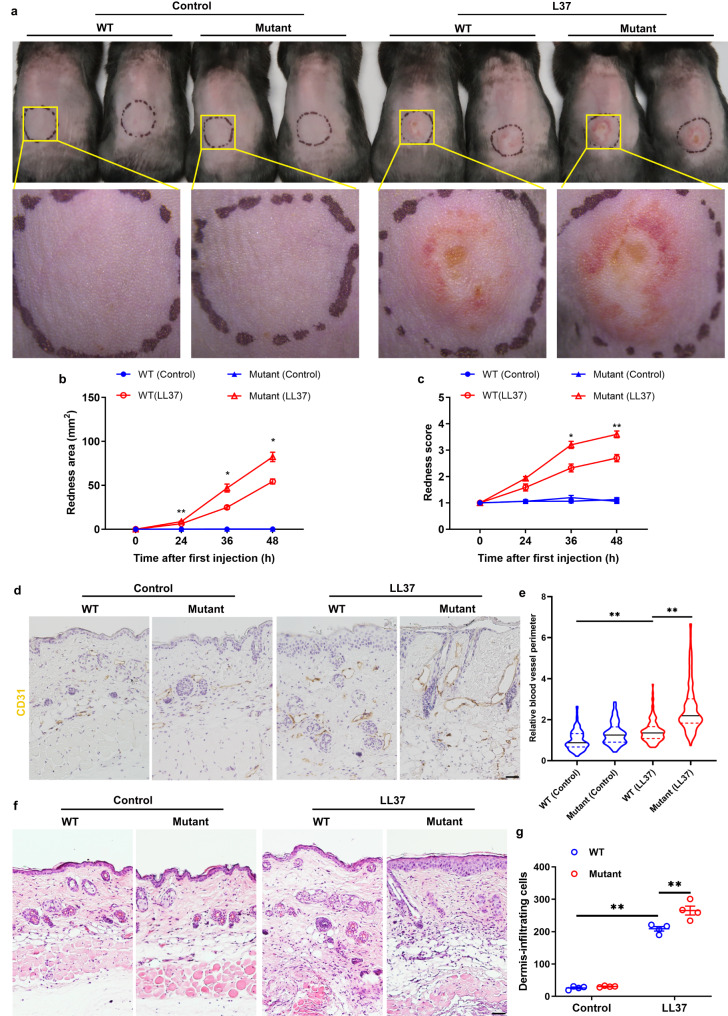
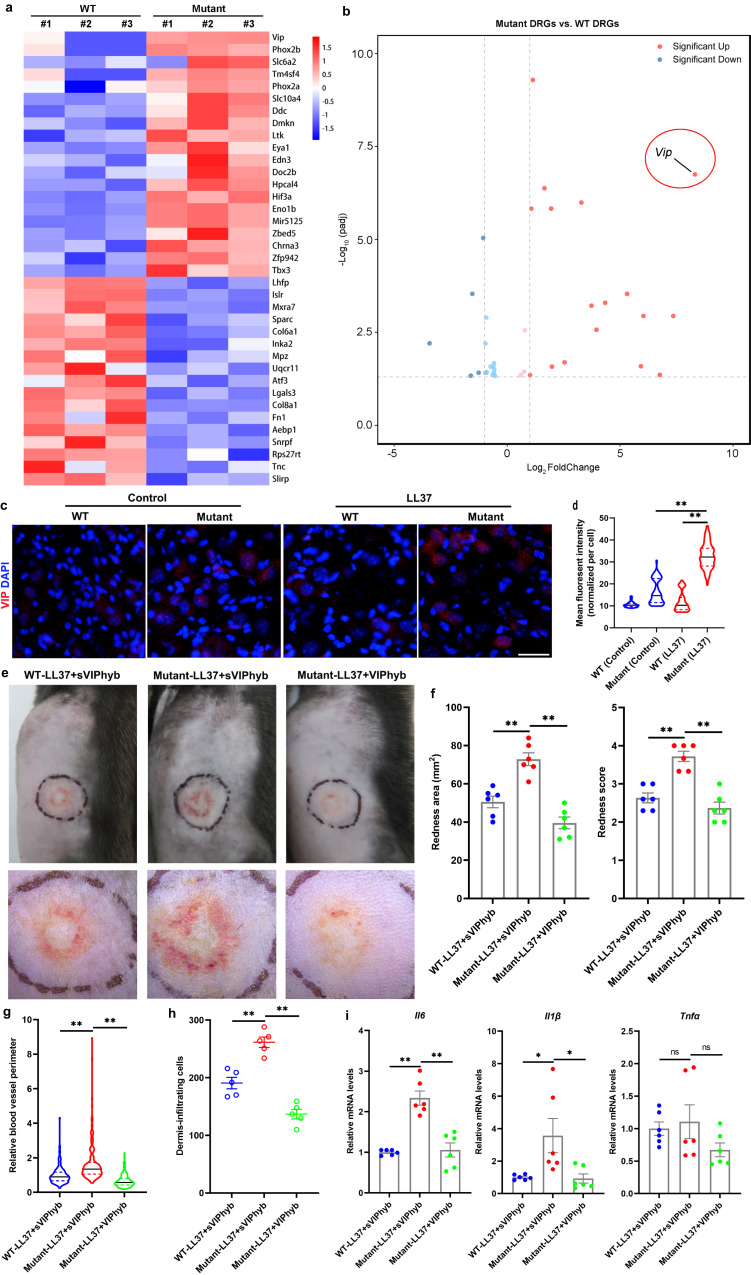
Rosacea is a chronic inflammatory skin disorder with high incidence rate. Although genetic predisposition to rosacea is suggested by existing evidence, the genetic basis remains largely unknown. Here we present the integrated results of whole genome sequencing (WGS) in 3 large rosacea families and whole exome sequencing (WES) in 49 additional validation families. We identify single rare deleterious variants of LRRC4, SH3PXD2A and SLC26A8 in large families, respectively. The relevance of SH3PXD2A, SLC26A8 and LRR family genes in rosacea predisposition is underscored by presence of additional variants in independent families. Gene ontology analysis suggests that these genes encode proteins taking part in neural synaptic processes and cell adhesion. In vitro functional analysis shows that mutations in LRRC4, SH3PXD2A and SLC26A8 induce the production of vasoactive neuropeptides in human neural cells. In a mouse model recapitulating a recurrent Lrrc4 mutation from human patients, we find rosacea-like skin inflammation, underpinned by excessive vasoactive intestinal peptide (VIP) release by peripheral neurons. These findings strongly support familial inheritance and neurogenic inflammation in rosacea development and provide mechanistic insight into the etiopathogenesis of the condition.


Conflict of interest statement

The authors declare no competing interests.

Figures

Fig. 1
Fig. 1. Overview of the study design for sequencing data analysis.
Flowchart of the variant filtering strategy for whole-genome sequencing in multiplex large families, and candidate gene prioritization and gene set enrichment of whole-exome sequencing in small families. MAF minor allele frequency, GnomAD Genome Aggregation Database, SIFT Sorting Intolerant From Tolerant, Polyphen2 Polymorphism Phenotyping v2, CADD Combined Annotation-Dependent Depletion, GERP++ Genome Evolutionary Rate Profiling version 2.
Fig. 2
Fig. 2. Single rare deleterious variants are identified in large rosacea families.
ac Images show the individuals with typical rosacea phenotypes in their central faces in large family 1 (a). Pedigree structure of the large family 1 (b). Solid symbols indicate individuals affected with rosacea; open symbols denote unaffected relatives; squares indicate male individuals; circles denote female individuals and slashes show deceased members. Chromatograms of Sanger sequencing show the heterozygous mutation in LRRC4 in large family 1 (c). df Images show the individuals affected with rosacea (d), pedigree structure (e), and Sanger sequencing chromatograms show the heterozygous mutation in SH3PXD2A (f) in large family 2. gi Images show the individuals affected with rosacea (g), pedigree structure (h), and Sanger sequencing chromatograms show the heterozygous mutation in SLC26A8 (i) in large family 3.
Fig. 3
Fig. 3. Variant genes are replicated in small families and highlight the neural function.
a Additional variants in SH3PXD2A and SLC26A8 were occurred in small families 312 and 319, respectively. b Functional category of neural-related gene set identified by WGS and WES, respectively, in large and small families. c Gene ontology (GO) analysis suggested neural synaptic processes and cell adhesion were functional categories for candidate genes. d KEGG pathway enrichment indicated long-term depression and neuroactive ligand-receptor interaction were significantly highlighted. The Fisher exact test (two-sided) was used for GO and KEGG enrichment.
Fig. 4
Fig. 4. Mutation of LRRC4/SH3PXD2A/SLC26A8 increases vasoactive neuropeptides in human neural cells.
ac The relative mRNA expression levels of PACAP, VIP, NPY, CGRPβ, TAC1, CALR, and SST in human neural cells transfected respectively with LRRC4 (a), SH3PXD2A (b), and SLC26A8 (c) mutant/wild-type (WT)/Control vector plasmids (n = 4 biologically independent experiments). a PACAP: Mutant vs WT, P = 0.0009; WT vs Vector, P = 0.9992, VIP: Mutant vs WT, P = 0.0094; WT vs Vector, P = 0.9961. b PACAP: Mutant vs WT, P = 0.0324; WT vs Vector, P > 0.9999, NPY: Mutant vs WT, P = 0.0064; WT vs Vector, P = 0.9874, TAC1: Mutant vs WT, P = 0.0005; WT vs Vector, P = 0.9795. c PACAP: Mutant vs WT, P = 0.0004; WT vs Vector, P > 0.9999, VIP: Mutant vs WT, P = 0.0086; WT vs Vector, P = 0.9417, CGRPβ: Mutant vs WT, P < 0.0001; WT vs Vector, P = 0.9866, CALR: Mutant vs WT, P = 0.0006; WT vs Vector, P = 0.9996, SST: Mutant vs WT, P = 0.0004; WT vs Vector, P = 0.5298. d Immunostaining of PACAP in human neural cells transfected respectively with LRRC4, SH3PXD2A, and SLC26A8 mutant/WT/control vector plasmids. Right panels, the quantification of mean fluorescent intensity for PACAP in the corresponding groups. n = 42–71 cells from three independent experiments. LRRC4: Mutant vs WT, P < 0.0001; WT vs Vector, P = 0.9976, SH3PXD2A: Mutant vs WT, P < 0.0001; WT vs Vector, P = 0.5517, SLC26A8: Mutant vs WT, P < 0.0001; WT vs Vector, P = 0.0612. e Co-immunostaining of PACAP and PGP9.5 on skin sections from rosacea patients (rosacea, n = 6) and healthy individuals (HS, n = 5). Higher-magnified images of yellow boxed areas are shown below the lower-magnified images for each group. Scale bar, 50 μm. Yellow arrowheads indicate PGP9.5 positive neuron axon with strong co-immunostaining signals of PACAP; White arrowheads indicate PGP9.5 positive neuron axon with low or no immunostaining signals of PACAP. f Quantification of mean fluorescent intensity for PACAP in PGP9.5 positive neuron fibers (n = 25 for HS; n = 35 for rosacea). P < 0.0001. DAPI staining (blue) indicates nuclear localization. Scale bar, 50 μm. All results are representative of at least three independent experiments. Data represent the mean ± SEM. *P < 0.05, **P < 0.01. ns indicates no significance. One-way ANOVA with Bonferroni’s post hoc test (ad) or two-tailed unpaired Student’s t test (f) was used.
Fig. 5
Fig. 5. Lrrc4 mutation facilitates the development of rosacea in mice.
a The back skins of WT and Lrrc4 L385P mutant mice intradermally injected with LL37 or control vehicle. Images were taken 48 h after the first LL37 injection. Below panels, magnified images of yellow boxed areas. b, c The severity of the rosacea-like phenotypes after first LL37 injection for 24, 36, and 48 h, was assessed with the redness area (b) and score (c) (n = 5 for each group). *P < 0.01, **P < 0.01, comparison between Lrrc4 mutant (LL37) and WT (LL37) group. b 24 h, P = 0.009; 36 h, P = 0.0197; 48 h, P = 0.0128. c 24 h, P = 0.1917; 36 h, P = 0.0109; 48 h, P = 0.0053. d Immunohistochemistry (IHC) of CD31 on skin sections from WT and Lrrc4 mutant mice treated with LL37 or control vehicle. Scale bar, 50 μm. e Quantification of relative blood vessel perimeter in the corresponding groups displayed with violin plot. n = 90–132 blood vessels from four independent mice for each group. Mutant (LL37) vs WT (LL37), P < 0.0001; WT (LL37) vs WT (Control), P < 0.0001. f HE staining of lesional skin sections from WT and mutant mice treated with LL37 or control vehicle. Scale bar, 50 μm. g Dermal infiltrating cells were quantified (n = 4 mice for each group). Mutant (LL37) vs WT (LL37), P = 0.0013; WT (LL37) vs WT (Control), P < 0.0001. All results are representative of at least three independent experiments. Data represent the mean ± SEM. *P < 0.05, **P < 0.01. Two-way ANOVA with Bonferroni’s post hoc test was used.
Fig. 6
Fig. 6. Blockade of VIP signaling alleviates rosacea-like phenotypes in mice harboring Lrrc4 mutation.
a Heatmap of differentially regulated genes in DRGs from mutant and WT mice both injected with LL37 determined by RNA-sequencing (n = 3 independent biological samples for each group). Blue color denotes low FPKM expression; red, high FPKM expression. b Volcano plot of differentially regulated genes in DRGs from mutant and WT mice both injected with LL37 (n = 3 mice for each group). The red dots show the significantly upregulated genes; blue dots, significantly downregulated genes (P < 0.05). Vip is highlighted with red circle. c Immunostaining of VIP on sections of DRGs from WT and mutant mice treated with LL37 or control vehicle. Scale bar, 50 μm. d Quantification of mean fluorescent intensity for VIP in each neural cell in DRGs (n = 100 cells from three independent mice for each group). Mutant (LL37) vs WT (LL37), P < 0.0001; Mutant (LL37) vs Mutant (Control), P < 0.0001. e The back skins of LL37-administered WT and L385P mutant mice intradermally injected with VIPhyb or scrambled VIPhyp peptides (sVIPhyp). Images were taken 48 h after the first LL37 injection. Below panels, magnified images of black dotted circle areas. f The severity of the rosacea-like features after first LL37 injection for 48 h, was evaluated with the redness area and score (n = 6 mice for each group). Redness area: Mutant-LL37+sVIPhyb vs WT-LL37+sVIPhyb, P = 0.0005; Mutant-LL37+VIPhyb vs Mutant-LL37+sVIPhyb, P < 0.0001. Redness score: Mutant-LL37+sVIPhyb vs WT-LL37+sVIPhyb, P = 0.0002; Mutant-LL37+VIPhyb vs Mutant-LL37+sVIPhyb, P < 0.0001. g Quantification of relative blood vessel perimeter in the corresponding groups presented with violin plot. h Dermal infiltrating cells were quantified (n = 5 mice for each group). Mutant-LL37+sVIPhyb vs WT-LL37+sVIPhyb, P = 0.0004; Mutant-LL37+VIPhyb vs Mutant-LL37+sVIPhyb, P < 0.0001. i The relative mRNA levels of Il6, Il1β, and Tnfα in lesional skins from LL37-treated WT and Lrrc4 mutant mice intradermally injected with VIPhyb or sVIPhyp (n = 6 mice for each group). Data represent the mean ± SEM. *P < 0.05, **P < 0.01. ns indicates no significance. One-way ANOVA with Bonferroni’s post hoc test was used.

References

    1. van Zuuren EJ. Rosacea. N. Engl. J. Med. 2017;377:1754–1764. doi: 10.1056/NEJMcp1506630. - DOI - PubMed
    1. Thiboutot D, et al. Standard management options for rosacea: the 2019 update by the National Rosacea Society Expert Committee. J. Am. Acad. Dermatol. 2020;82:1501–1510. doi: 10.1016/j.jaad.2020.01.077. - DOI - PubMed
    1. Gether L, Overgaard LK, Egeberg A, Thyssen JP. Incidence and prevalence of rosacea: a systematic review and meta-analysis. Br. J. Dermatol. 2018;179:282–289. - PubMed
    1. Li J, et al. Epidemiological features of rosacea in Changsha, China: a population-based, cross-sectional study. J. Dermatol. 2020;47:497–502. doi: 10.1111/1346-8138.15301. - DOI - PubMed
    1. Buddenkotte, J. & Steinhoff, M. Recent advances in understanding and managing rosacea. F1000Res.7, (F1000 Faculty Rev):1885 (2018). - PMC - PubMed

Publication types