. 2023 Jul 4;13(1):10781.
doi: 10.1038/s41598-023-36818-6.

Cells collectively migrate during ammonium chemotaxis in Chlamydomonas reinhardtii

Affiliations

Cells collectively migrate during ammonium chemotaxis in Chlamydomonas reinhardtii

Gabela Nelson et al. Sci Rep. .

Abstract

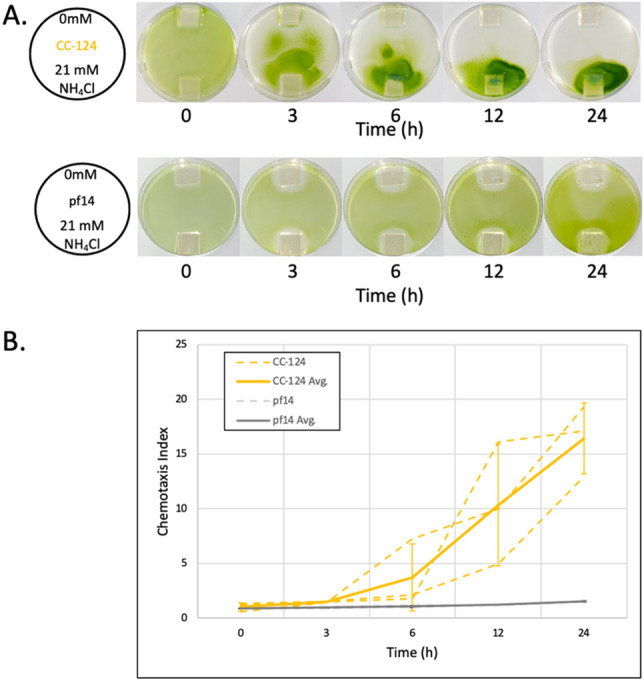
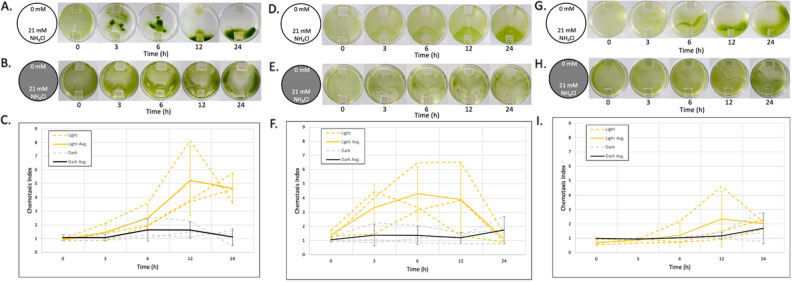
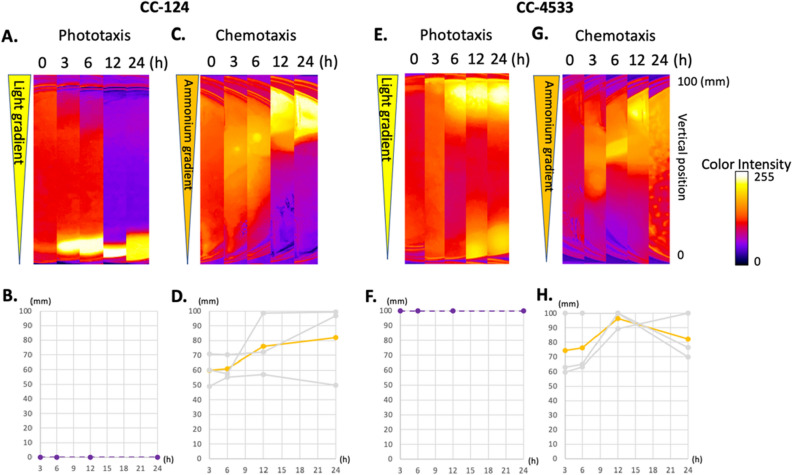
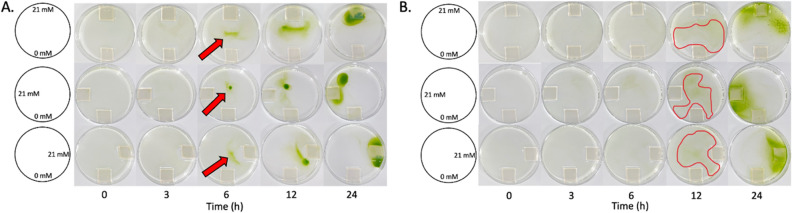
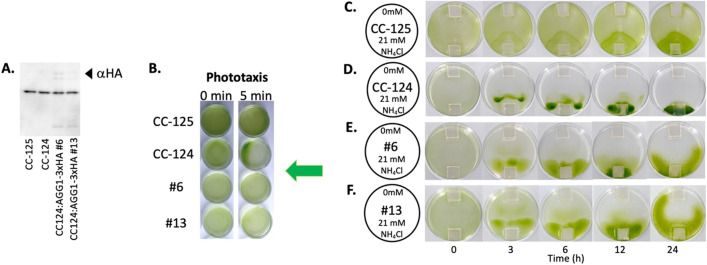
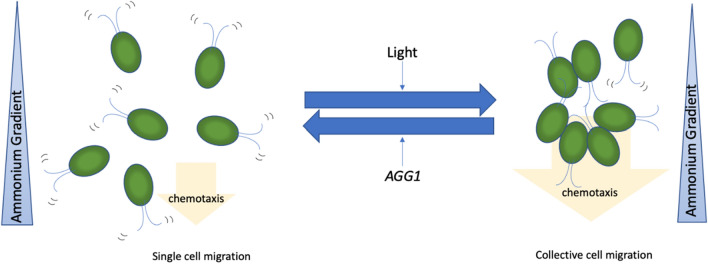
The mechanisms governing chemotaxis in Chlamydomonas reinhardtii are largely unknown compared to those regulating phototaxis despite equal importance on the migratory response in the ciliated microalga. To study chemotaxis, we made a simple modification to a conventional Petri dish assay. Using the assay, a novel mechanism governing Chlamydomonas ammonium chemotaxis was revealed. First, we found that light exposure enhances the chemotactic response of wild-type Chlamydomonas strains, yet phototaxis-incompetent mutant strains, eye3-2 and ptx1, exhibit normal chemotaxis. This suggests that Chlamydomonas transduces the light signal pathway in chemotaxis differently from that in phototaxis. Second, we found that Chlamydomonas collectively migrate during chemotaxis but not phototaxis. Collective migration during chemotaxis is not clearly observed when the assay is conducted in the dark. Third, the Chlamydomonas strain CC-124 carrying agg1-, the AGGREGATE1 gene (AGG1) null mutation, exhibited a more robust collective migratory response than strains carrying the wild-type AGG1 gene. The expression of a recombinant AGG1 protein in the CC-124 strain suppressed this collective migration during chemotaxis. Altogether, these findings suggest a unique mechanism; ammonium chemotaxis in Chlamydomonas is mainly driven by collective cell migration. Furthermore, it is proposed that collective migration is enhanced by light and suppressed by the AGG1 protein.


Conflict of interest statement

The authors declare no competing interests.

Figures

Figure 1
Figure 1
Petri dish assay and quantification for Chlamydomonas ammonium chemotaxis. (A) Photos show the directed cellular migration of a population of Chlamydomonas CC-124 over 24 h compared to the immobilized/paralyzed strain (pf14). Agarose blocks containing 0 mM and 21 mM NH4Cl were placed on the opposite sides (top and bottom, respectively, in the photos) in a Petri dish (diameter 100 mm). (B) Chemotactic Index (CI) was determined at 0, 3, 6, 12, and 24 h time points. Grey dotted lines connect the CI values at each time point. The results of three independent experiments for CC-124 and pf14 were shown (orange and dark grey dashed lines, respectively). The solid orange line connects the average CI value of CC-124 at each time point of the three independent experiments (CC-124 Avg.). The dark grey solid line connects the average CI values of pf14 at each time point of the three independent experiments (pf14 Avg.). Error bars at each time point indicate the standard deviation of the three experiments in CC-124 and pf14, respectively.
Figure 2
Figure 2
Ammonium chemotaxis of Chlamydomonas is enhanced by light across multiple strains. Chlamydomonas cells (AC: CC-124, DF: CC-125, and GI: CC-4533) were exposed to chemical gradients under homogenous white light (Light) (A, D, and G) or in the dark (Dark) (B, E, and H). An agarose block containing 0 mM NH4Cl and 21 mM NH4Cl (respectively, top and bottom in the photos) was placed in the Petri dish. Photos were taken at 0, 3, 6, 12, and 24 h time points after setup. Photos shown above each graph represent algal migration in each experiment. (C, F, and L): Orange and grey dotted lines connect the chemotaxis index (CI) values at each time point. The results of three independent experiments in light (orange dotted line, Light) and dark (grey dotted line, Dark) were shown, respectively. The solid orange line connects the average CI value with light (Light Ave.) at each time point of the three independent experiments. The dark grey solid line connects the average CI values in the dark (Dark Avg.) at each time point of the three independent experiments. Error bars at each time point indicate the standard deviation of the three experiments.
Figure 3
Figure 3
Chlamydomonas exhibit collective cell migration during ammonium chemotaxis. Phototaxis and chemotaxis of CC-124 and CC-4533. The cells were exposed to light gradients (A, B, E, F) or chemical gradients (C, D, G, H). The light gradient (~ 30 μmol photons·m−2·s−1 at the open side of the converted box) was formed from the top to the bottom of the Petri dish in the images (shown as an elongated triangle). The chemical gradient (21 mM to 0 mM NH4Cl) was formed from the top to the bottom of the Petri dish in the images (shown as an elongated triangle). After setup, the photos were taken at 0, 3, 6, 12, and 24 h time points. Changes in the local cell densities in the Petri dish for CC-124 and CC-4533 were shown as heat maps (A, C, E, G). Changes in the density center in the center strip of the dish were graphed with a function of time (B, D, F, H). The bottom and top rims of the dish in the photos were defined as 0 and 100 mm, respectively. Grey lines are the results of three independent experiments. Colored lines are the average of the three experiments. Notice that the density centers in three independent experiments in phototaxis are always 0 and 100 mm in CC-124 and CC-4533, respectively. On the other hand, the density centers in three independent experiments in chemotaxis are first observed near the center of the Petri dish.
Figure 4
Figure 4
CC-124 (agg1-) but not CC-4533 (AGG1) exhibits clear collective migration during ammonium chemotaxis. Chlamydomonas with a low cell density (105 cells/ml) were exposed to chemical gradients from three separate directions by placing source agarose blocks in different locations within the Petri dish. The top row has a chemical gradient from 0 mM NH4Cl at the bottom of the Petri dish to 21 mM NH4Cl at the top of the Petri dish in the photos. The second row has a chemical gradient from 0 mM NH4Cl at the bottom of the Petri dish to 21 mM NH4Cl at the left of the Petri dish in the photos. The third row has a chemical gradient from 0 mM NH4Cl at the bottom of the Petri dish to 21 mM NH4Cl at the right of the Petri dish in the photos. Photos were taken at the 0, 3, 6, 12, and 24 h time points for either CC-124 (A) and CC-4533 (B). The red arrows in (A) indicate collected CC-124 cells, whereas the highlighted red areas in (B) indicate collected CC-4533 cells.
Figure 5
Figure 5
Expression of recombinant AGG1 protein in CC-124 suppresses collective migration during ammonium chemotaxis. (A) Expression of the recombinant AGG1 protein in the transgenic CC-124 was confirmed by western blotting. Protein extracts in the transgenic CC-124 lines #6 and #13 that express AGG1-3xHA were subjected to western blot analysis using an anti-HA antibody (αHA). The recombinant protein (estimated mass of 40.6 kDa) that appeared in the blot is indicated by an arrowhead. The original, unprocessed image of the blot was shown in Supplementary Fig. S11. (B) Transgenic CC-124 lines #6, and #13 were subjected to Wakabayashi’s phototaxis assay. As controls, CC-124 (negative phototaxis) and CC-125 (neutral phototaxis) strains were also subjected to the assay. A green arrow indicates the direction of the light. (CF) Photos show migration patterns of CC-125, CC-124, #6, and #13 over 24 h. In a Petri dish, agarose blocks containing 0 mM and 21 mM NH4Cl were placed on opposite sides (top and bottom, respectively, in the photos). Notice the reduction of collective migration in #6 and #13 compared to CC-124. Five-minute interval time-lapse movies are presented in Supplementary Movie S3.
Figure 6
Figure 6
A proposed mechanism that ammonium chemotaxis is driven by collective migration in Chlamydomonas. A scheme showing how ammonium chemotaxis is driven by collective migration regulated by light exposure and AGG1. Blue triangles represent an increasing ammonium chemical gradient from top to bottom. Orange arrows indicate the direction and driving force of positive chemotaxis. Cells on the left show single cell migration, while cells on the right show collective cell migration.

Similar articles

Cited by

References

    1. Khan S, Scholey JM. Assembly, functions and evolution of archaella, flagella and cilia. Curr. Biol. 2018;28:R278–R292. doi: 10.1016/j.cub.2018.01.085. - DOI - PubMed
    1. Bennett RR, Golestanian R. A steering mechanism for phototaxis in Chlamydomonas. J. R. Soc. Interface. 2015;12:20141164. doi: 10.1098/rsif.2014.1164. - DOI - PMC - PubMed
    1. Ueki, N. & Wakabayashi, K.-i. in Dyneins: Structure, Biology and Disease (Second Edition) (ed Stephen M. King) 368–385 (Academic Press, 2018).
    1. Ueki N, et al. Eyespot-dependent determination of the phototactic sign in Chlamydomonas reinhardtii. Proc. Natl. Acad. Sci. 2016;113:5299. doi: 10.1073/pnas.1525538113. - DOI - PMC - PubMed
    1. Pazour GJ, Sineshchekov OA, Witman GB. Mutational analysis of the phototransduction pathway of Chlamydomonas reinhardtii. J. Cell Biol. 1995;131:427–440. doi: 10.1083/jcb.131.2.427. - DOI - PMC - PubMed

Publication types

Substances