. 2023 Jul 4;13(1):10808.
doi: 10.1038/s41598-023-37762-1.

Specific and label-free endogenous signature of dystrophic muscle by Synchrotron deep ultraviolet radiation

Affiliations

Specific and label-free endogenous signature of dystrophic muscle by Synchrotron deep ultraviolet radiation

Laurence Dubreil et al. Sci Rep. .

Abstract

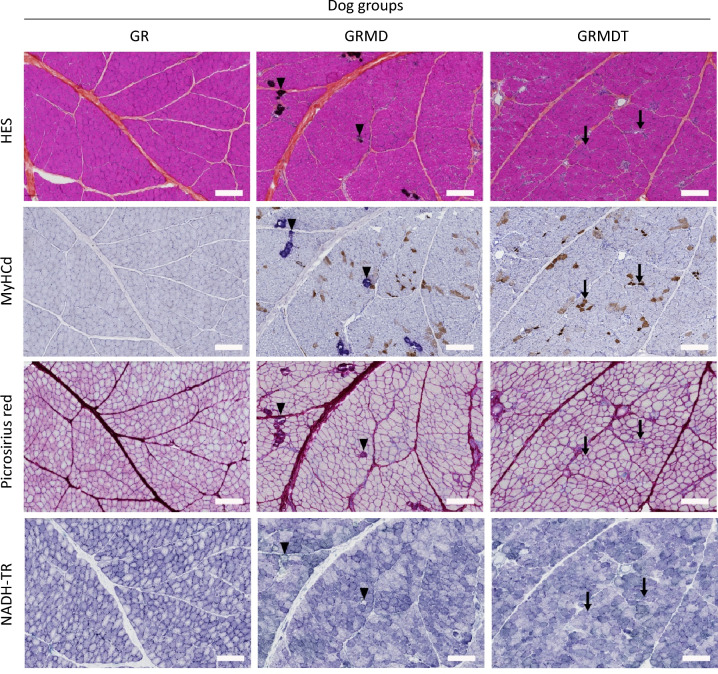
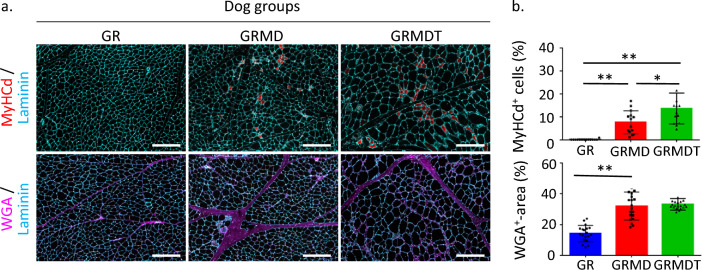
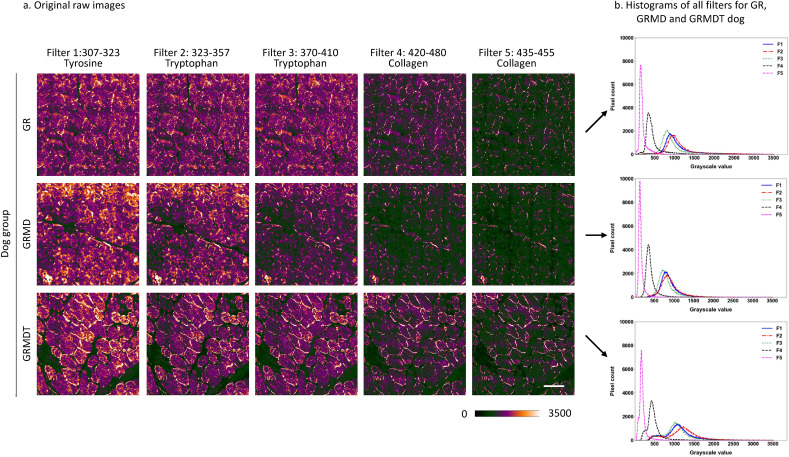
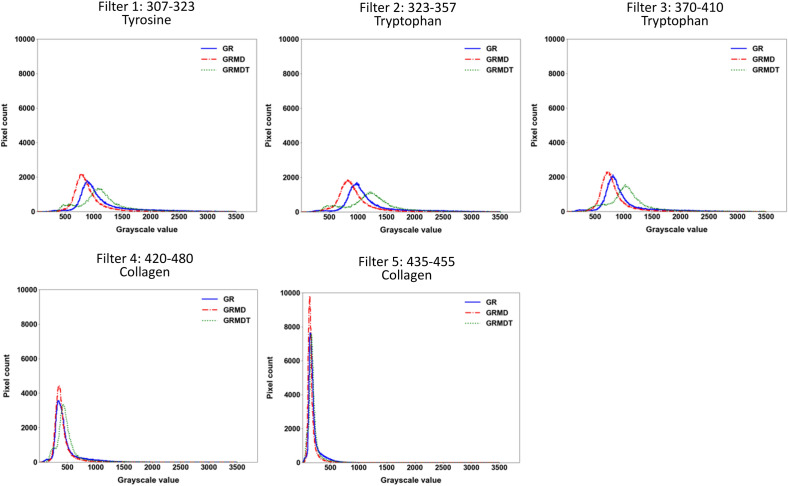
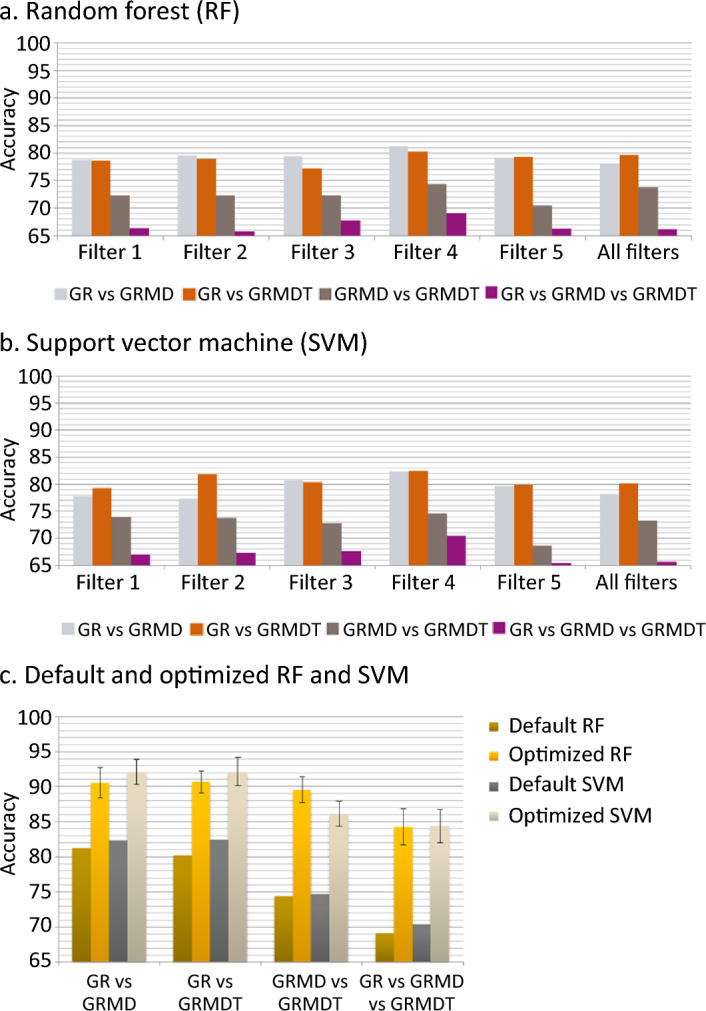
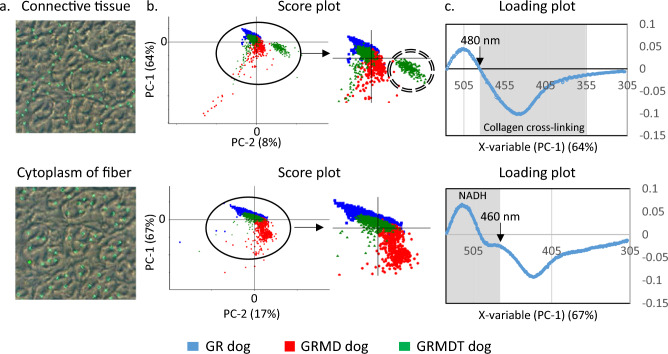
Dystrophic muscle is characterized by necrosis/regeneration cycles, inflammation, and fibro-adipogenic development. Conventional histological stainings provide essential topographical data of this remodeling but may be limited to discriminate closely related pathophysiological contexts. They fail to mention microarchitecture changes linked to the nature and spatial distribution of tissue compartment components. We investigated whether label-free tissue autofluorescence revealed by Synchrotron deep ultraviolet (DUV) radiation could serve as an additional tool for monitoring dystrophic muscle remodeling. Using widefield microscopy with specific emission fluorescence filters and microspectroscopy defined by high spectral resolution, we analyzed samples from healthy dogs and two groups of dystrophic dogs: naïve (severely affected) and MuStem cell-transplanted (clinically stabilized) animals. Multivariate statistical analysis and machine learning approaches demonstrated that autofluorescence emitted at 420-480 nm by the Biceps femoris muscle effectively discriminates between healthy, dystrophic, and transplanted dog samples. Microspectroscopy showed that dystrophic dog muscle displays higher and lower autofluorescence due to collagen cross-linking and NADH respectively than that of healthy and transplanted dogs, defining biomarkers to evaluate the impact of cell transplantation. Our findings demonstrate that DUV radiation is a sensitive, label-free method to assess the histopathological status of dystrophic muscle using small amounts of tissue, with potential applications in regenerative medicine.


Conflict of interest statement

The authors declare no competing interests.

Figures

Figure 1
Figure 1
Representative serial histologic sections from dog Biceps femoris muscle. Transverse sections from healthy (Golden Retriever; GR), dystrophic (Golden Retriever Muscular Dystrophy; GRMD) and MuStem cell-treated dystrophic GRMD (GRMDT) dogs were stained with hematoxylin–eosin-saffron (HES; first row, arrowheads indicate mineral deposits in GRMD dogs) and immunolabeled for the developmental isoform of myosin heavy chain (MyHCd; second row, arrows indicate groups of positive fibers in GRMDT dog muscle). Connective tissue was visualized by specific Picrosirius red staining (third row). Sections were histoenzymologically stained to visualize nicotinamide adenine dinucleotide dehydrogenase-tetrazolium reductase (NADH-TR; bottom row) activity in mitochondria. The same labels (arrow, arrowhead) have been used on the four histological preparations (upper and lower panels) to highlight the features of interest that are preserved after serial sectioning of the tissues. Scale bars: 100 µm.
Figure 2
Figure 2
Histomorphometric analysis of dog Biceps femoris muscle. (a) Regenerative activity was assessed by immunolabeling for the developmental isoform of the myosin heavy chain (MyHCd, top row; red) in muscle cryosections from healthy (Golden Retriever; GR), dystrophic (Golden Retriever Muscular Dystrophy; GRMD) and MuStem cell-treated dystrophic GRMD (GRMDT) dogs. Endomysial connective tissue was stained with wheat germ agglutinin (WGA, bottom row; magenta). Laminin immunolabeling was performed to delimit the outline of muscle fibers. (b) The number of MyHCd+ fibers and proportion of WGA+ stained tissue were determined in all 3 groups. Scale bar: 200 µm. Statistical significance was estimated using a one-way ANOVA followed by a Tukey’s multiple comparison test. ** p < 0.0001; * p = 0.0046.
Figure 3
Figure 3
Schematic outline of the experimental protocol and analytical techniques used for label-free imaging of muscle sections using Synchrotron deep ultraviolet radiation. (a) Widefield microscopy investigation (307–480 nm). After identifying the different muscle fiber classes (Labeled images), 5 filters were applied to obtain 5 distinct images of each sample, global statistical parameters were calculated using the raw pixel values of those images (Training attributes), and sets of images (Tested sets of attributes) were used to evaluate 8 machine learning models, tested with unlabeled images to select the most appropriate set of attributes and machine learning algorithms. (b) Images of filter 4, identified as the best source of attributes were used to extract global and local statistical parameters to test the two best machine learning algorithms, Random Forest (RF) and Support Vector Machine (SVM). (c) Microspectroscopy (300–540 nm). A sequential approach was used to measure around fibers (step 1) and inside fibers (step 2), and to produce the corresponding spectra (step 3), after which principal component analysis was performed (step 4).
Figure 4
Figure 4
Synchrotron deep ultraviolet radiation for widefield microscopy investigation. (a) Examples of original raw images acquired from healthy (Golden Retriever; GR), dystrophic (Golden Retriever Muscular Dystrophy; GRMD) and MuStem cell-treated dystrophic GRMD (GRMDT) dogs using 5 distinct emission filters and different wavelength intervals. (b) Corresponding aggregated histograms (represented as an envelope curve of the bins, instead of the conventional set of bins) for all filters and dog groups. Scale bar: 100 µm.
Figure 5
Figure 5
Complementary information representation of Synchrotron deep ultraviolet radiation according to filters. Aggregated histograms of the five filters (represented as an envelope curve of the bins, instead of the conventional set of bins), combining the groups of healthy (Golden Retriever; GR), dystrophic (Golden Retriever Muscular Dystrophy; GRMD) and MuStem cell-treated dystrophic GRMD (GRMDT) dogs for each filter.
Figure 6
Figure 6
Classification performance (accuracy) for Random Forest and Support Vector Machine. Input for Random Forest (RF; a) and Support Vector Machine (SVM; b) consisted of global statistical parameters extracted from images generated using each of the 5 filters for each of the 3 dog groups (healthy [Golden Retriever; GR], dystrophic [Golden Retriever Muscular Dystrophy; GRMD] and MuStem cell-treated dystrophic GRMD [GRMDT] dogs) and those extracted from all 5 filters combined. (c) Performance classification data obtained for the RF and SVM approaches using as inputs the combination of global and complementary local statistical parameters calculated only for images captured using filter 4 of the 3 dog classes. In both instances (default and optimized parameters), a k-fold cross validation was applied using k = 10. Bars representing standard deviation are shown only for the optimized RF and SVM conditions, as in all the other cases these values were very small (< 0.01%).
Figure 7
Figure 7
Investigation of connective tissue and muscle fiber cytoplasm with Synchrotron deep ultraviolet radiation microspectroscopy. (a) Deep ultraviolet (DUV) spectral data were obtained between 300 and 540 nm for connective tissue (top) and fiber cytoplasm (bottom) in skeletal muscle of 3 animals per dog group: healthy [Golden Retriever; GR], dystrophic [Golden Retriever Muscular Dystrophy; GRMD] and MuStem cell-treated dystrophic GRMD [GRMDT]. (b) Data were analyzed by Principal Component Analysis (PCA), pre-processed (unit vector normalization) and subjected to multivariate data analysis (The Unscrambler® X; CAMO Software Process AS). The results, obtained for healthy GR (blue), GRMD (red) and GRMDT (green) dogs, were represented by score plot in which each dot corresponds to a single spectrum. In connective tissue (top), 3 clusters were separated in the score plots: (i) along the PC-1 axis, separation of GRMD dogs (red; located on negative part of PC-1) from healthy GR dogs (blue) and part of GRMDT dogs (green), both being located on positive side of PC-1 axis; (ii) along PC-2 axis, GRMD dogs (red) and part of GRMDT dogs (green; surrounded) which formed a cluster at right of PC-2 axis. Healthy GR dogs (blue) and part of GRMDT dogs (green) were distributed from either side of PC-2 axis. In cytoplasm of muscle fiber (bottom), 2 clusters were separated: (i) along the PC-1 axis, separation of GRMD dogs (red; located on negative part of PC-1) from healthy GR dogs (blue) and one GRMDT dog (green), both merged and located on positive side of PC-1 axis; (ii) along PC-2 axis, GRMD dogs (red) formed a cluster at right of PC-2 axis whereas most of healthy GR dogs (blue) and GRMDT dogs (green) were distributed from either side of PC-2 axis. (c) Loading plots, where the contribution of each wavenumber in the clustering of the spectra was investigated, were also generated. The corresponding loading plots revealed the main characteristic emission bands of collagen cross-linking (top) and NADH (bottom).

Similar articles

References

    1. Emery AE. The muscular dystrophies. Lancet. 2002;359:687–695. doi: 10.1016/S0140-6736(02)07815-7. - DOI - PubMed
    1. Nadeau A, et al. Natural history of Ullrich congenital muscular dystrophy. Neurology. 2009;73:25–31. doi: 10.1212/WNL.0b013e3181aae851. - DOI - PubMed
    1. Moat SJ, et al. Newborn blood spot screening for sickle cell disease by using tandem mass spectrometry: Implementation of a protocol to identify only the disease states of sickle cell disease. Clin. Chem. 2014;60:373–380. doi: 10.1373/clinchem.2013.210948. - DOI - PubMed
    1. Hoffman EP, Brown RH, Kunkel LM. Dystrophin: The protein product of the Duchenne muscular dystrophy locus. Cell. 1987;51:919–928. doi: 10.1016/0092-8674(87)90579-4. - DOI - PubMed
    1. Matsumura K, Campbell KP. Deficiency of dystrophin-associated proteins: A common mechanism leading to muscle cell necrosis in severe childhood muscular dystrophies. Neuromuscul. Disord. 1993;3:109–118. doi: 10.1016/0960-8966(93)90002-2. - DOI - PubMed

Publication types