

Identification and verification of a novel anoikis-related gene signature with prognostic significance in clear cell renal cell carcinoma
- PMID: 37402968
- PMCID: PMC11796694
- DOI: 10.1007/s00432-023-05012-6
Identification and verification of a novel anoikis-related gene signature with prognostic significance in clear cell renal cell carcinoma
Abstract
Purpose: Clear cell renal cell carcinomas (ccRCCs) are the most common form of renal cancer in the world. The loss of extracellular matrix (ECM) stimulates cell apoptosis, known as anoikis. A resistance to anoikis in cancer cells is believed to contribute to tumor malignancy, particularly metastasis; however, the potential influence of anoikis on the prognosis of ccRCC patients is not fully understood.
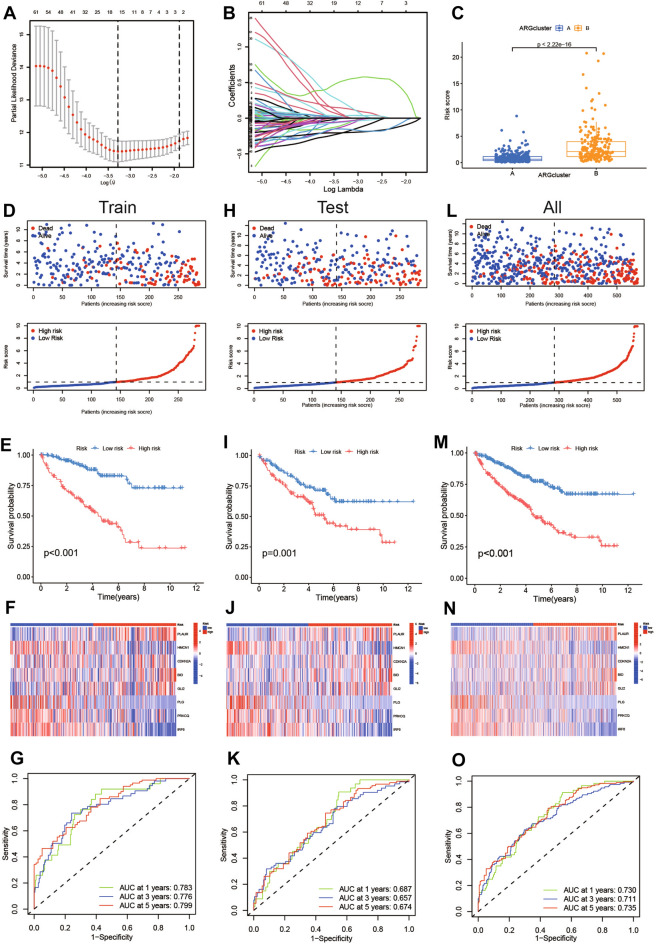
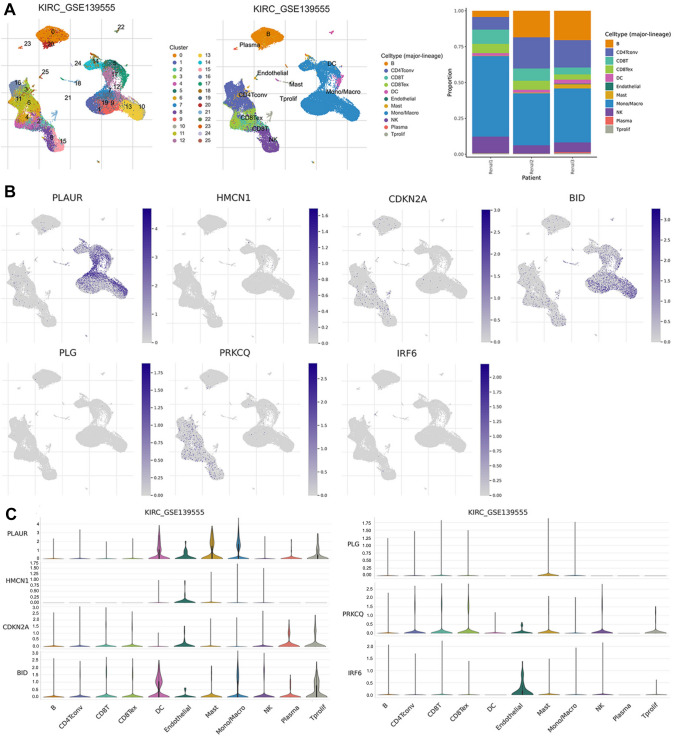
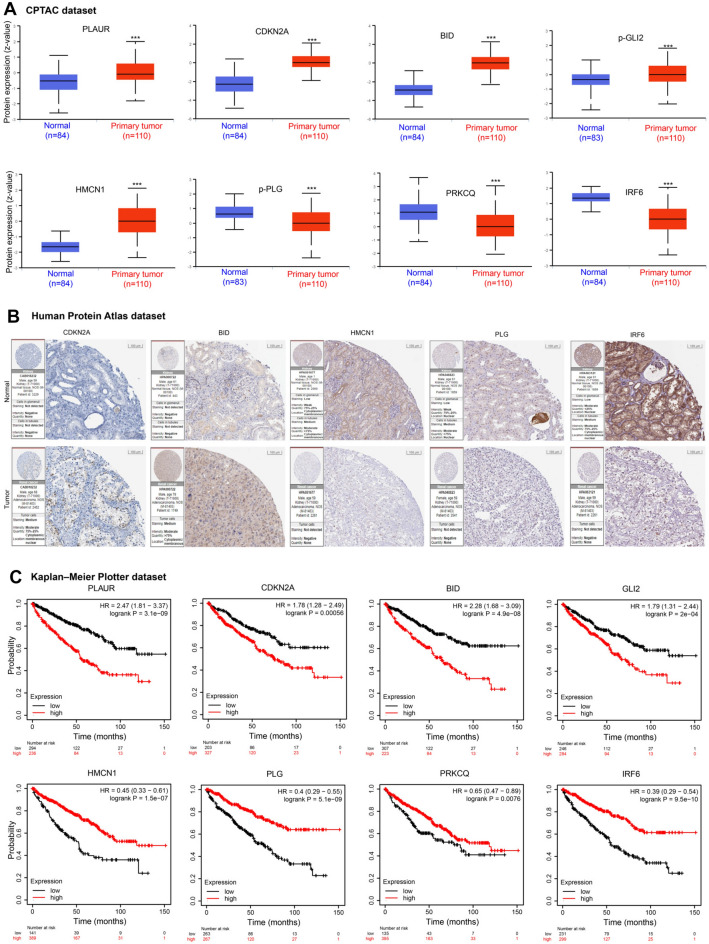
Methods: In this study, anoikis-related genes (ARGs) with discrepant expression were selected from the Cancer Genome Atlas (TCGA) and Gene Expression Omnibus (GEO) databases. The anoikis-related gene signature (ARS) was built using a combination of the univariate Cox and least absolute shrinkage and selection operator (LASSO) analyses. ARS was also evaluated for their prognostic value. We explored the tumor microenvironment and enrichment pathways between different clusters of ccRCC. We also examined differences in clinical characteristics, immune cell infiltration and drug sensitivity between the high- and low-risk sets. In addition, we utilized three external databases and quantitative real-time polymerase chain reaction (qRT-PCR) to validate the expression and prognosis of ARGs.
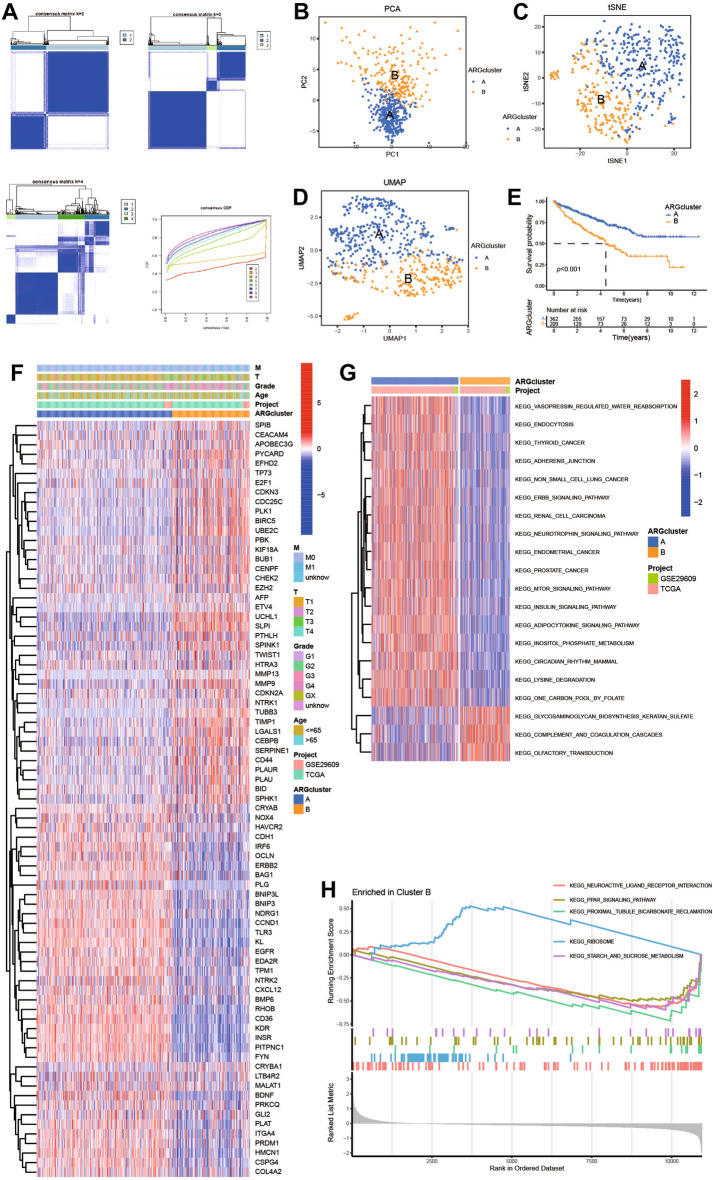
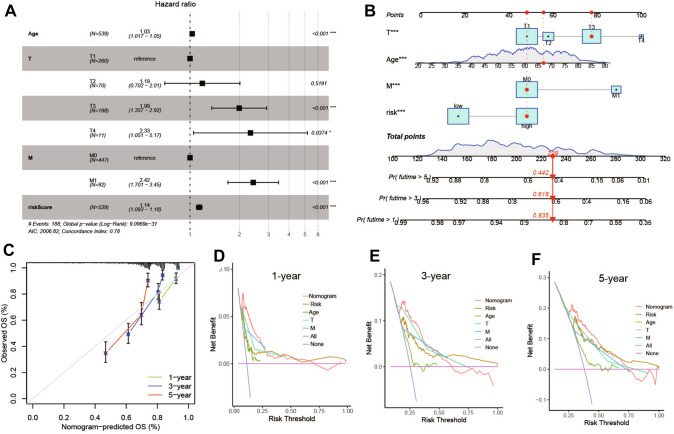
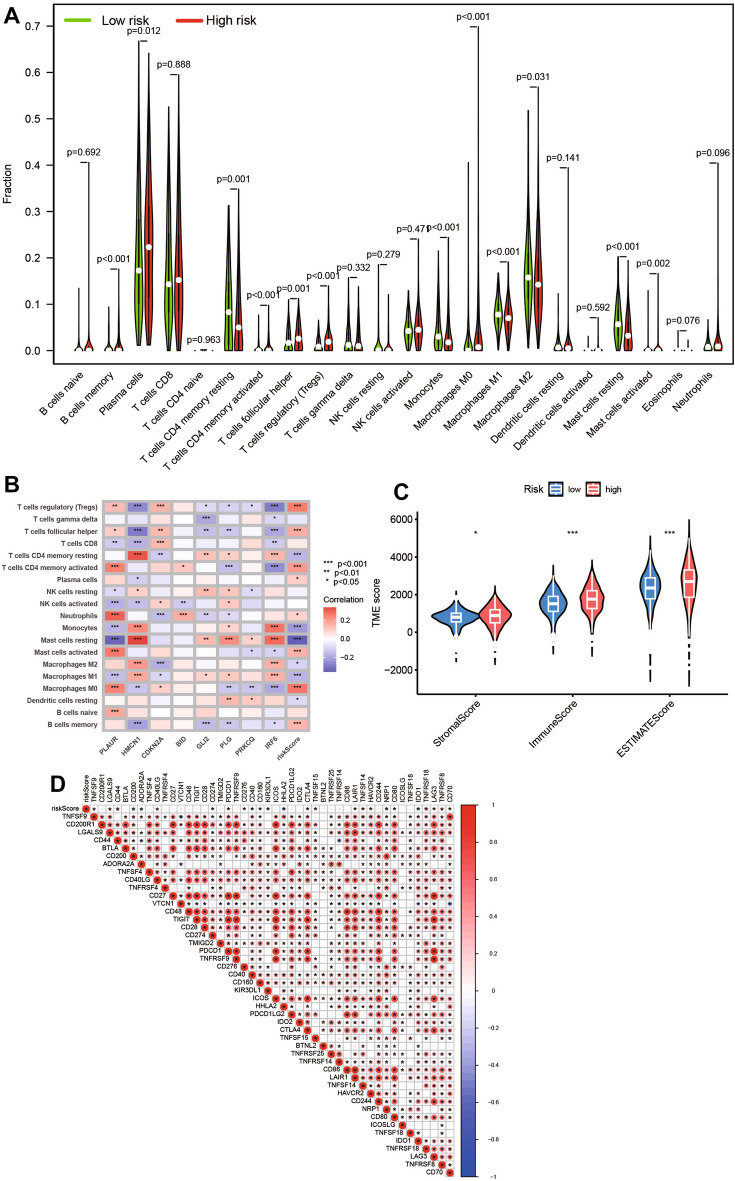
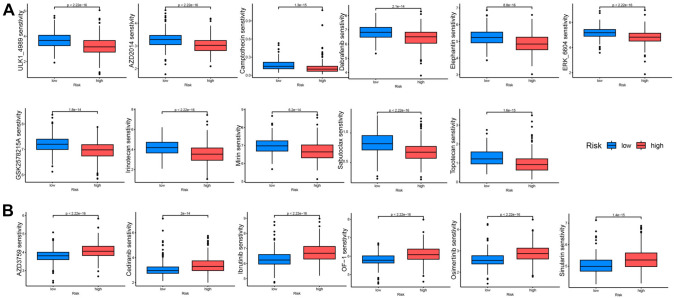
Results: Eight ARGs (PLAUR, HMCN1, CDKN2A, BID, GLI2, PLG, PRKCQ and IRF6) were identified as anoikis-related prognostic factors. According to Kaplan-Meier (KM) analysis, ccRCC patients with high-risk ARGs have a worse prognosis. The risk score was found to be a significant independent prognostic indicator. According to tumor microenvironment (TME) scores, stromal score, immune score, and estimated score of the high-risk group were superior to those of the low-risk group. There were significant differences between the two groups regarding the amount of infiltrated immune cells, immune checkpoint expression as well as drug sensitivity. A nomogram was constructed using ccRCC clinical features and risk scores. The signature and the nomogram both performed well in predicting overall survival (OS) for ccRCC patients. According to a decision curve analysis (DCA), clinical treatment options for patients with ccRCC could be improved using this model.
Conclusion: The results of validation from external databases and qRT-PCR were basically agreement with findings in TCGA and GEO databases. The ARS serving as biomarkers may provide an important reference for individual therapy of ccRCC patients.
Keywords: Anoikis-related gene; Clear cell renal cell carcinoma; Drug sensitivity; Prognostic markers; Tumor microenvironment.
© 2023. The Author(s), under exclusive licence to Springer-Verlag GmbH Germany, part of Springer Nature.
Conflict of interest statement
The authors declare no competing interests.
Figures


Similar articles
-
Characterization of novel anoikis-related genes as prognostic biomarkers and key determinants of the immune microenvironment in esophageal cancer.Front Immunol. 2025 Jul 11;16:1599171. doi: 10.3389/fimmu.2025.1599171. eCollection 2025. Front Immunol. 2025. PMID: 40746552 Free PMC article.
-
Development and Validation of Anoiki-Related Lncrna Signature Prediction Model for KIRC Prognosis.Comb Chem High Throughput Screen. 2025;28(9):1524-1542. doi: 10.2174/0113862073271880231114100544. Comb Chem High Throughput Screen. 2025. PMID: 38305400
-
A prognostic microRNA-based signature for localized clear cell renal cell carcinoma: the Bio-miR study.Br J Cancer. 2025 Aug;133(2):155-167. doi: 10.1038/s41416-025-03008-2. Epub 2025 May 7. Br J Cancer. 2025. PMID: 40335662
-
Cost-effectiveness of using prognostic information to select women with breast cancer for adjuvant systemic therapy.Health Technol Assess. 2006 Sep;10(34):iii-iv, ix-xi, 1-204. doi: 10.3310/hta10340. Health Technol Assess. 2006. PMID: 16959170
-
Systemic pharmacological treatments for chronic plaque psoriasis: a network meta-analysis.Cochrane Database Syst Rev. 2017 Dec 22;12(12):CD011535. doi: 10.1002/14651858.CD011535.pub2. Cochrane Database Syst Rev. 2017. Update in: Cochrane Database Syst Rev. 2020 Jan 9;1:CD011535. doi: 10.1002/14651858.CD011535.pub3. PMID: 29271481 Free PMC article. Updated.
Cited by
-
Integrative analysis of multi-omics data identified PLG as key gene related to Anoikis resistance and immune phenotypes in hepatocellular carcinoma.J Transl Med. 2024 Dec 4;22(1):1104. doi: 10.1186/s12967-024-05858-5. J Transl Med. 2024. PMID: 39633373 Free PMC article.
-
Integrated Multi-Omics Analysis Unveils Distinct Molecular Subtypes and a Robust Immune-Metabolic Prognostic Model in Clear Cell Renal Cell Carcinoma.Int J Mol Sci. 2025 Mar 28;26(7):3125. doi: 10.3390/ijms26073125. Int J Mol Sci. 2025. PMID: 40243888 Free PMC article.
-
Identification and validation of an anoikis-related genes signature for prognostic implication in papillary thyroid cancer.Aging (Albany NY). 2024 Apr 24;16(8):7405-7425. doi: 10.18632/aging.205766. Epub 2024 Apr 24. Aging (Albany NY). 2024. PMID: 38663918 Free PMC article.
-
Construction and evaluation of a prognostic model for metabolism-related genes in kidney renal clear cell carcinoma using TCGA database.Am J Clin Exp Urol. 2024 Dec 15;12(6):352-366. doi: 10.62347/XVZJ5704. eCollection 2024. Am J Clin Exp Urol. 2024. PMID: 39839750 Free PMC article.
References
-
- Barshir R, Fishilevich S, Iny-Stein T et al (2021) Genecarna: a comprehensive gene-centric database of human non-coding rnas in the genecards suite. J Mol Biol 433(11):166913 - PubMed
MeSH terms
Substances
Grants and funding
LinkOut - more resources
Full Text Sources
Medical
Miscellaneous
