

The prognostic value and immune landscaps of m6A/m5C-related lncRNAs signature in the low grade glioma
- PMID: 37403043
- PMCID: PMC10320943
- DOI: 10.1186/s12859-023-05386-x
The prognostic value and immune landscaps of m6A/m5C-related lncRNAs signature in the low grade glioma
Abstract
Background: N6-methyladenosine (m6A) and 5-methylcytosine (m5C) are the main RNA methylation modifications involved in the oncogenesis of cancer. However, it remains obscure whether m6A/m5C-related long non-coding RNAs (lncRNAs) affect the development and progression of low grade gliomas (LGG).
Methods: We summarized 926 LGG tumor samples with RNA-seq data and clinical information from The Cancer Genome Atlas and Chinese Glioma Genome Atlas. 105 normal brain samples with RNA-seq data from the Genotype Tissue Expression project were collected for control. We obtained a molecular classification cluster from the expression pattern of sreened lncRNAs. The least absolute shrinkage and selection operator Cox regression was employed to construct a m6A/m5C-related lncRNAs prognostic signature of LGG. In vitro experiments were employed to validate the biological functions of lncRNAs in our risk model.
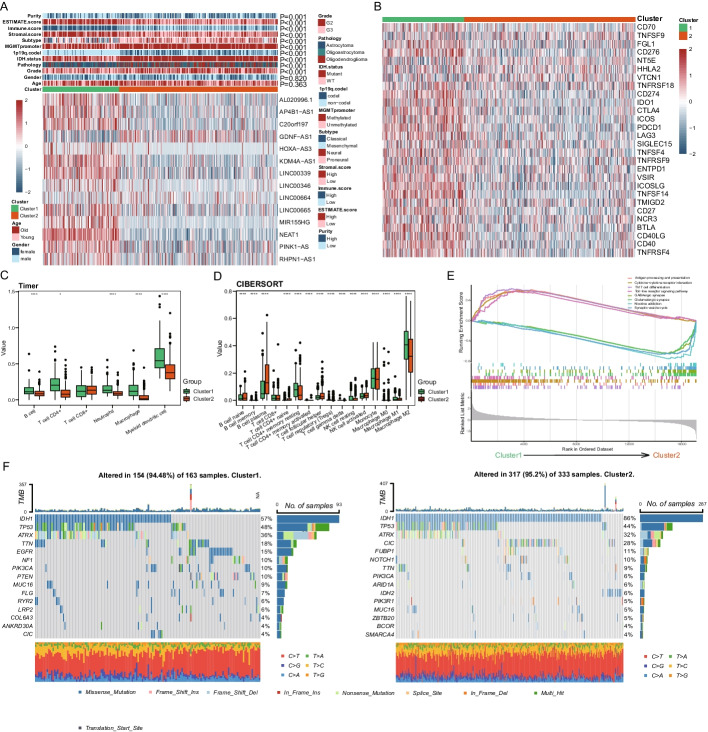
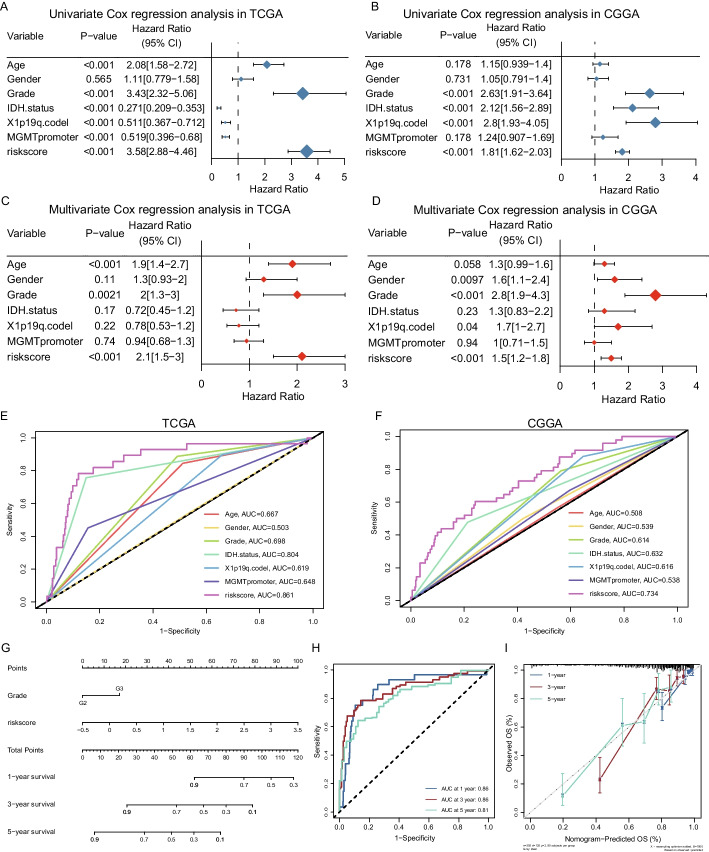
Results: The expression pattern of 14 sreened highly correlated lncRNAs could cluster samples into two groups, in which various clinicopathological features and the tumor immune microenvironment were significantly distinct. The survival time of cluster 1 was significantly reduced compared with cluster 2. This prognostic signature is based on 8 m6A/m5C-related lncRNAs (GDNF-AS1, HOXA-AS3, LINC00346, LINC00664, LINC00665, MIR155HG, NEAT1, RHPN1-AS1). Patients in the high-risk group harbored shorter survival times. Immunity microenvironment analysis showed B cells, CD4 + T cells, macrophages, and myeloid-derived DC cells were significantly increased in the high-risk group. Patients in high-risk group had the worse overall survival time regardless of followed TMZ therapy or radiotherapy. All observed results from the TCGA-LGG cohort could be validated in CGGA cohort. Afterwards, LINC00664 was found to promote cell viability, invasion and migration ability of glioma cells in vitro.
Conclusion: Our study elucidated a prognostic prediction model of LGG by 8 m6A/m5C methylated lncRNAs and a critical lncRNA regulation function involved in LGG progression. High-risk patients have shorter survival times and a pro-tumor immune microenvironment.
Keywords: Immune landscape; Long non-coding RNA; Low grade glioma; Prognostic signature; RNA methylation.
© 2023. The Author(s).
Conflict of interest statement
The authors declare no competing interests.
Figures


Similar articles
-
5-Methylcytosine Related LncRNAs Reveal Immune Characteristics, Predict Prognosis and Oncology Treatment Outcome in Lower-Grade Gliomas.Front Immunol. 2022 Mar 3;13:844778. doi: 10.3389/fimmu.2022.844778. eCollection 2022. Front Immunol. 2022. PMID: 35309316 Free PMC article.
-
An m6A/m5C/m1A/m7G-Related Long Non-coding RNA Signature to Predict Prognosis and Immune Features of Glioma.Front Genet. 2022 May 26;13:903117. doi: 10.3389/fgene.2022.903117. eCollection 2022. Front Genet. 2022. PMID: 35692827 Free PMC article.
-
m6A- and m5C- modified lncRNAs orchestrate the prognosis in cutaneous melanoma and m6A- modified LINC00893 regulates cutaneous melanoma cell metastasis.Skin Res Technol. 2024 Jul;30(7):e13842. doi: 10.1111/srt.13842. Skin Res Technol. 2024. PMID: 38965799 Free PMC article.
-
The lncRNA epigenetics: The significance of m6A and m5C lncRNA modifications in cancer.Front Oncol. 2023 Mar 9;13:1063636. doi: 10.3389/fonc.2023.1063636. eCollection 2023. Front Oncol. 2023. PMID: 36969033 Free PMC article. Review.
-
Insights into the regulatory role of RNA methylation modifications in glioma.J Transl Med. 2023 Nov 14;21(1):810. doi: 10.1186/s12967-023-04653-y. J Transl Med. 2023. PMID: 37964279 Free PMC article. Review.
Cited by
-
The role of m5C RNA modification in cancer development and therapy.Heliyon. 2024 Sep 27;10(19):e38660. doi: 10.1016/j.heliyon.2024.e38660. eCollection 2024 Oct 15. Heliyon. 2024. PMID: 39444404 Free PMC article. Review.
-
Systematic transcriptomic analysis of childhood medulloblastoma identifies N6- methyladenosine-dependent lncRNA signatures associated with molecular subtype, immune cell infiltration, and prognosis.Res Sq [Preprint]. 2024 Sep 2:rs.3.rs-4810070. doi: 10.21203/rs.3.rs-4810070/v1. Res Sq. 2024. Update in: Acta Neuropathol Commun. 2024 Aug 28;12(1):138. doi: 10.1186/s40478-024-01848-2. PMID: 39281885 Free PMC article. Updated. Preprint.
-
Examining the evidence for mutual modulation between m6A modification and circular RNAs: current knowledge and future prospects.J Exp Clin Cancer Res. 2024 Aug 3;43(1):216. doi: 10.1186/s13046-024-03136-2. J Exp Clin Cancer Res. 2024. PMID: 39095902 Free PMC article. Review.
-
Unraveling the Clinical Landscape of RNA Modification Regulators with Multi-Omics Insights in Pan-Cancer.Cancers (Basel). 2025 Aug 19;17(16):2695. doi: 10.3390/cancers17162695. Cancers (Basel). 2025. PMID: 40867324 Free PMC article.
-
Exploring the prognostic potential of m6A methylation regulators in low-grade glioma: implications for tumor microenvironment modulation.Eur J Med Res. 2024 Jan 3;29(1):19. doi: 10.1186/s40001-023-01621-6. Eur J Med Res. 2024. PMID: 38173044 Free PMC article.
References
-
- Wen PY, Weller M, Lee EQ, Alexander BM, Barnholtz-Sloan JS, Barthel FP, Batchelor TT, Bindra RS, Chang SM, Chiocca EA, et al. Glioblastoma in adults: a Society for Neuro-Oncology (SNO) and European Society of Neuro-Oncology (EANO) consensus review on current management and future directions. Neuro Oncol. 2020;22(8):1073–1113. doi: 10.1093/neuonc/noaa106. - DOI - PMC - PubMed
MeSH terms
Substances
Grants and funding
LinkOut - more resources
Full Text Sources
Research Materials
