. 2023 Jul 4;18(1):44.
doi: 10.1186/s13024-023-00628-1.

Overexpression of human alpha-Synuclein leads to dysregulated microbiome/metabolites with ageing in a rat model of Parkinson disease

Affiliations

Overexpression of human alpha-Synuclein leads to dysregulated microbiome/metabolites with ageing in a rat model of Parkinson disease

Yogesh Singh et al. Mol Neurodegener. .

Abstract

Background: Braak's hypothesis states that sporadic Parkinson's disease (PD) follows a specific progression of pathology from the peripheral to the central nervous system, and this progression can be monitored by detecting the accumulation of alpha-Synuclein (α-Syn) protein. Consequently, there is growing interest in understanding how the gut (commensal) microbiome can regulate α-Syn accumulation, as this could potentially lead to PD.

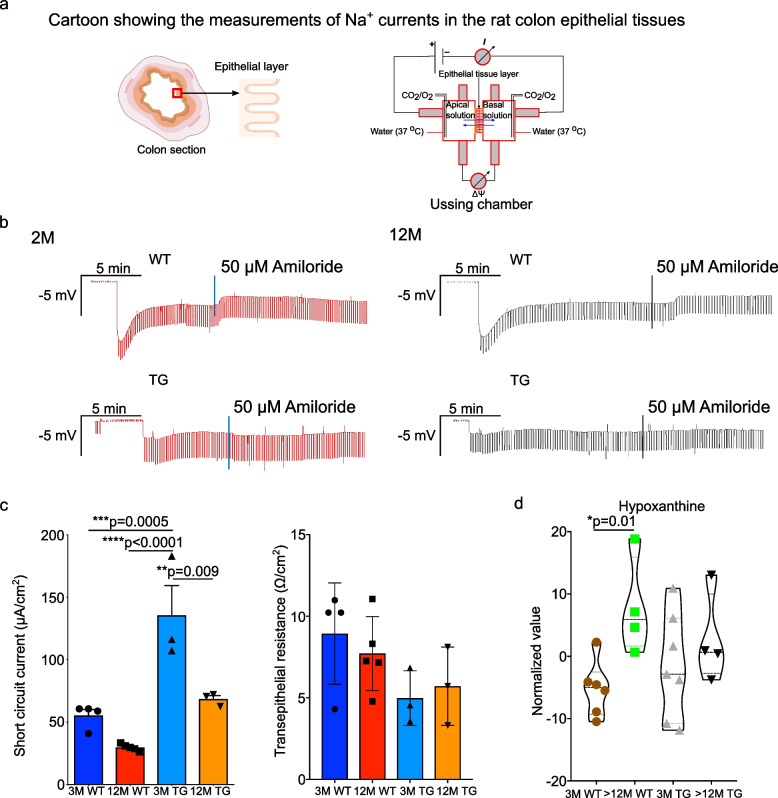
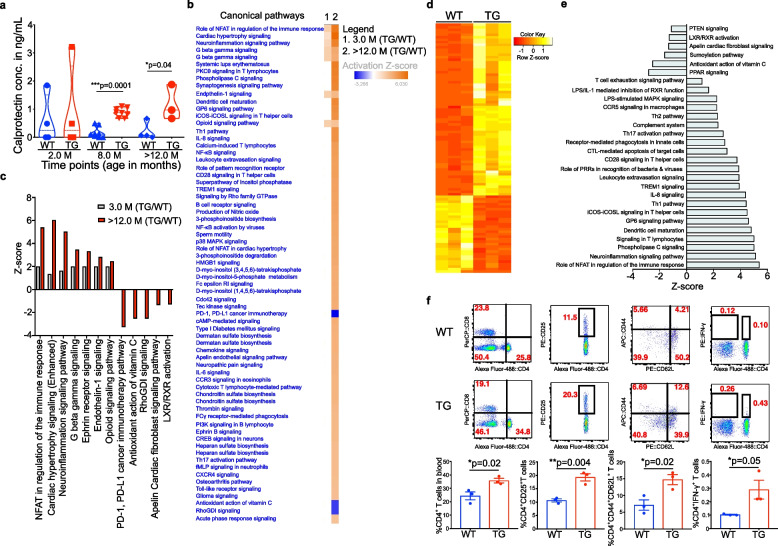
Methods: We used 16S rRNA and shotgun sequencing to characterise microbial diversity. 1H-NMR was employed to understand the metabolite production and intestinal inflammation estimated using ELISA and RNA-sequencing from feces and the intestinal epithelial layer respectively. The Na+ channel current and gut permeability were measured using an Ussing chamber. Immunohistochemistry and immunofluorescence imaging were applied to detect the α-Syn protein. LC-MS/MS was used for characterization of proteins from metabolite treated neuronal cells. Finally, Metascape and Ingenuity Pathway Analysis (IPA) bioinformatics tools were used for identification of dysregulated pathways.

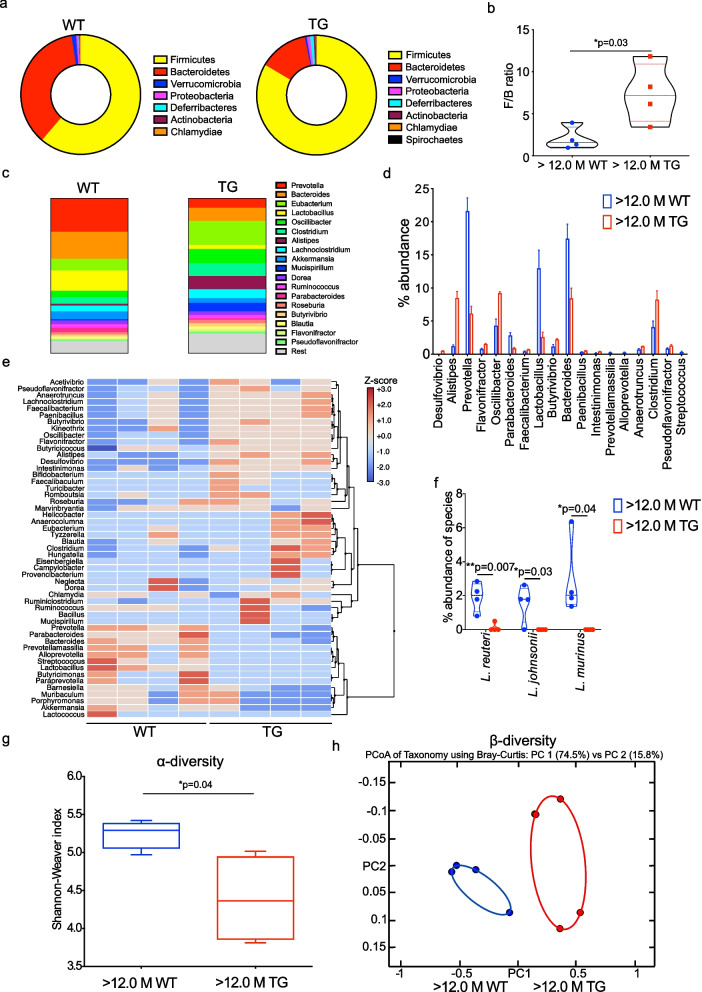
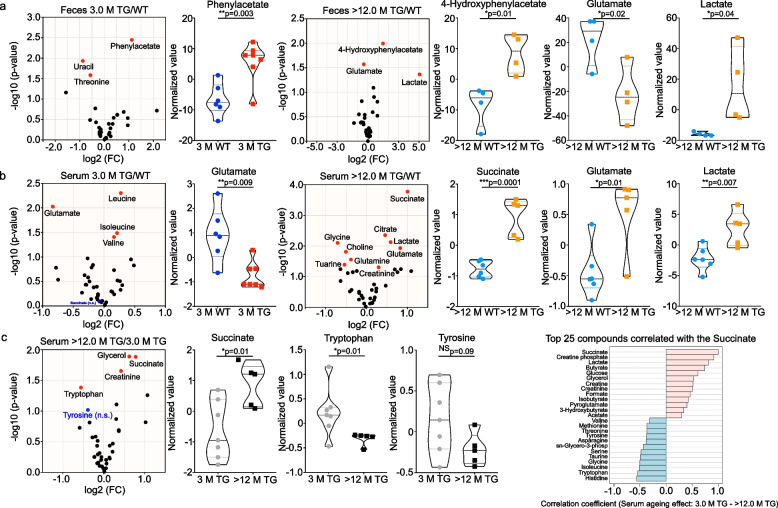
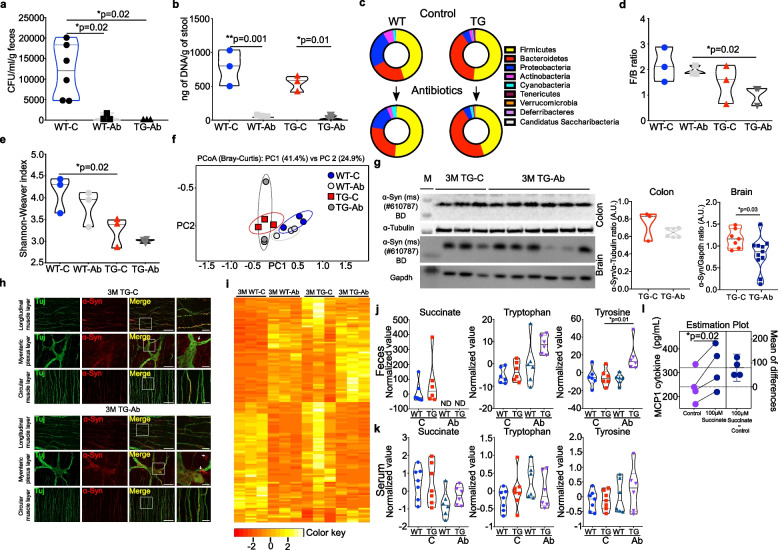
Results: We studied a transgenic (TG) rat model overexpressing the human SNCA gene and found that a progressive gut microbial composition alteration characterized by the reduction of Firmicutes to Bacteroidetes ratio could be detected in the young TG rats. Interestingly, this ratio then increased with ageing. The dynamics of Lactobacillus and Alistipes were monitored and reduced Lactobacillus and increased Alistipes abundance was discerned in ageing TG rats. Additionally, the SNCA gene overexpression resulted in gut α-Syn protein expression and increased with advanced age. Further, older TG animals had increased intestinal inflammation, decreased Na+ current and a robust alteration in metabolite production characterized by the increase of succinate levels in feces and serum. Manipulation of the gut bacteria by short-term antibiotic cocktail treatment revealed a complete loss of short-chain fatty acids and a reduction in succinate levels. Although antibiotic cocktail treatment did not change α-Syn expression in the enteric nervous system of the colon, however, reduced α-Syn expression was detected in the olfactory bulbs (forebrain) of the TG rats.

Conclusion: Our data emphasize that the gut microbiome dysbiosis synchronous with ageing leads to a specific alteration of gut metabolites and can be modulated by antibiotics which may affect PD pathology.

Keywords: Antibiotics; Gut microbiome; Intestinal inflammation; PD; α-Synuclein.


Conflict of interest statement

All the authors declared that they have no competing interest.

Figures

Fig. 1
Fig. 1
Gut microbiome dynamics with ageing, decreased Lactobacillus and increased Alistipes bacterial genera in the BAC-hSNCA (α-Syn) TG rats. a To understand the microbiome dynamics with ageing, heterozygous females and heterozygous males were used for breeding to keep the same gut microbiome from the mother to avoid maternal effect. When females were pregnant, the male was removed from the cage and pups were allowed to stay with the mothers for 3 weeks or until weaning. Three weeks old pups were genotyped and then separated into either WT or homozygous TG groups then fecal sample collections were started at the age of 1 M (4–5 weeks age 1 M; N = 7 WT (female) and N = 7 TG (female)) onwards [2 M; N = 8 WT (4 male and 4 female) and N = 7 TG (4 male and 4 female), 2.5 M; N = 10 WT (6 male and 4 female) and N = 10 TG (6 male and 4 female), 3 M; N = 5 WT (female) and N = 5 TG (female), 6 M; N = 10 WT (6 male and 4 female) and N = 10 TG (6 male and 4 female), > 12 M (12–14 M); N = 4 WT (male) and N = 4 TG (male)] for the microbiome analysis by either 16 s rRNA gene amplicon or shotgun sequencing methods. The animals were kept in 3–4 different cages to avoid the ‘cage affect’ bias in data analysis. Both male and females were used for the fecal sample collection depending on the breeding. b Representation of bacterial diversity (hollow pie chart) at phylum levels in WT and TG rats. c F/B ratio was calculated for WT and TG rat samples and significant difference was observed at 2.5 M and > 12 M age. F/B ratio was lower in TG rats at 2.5 M of age however, this ratio was reversed at > 12 M of age which was significantly higher in TG rats. Student’s t-test was performed for comparisons at a given age for WT and TG. Two-way ANOVA was performed to find the significance between different time points and genotypes. d The microbiome dynamics at genera level was estimated. Each bar chart represents the % relative abundance of bacterial genera of the total bacteria in each group at particular age. Significant change in bacterial phyla is shown in asterisk for particular phyla together with p value significance. e, f The dynamic representation of Lactobacillus and Alistipes with ageing in WT and TG respectively. A significant difference was observed with ageing in Lactobacillus and Alistipes. Two-way ANOVA was performed to find the significance between different time points and genotypes. The plots show the means ± SEM at each time point (age in months) with respective numbers shown in (a). P value significance represents *p ≤ 0.05, **p ≤ 0.01 and ***p ≤ 0.001
Fig. 2
Fig. 2
Gut dysbiosis in ageing TG rats. a To find out the bacterial dysbiotic bacterial strains, we have performed shotgun DNA sequencing and calculated the abundance of bacterial phyla (hollow pie charts) at > 12 M; N = 4 WT (male) and N = 4 TG (male). b F/B ratio was significantly higher in TG compared with WT. c, d Several bacterial genera were significantly upregulated (Desulfovibrio, Alistipes, Flavonifractor, Oscillibacter, Paenibacillus, Clostridium and Butyrivibrio) and significantly downregulated (Streptococcus, Bacteroidetes, Lactobacillus, Parabacteroidetes, and Prevotella) at > 12 M age in TG rats. e Clustering of gut bacteria into three major clusters from WT and TG rats. f Abundance of Lactobacillus species in WT and TG rats. g α-diversity at genera level calculated using Shannon–Weaver index and found to have significantly lower diversity in TG rats compared with WT. h β-diversity estimated for both the genotypes of rats with Principal coordinate analysis (PCoA) using Bray–Curtis method and both WT and TG rats cluster differently (PC1 54.5% and PC2 15.8). P value significance represents *p ≤ 0.05
Fig. 3
Fig. 3
Ageing affects the succinate, tryptophan and tyrosine metabolites in the feces and serum. Metabolites combined fold change (FC > 1.2 (log2 FC)) and p-value < 0.05 (-log10 (p value)) volcano plot analysis identified effect of ageing between WT and TG rat feces and serum. a At 3 M age feces genotype comparison TG/WT phenylacetate is significantly upregulated whereas at > 12 M age 4-Hydroxyphenylacetate and lactate were up while glutamate were down. b In serum samples glutamate is significantly decreased at 3 M whereas at > 12 M succinate, glutamate and lactate are increased. c When only observing the ageing effect on TG serum metabolites, succinate is significantly upregulated, and succinate correlation coefficient analysis suggested that tryptophan and tyrosine were negatively correlated with succinate while other short chain fatty acids were positively correlated. Statistically significant levels showed in the respective volcano and violin plots. P value significance represents *p ≤ 0.05, **p ≤ 0.01 and ***p ≤ 0.001
Fig. 4
Fig. 4
Accumulation of α-Syn in the colon of TG rats. a IHC was performed to identify the accumulation of total human α-Syn in 2, 2.5, 3 and >12 M old WT and TG rats using human primary α-Syn antibody (LB509; #ab27766). With ageing accumulation of α-Syn was observed in TG rats whereas no positive staining was observed in WT rats as expected. b Further, pathological state of human α-Syn was examined in 2, 2.5, 3 and > 12 M in TG rats using human primary pS129 α-Syn antibody (EP1356Y; #ab51253). It appeared that pathological α-Syn was increased with ageing in TG rats. Further, pS129 α-Syn antibody was blocked using specific peptide for pS129 site for the antibody and no staining was observed suggesting the specificity of pS129 antibody. c One of the representative immunoblot images of α-Syn and Gapdh staining is shown. We quantified the α-Syn amount using total α-Syn antibody (#BD 610787) and found that with ageing (2 M) to 4 M α-Syn expression in the colon tissues is significantly increased. Further ageing (4 M to > 12 M) tended to affect the accumulation of α-Syn but not statistically significant difference was observed. P value significance represents *p ≤ 0.05
Fig. 5
Fig. 5
Increased transepithelial current in TG rats. a A schematic diagram showing the ‘Ussing chamber’ technique to measure the function of intestinal permeability and Na + uptake to gut epithelial cells (ENaC channel). b Original tracing illustrating the effect of currents (1 µA) and of amiloride (50 µM) on transepithelial potential across colonic epithelium from WT (upper) and TG (lower) from 2 and 12 M rats (N = 3–5 female/genotype). c Arithmetic mean ± SEM (N = 3–5/group) of amiloride-sensitive current across colonic epithelium (Na+ absorption) from TG and WT rats and resistance of colonic epithelium (permeability). d Fecal hypoxanthine levels measured by 1H-NMR from 3 M and > 12 M WT and TG rats. P value significance represents *p ≤ 0.05, **p ≤ 0.01, ***p ≤ 0.001 and ***p ≤ 0.001
Fig. 6
Fig. 6
Increased inflammatory signals in the colon MS tissue layer of > 12 M TG rats. a Fecal/serum calprotectin levels measured by ELISA in 2, 8 (fecal) and > 12 M (serum; s) WT and TG rats. b WT and TG (3 M and > 12 M old) rat colon MS tissue layer or gut epithelium subjected to RNA-seq. b, c IPA from TG and WT rats showed upregulation of several biological pathways in > 12 M TG rats. d The heatmap shows upregulation (yellow) and downregulation (red) genes in the gut MS tissue layer. TG rats have higher expression of various genes involved in inflammation compared with WT. e IPA analysis in > 12 M TG rats suggested that several inflammatory pathways were changed. (f) FACS plots show increase in numbers of CD4+ T cells, CD4+CD25+ T cells (activated), CD+CD44+ T cells (memory) and CD4+ IFN-γ+ T cells were significantly higher in the blood of > 12 M TG rats compared with WT. Bar plots show the means ± SEM. P value significance represents *p ≤ 0.05
Fig. 7
Fig. 7
Treatment with broad-spectrum antibiotic cocktail leads to reduced gut microbiome load, α-Syn expression and succinate levels. a CFU measurement after broad-spectrum antibiotics treatment in WT and TG rats after equal amount of feces. b Amount of total DNA after antibiotic cocktail treatment in WT and TG rat fecal samples. c Antibiotic affected the bacterial phyla differentially for WT and TG rats. d F/B ratio was decreased after antibiotic treatment in WT and TG rats respectively, however, no significance difference was observed. e α-diversity measurement at genera level after antibiotics treatment for WT and TG rats. f β-diversity measurement (genera level) using Bray–Curtis method. Antibiotic treatments affect the clustering of intestinal bacteria. g Immunoblot image of α-Syn expression in ENS and olfactory bulb brain region from control and antibiotic treated TG rats and quantification of immunoblots are shown in violin plots. h Whole mount staining of MS tissue layer (longitudinal, circular and myenteric muscle layer) and expression of neuronal (Tuj) and α-Syn expression. i Heat-map presenting the RNA-seq data from control and antibiotics treated 3 M rats. j, k Succinate, tryptophan and tyrosine levels in the feces and serum from control and antibiotic treated WT and TG (3 M) rats. l Treatment of SH-SY5Y cells with succinate treatment (100 µM) significantly increased the MCP1 levels. P value significance represents *p ≤ 0.05

References

    1. Keshavarzian A, Green SJ, Engen PA, Voigt RM, Naqib A, Forsyth CB, Mutlu E, Shannon KM. Colonic bacterial composition in Parkinson's disease. Mov Disord. 2015;30(10):1351–1360. doi: 10.1002/mds.26307. - DOI - PubMed
    1. Antunes L, Frasquilho S, Ostaszewski M, Weber J, Longhino L, Antony P, Baumuratov A, Buttini M, Shannon KM, Balling R, et al. Similar alpha-Synuclein staining in the colon mucosa in patients with Parkinson's disease and controls. Mov Disord. 2016;31(10):1567–1570. doi: 10.1002/mds.26702. - DOI - PubMed
    1. Zhong CB, Chen QQ, Haikal C, Li W, Svanbergsson A, Diepenbroek M, Li JY. Age-dependent alpha-synuclein accumulation and phosphorylation in the enteric nervous system in a transgenic mouse model of Parkinson's Disease. Neurosci Bull. 2017;33(5):483–492. doi: 10.1007/s12264-017-0179-1. - DOI - PMC - PubMed
    1. Kalia LV, Lang AE. Parkinson’s disease. Lancet. 2015;386(9996):896–912. doi: 10.1016/S0140-6736(14)61393-3. - DOI - PubMed
    1. Liddle RA. Parkinson's disease from the gut. Brain Res. 2018;1693(Pt B):201–206. doi: 10.1016/j.brainres.2018.01.010. - DOI - PMC - PubMed

Publication types