

Phylogenomic insights into evolutionary trajectories of multidrug resistant S. pneumoniae CC271 over a period of 14 years in China
- PMID: 37403170
- PMCID: PMC10318735
- DOI: 10.1186/s13073-023-01200-8
Phylogenomic insights into evolutionary trajectories of multidrug resistant S. pneumoniae CC271 over a period of 14 years in China
Abstract
Background: Streptococcus pneumoniae is a gram-positive opportunistic pathogen, and infection risks of S. pneumoniae can be profoundly augmented by its acquired multidrug-resistance (MDR). The rapid development of MDR in S. pneumoniae was attributed to the international dissemination of a small number of multidrug-resistant "clones." Clonal complex (CC) 271 is a prevalent MDR CC in the world and the most prevalent CC in China. However, the evolutionary trajectories of multidrug-resistant S. pneumoniae CC271 in China still are largely unknown.
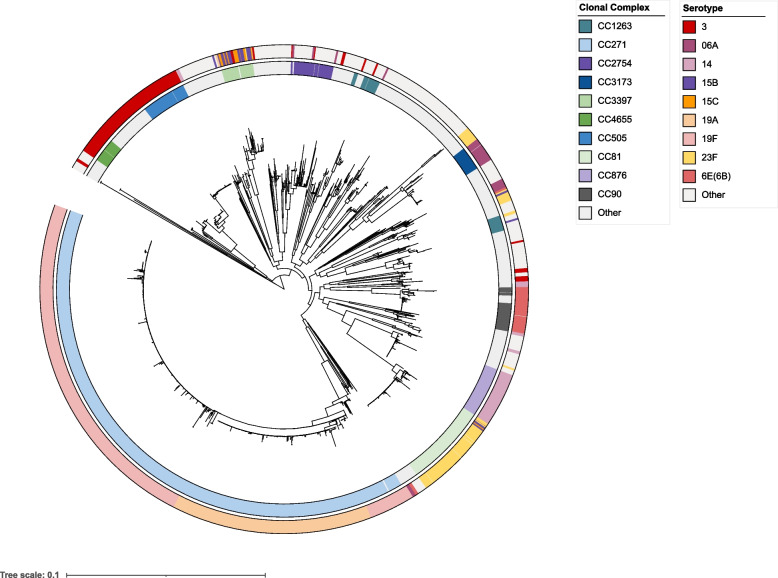
Methods: We investigated a collection of 1312 S. pneumoniae isolates collected from 28 tertiary hospitals in China from 2007 to 2020. Recombination prediction and recombination-masked phylogenetic analysis were combined to determine the population structure and mode of evolution of CC271. Data from the Global Pneumococcal Sequencing program (GPS) were combined to understand the global distribution of clones identified in this study. Bayesian analysis were recruited to analysis the evolutionary dynamics of dominant clones within CC271 in China.
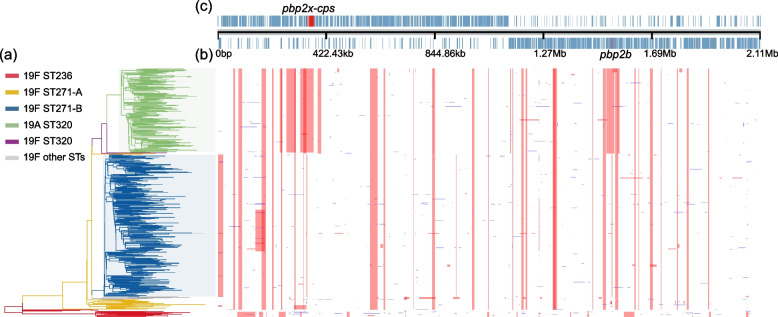
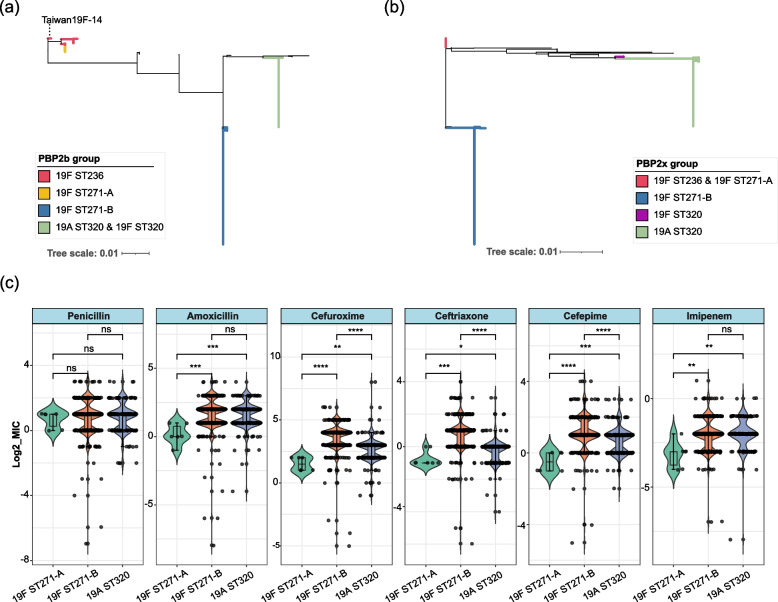
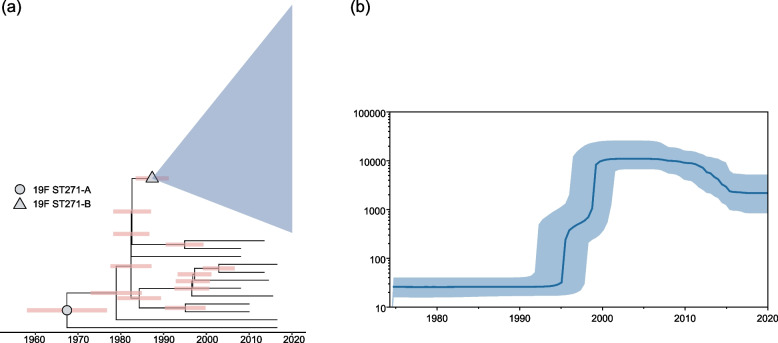
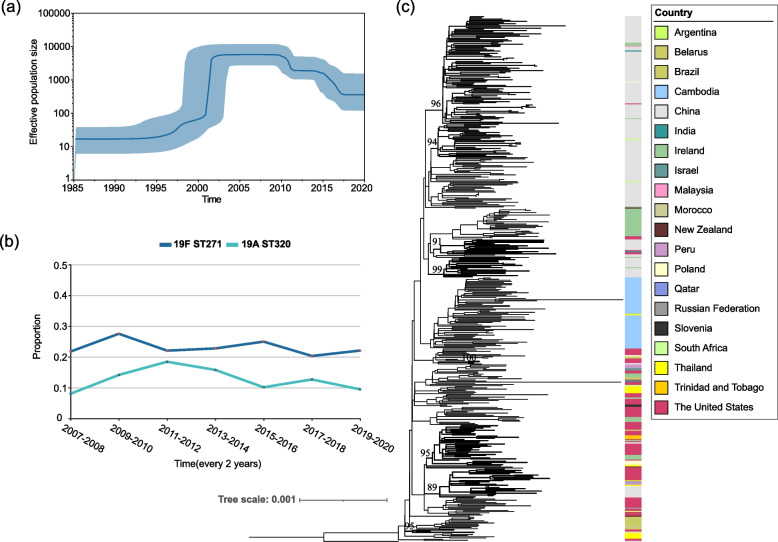
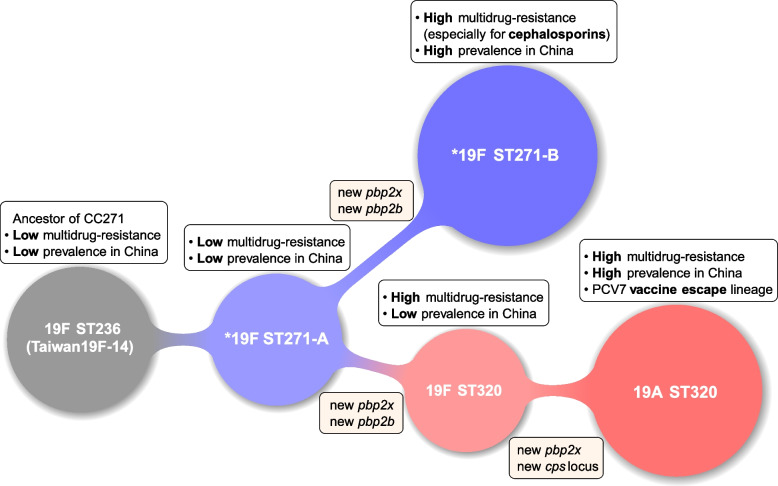
Results: The phylogenomic analysis resulted in the discovery of two globally distributed clones, ST271-A and ST271-B. ST271-A was a derivative of ST236 and an ancestor of ST271-B and ST320, refining the internal phylogenetic relationship of CC271. ST271-B was the most dominant clone in China, with higher β-lactam resistance especially for cephalosporins comparing to other MDR clones. Bayesian skyline plot showed a rapid expansion of 19F ST271-B from 1995 to 2000, which correlates with the widespread use of cephalosporins in the 1990s in China. 19A ST320, a vaccine-escape clone, is the second largest population in China. The Bayesian skyline plot showed that the 19A ST320 began to expand rapidly around 2001, which appeared to coincide with the prevalence of 19A after application of PCV7 in 2000 in the USA. We also observed frequent transmission of 19A ST320 between countries. It suggests that mass vaccination in some countries could affect the prevalence of clones in unvaccinated countries in the context of high-frequency international transmission.
Conclusions: Our results refined the internal phylogenetic relationship of CC271, showing that the 19F ST271-B and 19A ST320 evolved independently from ST271-A, with different histories and driving forces for their evolution and dissemination in China.
Keywords: CC271; Multidrug-resistant Clone; Streptococcus pneumoniae; Vaccine escape; Whole-genome sequencing.
© 2023. The Author(s).
Conflict of interest statement
The authors declare that they have no competing interests.
Figures
Similar articles
-
Phenotypic and genotypic characteristic of invasive pneumococcal isolates from both children and adult patients from a multicenter surveillance in China 2005-2011.PLoS One. 2013 Dec 11;8(12):e82361. doi: 10.1371/journal.pone.0082361. eCollection 2013. PLoS One. 2013. PMID: 24349263 Free PMC article.
-
Molecular characteristics of erythromycin-resistant Streptococcus pneumoniae from pediatric patients younger than five years in Beijing, 2010.BMC Microbiol. 2012 Oct 9;12:228. doi: 10.1186/1471-2180-12-228. BMC Microbiol. 2012. PMID: 23043378 Free PMC article.
-
Molecular Characterization Based on Whole-Genome Sequencing of Streptococcus pneumoniae in Children Living in Southwest China During 2017-2019.Front Cell Infect Microbiol. 2021 Nov 2;11:726740. doi: 10.3389/fcimb.2021.726740. eCollection 2021. Front Cell Infect Microbiol. 2021. PMID: 34796125 Free PMC article.
-
CIRCULATING CLONAL COMPLEXES AND SEQUENCE TYPES OF STREPTOCOCCUS PNEUMONIAE SEROTYPE 19A WORLDWIDE: THE IMPORTANCE OF MULTIDRUG RESISTANCE: A SYSTEMATIC LITERATURE REVIEW.Expert Rev Vaccines. 2021 Jan;20(1):45-57. doi: 10.1080/14760584.2021.1873136. Epub 2021 Feb 17. Expert Rev Vaccines. 2021. PMID: 33507135
-
Pilus islets and the clonal spread of piliated Streptococcus pneumoniae: A review.Int J Med Microbiol. 2020 Oct;310(7):151449. doi: 10.1016/j.ijmm.2020.151449. Epub 2020 Aug 27. Int J Med Microbiol. 2020. PMID: 33092697 Review.
Cited by
-
High Prevalence of Novel Sequence Types in Streptococcus pneumoniae That Caused Invasive Diseases in Kuwait in 2018.Microorganisms. 2024 Jan 22;12(1):225. doi: 10.3390/microorganisms12010225. Microorganisms. 2024. PMID: 38276209 Free PMC article.
-
Serotype, antibiotic susceptibility and whole-genome characterization of Streptococcus pneumoniae in all age groups living in Southwest China during 2018-2022.Front Microbiol. 2024 Feb 1;15:1342839. doi: 10.3389/fmicb.2024.1342839. eCollection 2024. Front Microbiol. 2024. PMID: 38362498 Free PMC article.
-
A global epidemic serotype 14 Streptococcus pneumoniae switching to non-vaccine types.Microbiol Spectr. 2025 Mar 31;13(5):e0315124. doi: 10.1128/spectrum.03151-24. Online ahead of print. Microbiol Spectr. 2025. PMID: 40162764 Free PMC article.
-
Holistic understanding of trimethoprim resistance in Streptococcus pneumoniae using an integrative approach of genome-wide association study, resistance reconstruction, and machine learning.mBio. 2024 Sep 11;15(9):e0136024. doi: 10.1128/mbio.01360-24. Epub 2024 Aug 9. mBio. 2024. PMID: 39120145 Free PMC article.
-
Point mutations in functionally diverse genes are associated with increased natural DNA transformation in multidrug resistant Streptococcus pneumoniae.Nucleic Acids Res. 2025 Jan 7;53(1):gkae1140. doi: 10.1093/nar/gkae1140. Nucleic Acids Res. 2025. PMID: 39673518 Free PMC article.
References
-
- Shi ZY, Enright MC, Wilkinson P, Griffiths D, Spratt BG. Identification of three major clones of multiply antibiotic-resistant Streptococcus pneumoniae in Taiwanese hospitals by multilocus sequence typing. J Clin Microbiol. 1998;36:3514–3519. doi: 10.1128/JCM.36.12.3514-3519.1998. - DOI - PMC - PubMed
Publication types
MeSH terms
Substances
LinkOut - more resources
Full Text Sources
Medical
