. 2024 Mar 14;229(3):833-844.
doi: 10.1093/infdis/jiad242.

The Identification of Enteric Fever-Specific Antigens for Population-Based Serosurveillance

Affiliations

The Identification of Enteric Fever-Specific Antigens for Population-Based Serosurveillance

Elli Mylona et al. J Infect Dis. .

Abstract

Background: Enteric fever, caused by Salmonella enterica serovars Typhi and Paratyphi A, is a major public health problem in low- and middle-income countries. Moderate sensitivity and scalability of current methods likely underestimate enteric fever burden. Determining the serological responses to organism-specific antigens may improve incidence measures.

Methods: Plasma samples were collected from blood culture-confirmed enteric fever patients, blood culture-negative febrile patients over the course of 3 months, and afebrile community controls. A panel of 17 Salmonella Typhi and Paratyphi A antigens was purified and used to determine antigen-specific antibody responses by indirect ELISAs.

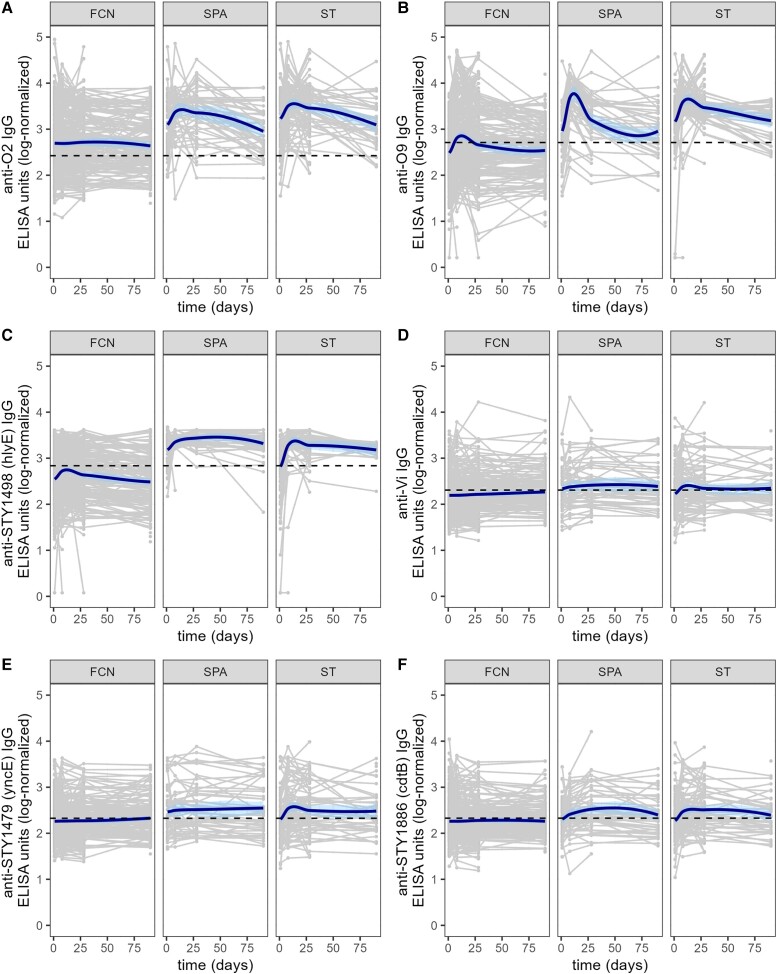
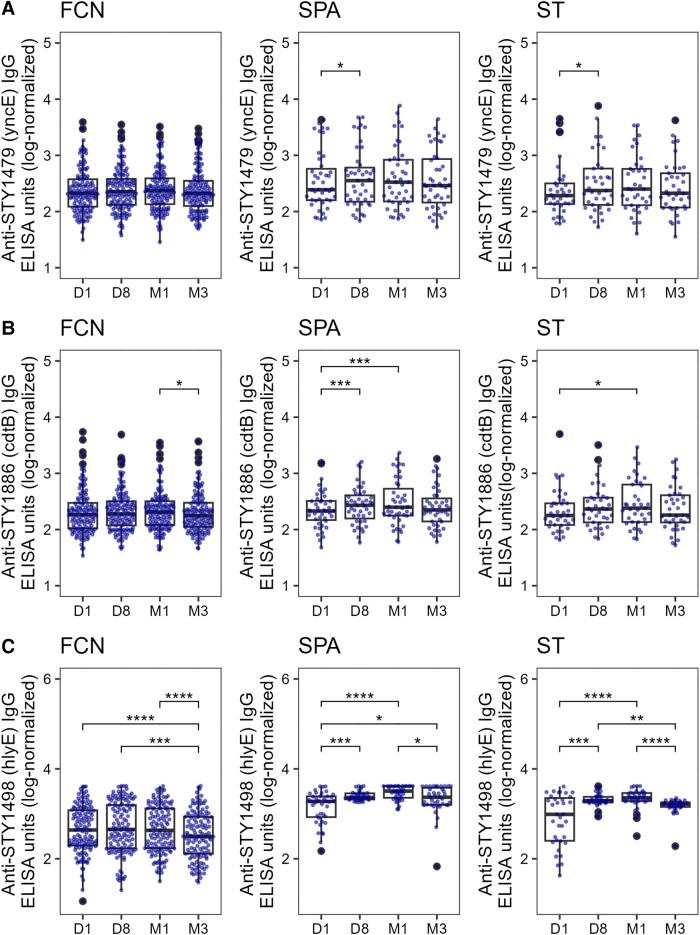
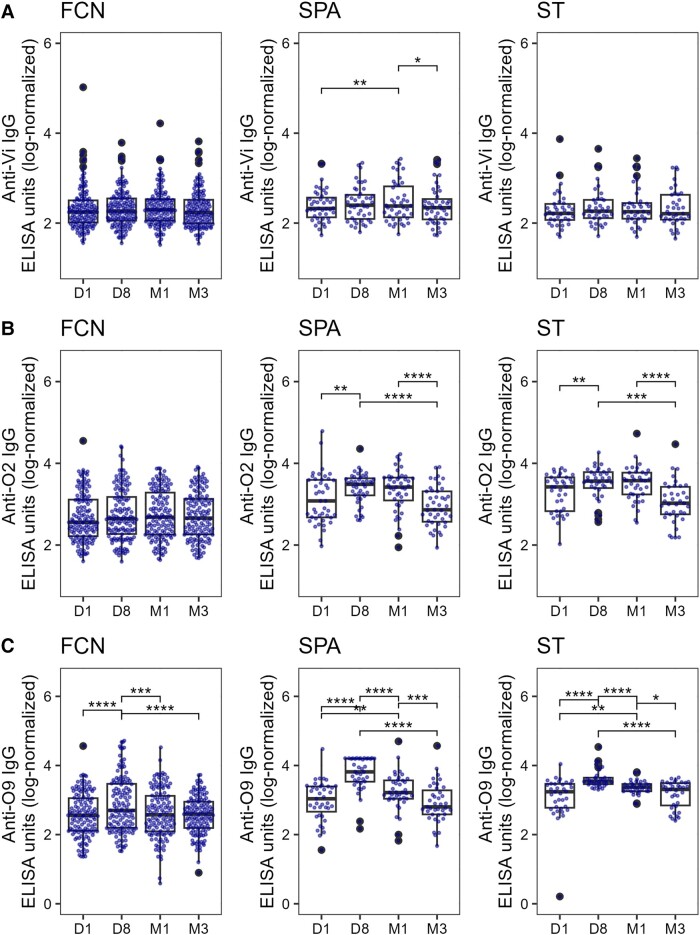
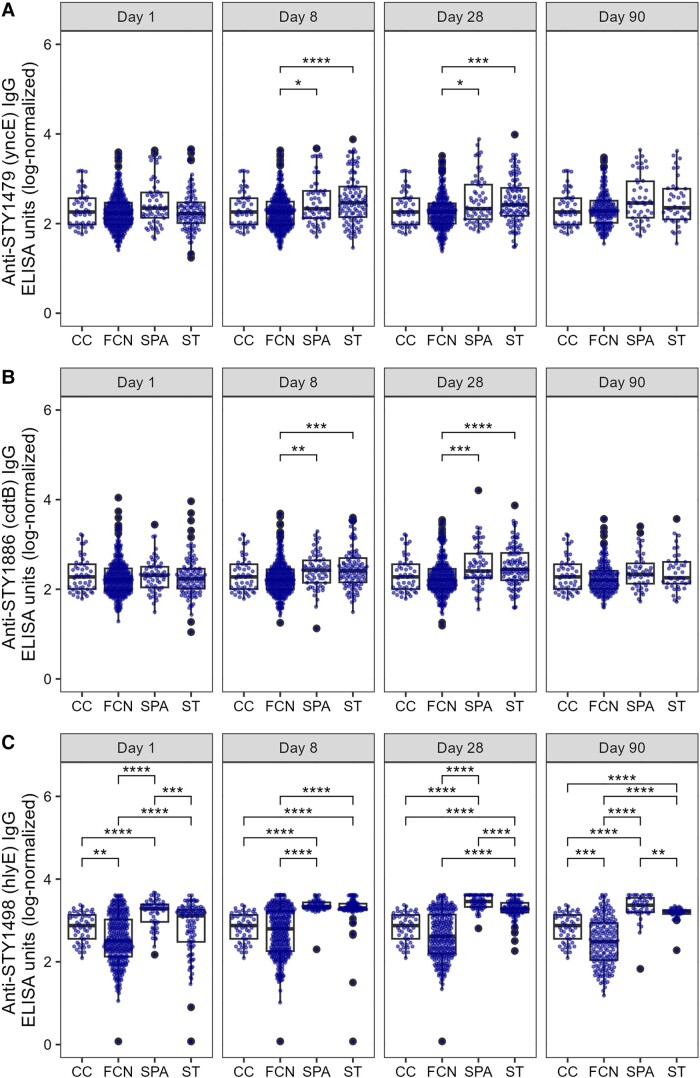
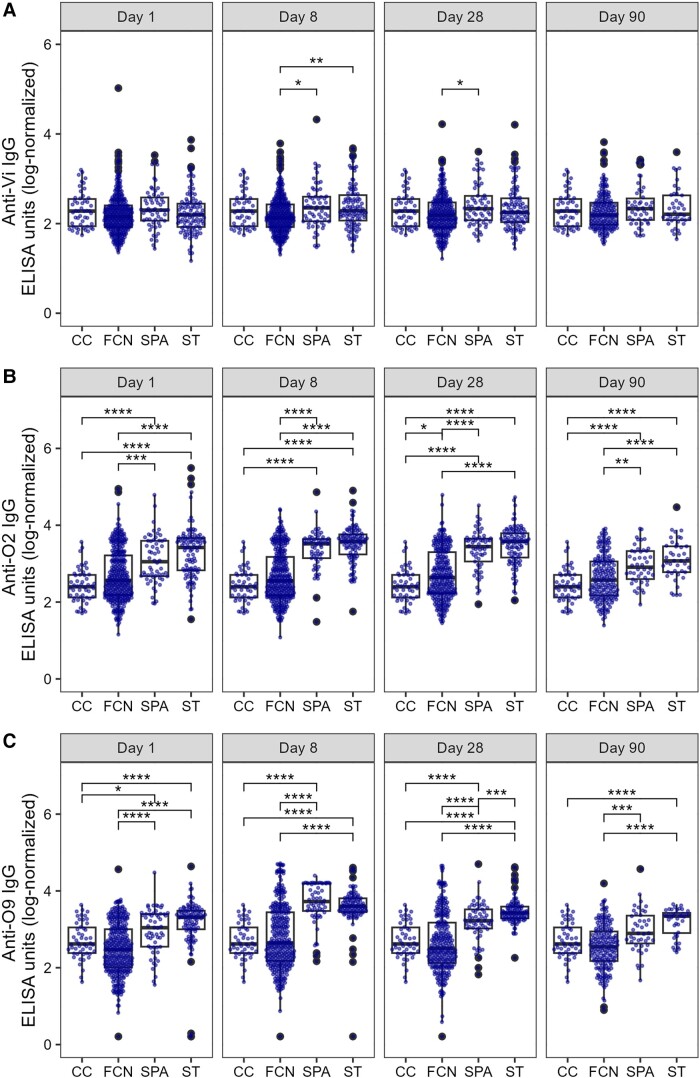
Results: The antigen-specific longitudinal antibody responses were comparable between enteric fever patients, patients with blood culture-negative febrile controls, and afebrile community controls for most antigens. However, we found that IgG responses against STY1479 (YncE), STY1886 (CdtB), STY1498 (HlyE), and the serovar-specific O2 and O9 antigens were greatly elevated over a 3-month follow up period in S. Typhi/S. Paratyphi A patients compared to controls, suggesting seroconversion.

Conclusions: We identified a set of antigens as good candidates to demonstrate enteric fever exposure. These targets can be used in combination to develop more sensitive and scalable approaches to enteric fever surveillance and generate invaluable epidemiological data for informing vaccine policies.

Clinical trial registration: ISRCTN63006567.

Keywords: IgG antibodies; enteric fever; longitudinal responses; serosurveillance.


Conflict of interest statement

Potential conflicts of interest. All authors: No reported conflicts. All authors have submitted the ICMJE Form for Disclosure of Potential Conflicts of Interest. Conflicts that the editors consider relevant to the content of the manuscript have been disclosed.

Figures

Figure 1.
Figure 1.
The longitudinal IgG responses against Salmonella Typhi or S. Paratyphi A purified antigens in a Nepali cohort of febrile patients. IgG antibody responses against O2 (A), O9 (B), STY1498 (C), Vi (D), STY1479 (E), and STY1886 (F) over the course of 3 months in different patient groups. Grey lines show antibody trajectories in individual patients and the solid bold line shows the fitted LOESS smooth function. Dashed lines represent the mean titer value within the control group of afebrile, community control samples for the respective antibody. Abbreviations: ELISA, enzyme-linked immunosorbent assay; FCN, culture negative febrile patients; IgG, immunoglobulin G; SPA, S. Paratyphi A confirmed patients; ST, S. Typhi-confirmed patients.
Figure 2.
Figure 2.
The distribution of serum IgG titers in a Nepali cohort of enteric fever patients and febrile culture-negative controls. Boxplots showing IgG titers in FCN, SPA, or ST against STY1479 (A), STY1886 (B), and STY1498 (C) antigens over the course of 3 months. Each dot shows the antibody titer of an individual sample on day 1 (D1), day 8 (D8), month 1 (M1), and month 3 (M3). Differences between time points were assessed using Friedman test followed by pairwise comparisons using Wilcoxon signed-rank tests. P values were adjusted using the Bonferroni multiple testing correction method. *P < .05, **P < .01, ***P < .001, ****P < .0001. Abbreviations: ELISA, enzyme-linked immunosorbent assay; FCN, culture negative febrile patients; IgG, immunoglobulin G; SPA, Salmonella Paratyphi A confirmed patients; ST, S. Typhi-confirmed patients. The box extends from 1st to 3rd quartile; IQR. The minimum/maximum whisker values are calculated as Q1/Q3 -/+ 1.5 * IQR.
Figure 3.
Figure 3.
The distribution of serum IgG titers in a Nepali cohort of enteric fever patients and febrile culture-negative controls. Boxplots showing IgG titers in plasma from FCN, SPA, or ST against Vi (A), O2 (B), and O9 (C) antigens over the course of 3 months. Each dot shows the antibody titer of an individual sample on day 1 (D1), day 8 (D8), month 1 (M1), and month 3 (M3). Differences between time points were assessed using Friedman test followed by pairwise comparisons using Wilcoxon signed-rank tests. P values were adjusted using the Bonferroni multiple testing correction method. *P < .05, **P < .01, ***P < .001, ****P < .0001. Abbreviations: ELISA, enzyme-linked immunosorbent assay; FCN, culture negative febrile patients; IgG, immunoglobulin G; SPA, Salmonella Paratyphi A confirmed patients; ST, S. Typhi-confirmed patients. The box extends from 1st to 3rd quartile; IQR. The minimum/maximum whisker values are calculated as Q1/Q3 -/+ 1.5 * IQR.
Figure 4.
Figure 4.
Correlation between antibody responses to selected Salmonella antigens on day 8. Spearman correlation among antigen-specific antibodies in community controls (A), from febrile, culture-negative patients (B), Salmonella Paratyphi A confirmed patients (C), and S. Typhi confirmed patients (D). Histograms show the distribution of the of each antigen-specific IgG antibody measurement on the diagonal. Scatterplots below the diagonal represent the correlation of IgG measurements of the 2 antigens on a right angle to the plots. The numerals above the diagonal depict the Spearman correlation coefficient (ρ) values of the mirrored plots.
Figure 5.
Figure 5.
The distribution of serum IgG titers in a Nepali cohort of febrile patients and controls. Boxplots showing IgG titers in plasma from CC, FCN infected with an unidentified pathogen, SPA, or ST against STY1479 (A), STY1886 (B), and STY1498 (C) antigens over the course of 3 months. Differences between time points were assessed first using Kruskal-Wallis test followed by pairwise comparisons using Wilcoxon signed-rank tests. P values were adjusted using the Bonferroni multiple testing correction method. *P < .05, **P < .01, ***P < .001, ****P < .0001. Abbreviations: CC, community control; ELISA, enzyme-linked immunosorbent assay; FCN, culture negative febrile patients; IgG, immunoglobulin G; SPA, Salmonella Paratyphi A confirmed patients; ST, S. Typhi-confirmed patients. The box extends from 1st to 3rd quartile; IQR. The minimum/maximum whisker values are calculated as Q1/Q3 -/+ 1.5 * IQR.
Figure 6.
Figure 6.
The distribution of serum IgG titers in a Nepali cohort of febrile patients and controls. Boxplots showing IgG titers in plasma from CC, FCN infected with an unidentified pathogen, SPA, or ST against Vi (A), O2 (B), and O9 (C) antigens over the course of 3 months. Differences between time points were assessed first using Kruskal-Wallis test followed by pairwise comparisons using Wilcoxon signed-rank tests. P values were adjusted using the Bonferroni multiple testing correction method. *P < .05, **P < .01, ***P < .001, ****P < .000. Abbreviations: ELISA, enzyme-linked immunosorbent assay; FCN, culture negative febrile patients; IgG, immunoglobulin G; SPA, Salmonella Paratyphi A confirmed patients; ST, S. Typhi-confirmed patients. The box extends from 1st to 3rd quartile; IQR. The minimum/maximum whisker values are calculated as Q1/Q3 -/+ 1.5 * IQR.

Similar articles

Cited by

  • Typhoid fever.
    Meiring JE, Khanam F, Basnyat B, Charles RC, Crump JA, Debellut F, Holt KE, Kariuki S, Mugisha E, Neuzil KM, Parry CM, Pitzer VE, Pollard AJ, Qadri F, Gordon MA. Meiring JE, et al. Nat Rev Dis Primers. 2023 Dec 14;9(1):71. doi: 10.1038/s41572-023-00480-z. Nat Rev Dis Primers. 2023. PMID: 38097589 Review.

References

    1. Stanaway JD, Reiner RC, Blacker BF, et al. The global burden of typhoid and paratyphoid fevers: a systematic analysis for the global burden of disease study 2017. Lancet Infect Dis 2019; 19:369–81. - PMC - PubMed
    1. Tamrakar D, Vaidya K, Yu AT, et al. Spatial heterogeneity of enteric fever in 2 diverse communities in Nepal. Clin Infect Dis 2020; 71:S205–13. - PMC - PubMed
    1. Maskey AP, Day JN, Tuan PQ, et al. Salmonella enterica serovar Paratyphi A and S. enterica serovar Typhi cause indistinguishable clinical syndromes in Kathmandu, Nepal. Clin Infect Dis 2006; 42:1247–53. - PubMed
    1. Crump JA, Sjölund-Karlsson M, Gordon MA, Parry CM. Epidemiology, clinical presentation, laboratory diagnosis, antimicrobial resistance, and antimicrobial management of invasive Salmonella infections. Clin Microbiol Rev 2015; 28:901–37. - PMC - PubMed
    1. Birkhold M, Mwisongo A, Pollard AJ, Neuzil KM. Typhoid conjugate vaccines: advancing the research and public health agendas. J Infect Dis 2021; 224:S781–7. - PMC - PubMed

Publication types

Substances

Associated data