

Centrosome amplification fine tunes tubulin acetylation to differentially control intracellular organization
- PMID: 37403793
- PMCID: PMC10425843
- DOI: 10.15252/embj.2022112812
Centrosome amplification fine tunes tubulin acetylation to differentially control intracellular organization
Abstract
Intracellular organelle organization is conserved in eukaryotic cells and is primarily achieved through active transport by motor proteins along the microtubule cytoskeleton. Microtubule post-translational modifications (PTMs) can contribute to microtubule diversity and differentially regulate motor-mediated transport. Here, we show that centrosome amplification, commonly observed in cancer and shown to promote aneuploidy and invasion, induces a global change in organelle positioning towards the cell periphery and facilitates nuclear migration through confined spaces. This reorganization requires kinesin-1 and is analogous to the loss of dynein. Cells with amplified centrosomes display increased levels of acetylated tubulin, a PTM that could enhance kinesin-1-mediated transport. Depletion of α-tubulin acetyltransferase 1 (αTAT1) to block tubulin acetylation rescues the displacement of centrosomes, mitochondria, and vimentin but not Golgi or endosomes. Analyses of the distribution of total and acetylated microtubules indicate that the polarized distribution of modified microtubules, rather than levels alone, plays an important role in the positioning of specific organelles, such as the centrosome. We propose that increased tubulin acetylation differentially impacts kinesin-1-mediated organelle displacement to regulate intracellular organization.
Keywords: ATAT1; centrosome amplification; kinesin-1; microtubules; tubulin acetylation.
© 2023 The Authors. Published under the terms of the CC BY 4.0 license.
Conflict of interest statement
The authors declare that they have no conflict of interest.
Figures
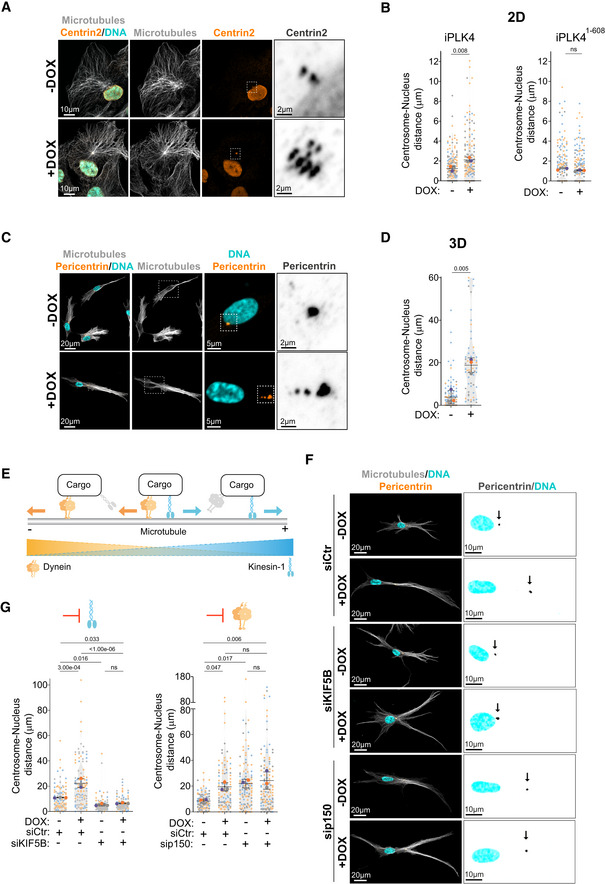
Representative images of cells stained for centrosomes (Centrin2, orange), microtubules (α‐tubulin, gray), and DNA (Hoechst, cyan). Scale bar: 10 μm; inset scale bar: 2 μm.
Quantification of centrosome‐nucleus distance in cells upon induction of PLK4 (Left panel; n (−DOX) = 174; n (+DOX) = 162) or PLK41‐608 overexpression (Right panel; n (−DOX) = 192; n (+DOX) = 203).
Representative images of cells embedded in a 3D collagen matrix and stained for centrosomes (Pericentrin, orange), microtubules (α‐tubulin, gray), and DNA (Hoechst, cyan). Scale bar: 20 μm; inset DNA/Pericentrin scale bar: 5 μm; inset Pericentrin scale bar: 2 μm.
Quantification of centrosome‐nucleus distance (n (−DOX) = 100; n (+DOX) = 62).
Scheme recapitulating the balance forces mediated by kinesin‐1 (blue) and dynein (orange) along microtubules.
Representative images of cells embedded in a 3D collagen matrix and stained for centrosomes (Pericentrin, orange), microtubules (α‐tubulin, gray), and DNA (Hoechst, cyan) treated with siRNA control (Ctr), siRNA KIF5B or siRNA p150. Scale bar: 20 μm. Black arrows indicate the position of the centrosome(s). Inset scale bar: 10 μm.
Left panel, Quantification of centrosome‐nucleus distance upon KIF5B depletion (number of cells: n (−DOX siCtr) = 96; n (+DOX siCtr) = 108; n (−DOX siKIF5B) = 111; n (+DOX siKIF5B) = 91); Right panel, Quantification of centrosome‐nucleus distance upon p150 depletion (n (−DOX siCtr) = 102; n (+DOX siCtr) = 96; n (−DOX sip150) = 115; n (+DOX sip150) = 117).
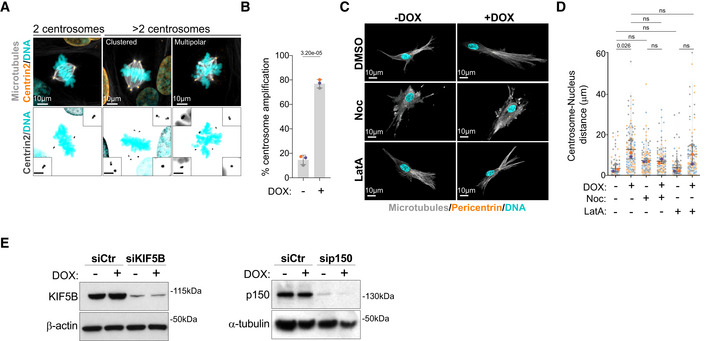
Representative images of cells stained for centrosomes (Centrin2, orange), microtubules (α‐tubulin, gray), and DNA (Hoechst, cyan). Scale bar: 10 μm; inset scale bar: 2 μm.
Quantification of metaphase cells with extra centrosomes (n (−DOX) = 337; n (+DOX) = 339).
Representative images of cells embedded in a 3D collagen matrix and stained for centrosomes (Pericentrin, orange), microtubules (α‐tubulin, gray), and DNA (Hoechst, cyan) treated with nocodazole (Noc, 10 μM) or latrunculin‐A (LatA, 100 nM). Scale bar: 10 μm.
Quantification of centrosome‐nucleus distance (n (−DOX) = 90; n (+DOX) = 114; n (−DOX Noc) = 112; n (+DOX Noc) = 101; n (−DOX LatA) = 110; n (+DOX LatA) = 108).
Left panel; immunoblot of KIF5B and β‐actin in cells after KIF5B siRNA for 48 h. Right panel; immunoblot of p150 and α‐tubulin in cells after p150 siRNA for 48 h.
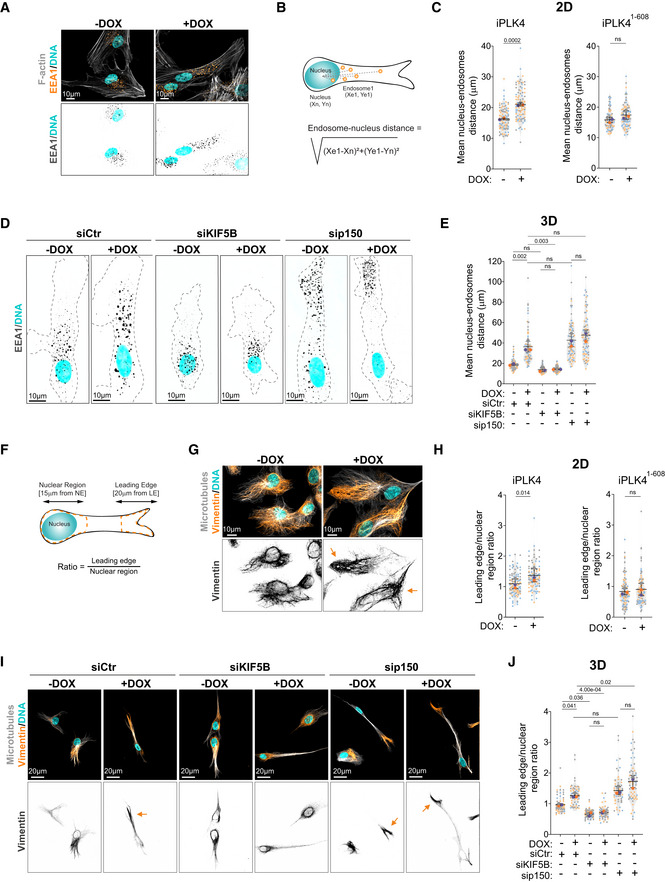
Representative images of cells stained for early endosomes (EEA1, orange), F‐actin (phalloidin, gray), and DNA (Hoechst, cyan). Scale bar: 10 μm.
Representing scheme of nucleus‐endosomes distance quantification.
Quantification of nucleus‐endosomes distance upon induction of PLK4 (Left panel: n (−DOX) = 103; n (+DOX) = 100) or PLK41‐608 overexpression (Right panel: n (−DOX) = 79; n (+DOX) = 83).
Representative images of cells embedded in a 3D collagen matrix and stained for early endosomes (EEA1, gray) and DNA (Hoechst, cyan). Dark dotted line represents cell contour. Scale bar: 10 μm.
Quantification of nucleus‐endosomes distance upon depletion of KIF5B and p150 (n (−DOX siCtr) = 84; n (+DOX siCtr) = 81; n (−DOX siKIF5B) = 84; n (+DOX siKIF5B) = 83; n (−DOX sip150) = 82; n (+DOX sip150) = 83).
Representative scheme of vimentin displacement quantification.
Representative images of cells stained for vimentin (orange), microtubules (α‐tubulin, gray), and DNA (Hoechst, cyan). Orange arrows indicate the displacement of vimentin towards cell periphery. Scale bar: 10 μm.
Quantification of vimentin leading edge/nuclear ratio upon induction of PLK4 (n (−DOX) = 102; n (+DOX) = 79) or PLK41‐608 overexpression (Right panel; n (−DOX) = 104; n (+DOX) = 101).
Representative images of cells embedded in a 3D collagen matrix and stained for vimentin (orange), microtubules (α‐tubulin, gray), and DNA (Hoechst, cyan) upon depletion of KIF5B and p150. Orange arrows indicate the displacement of vimentin towards cell periphery. Scale bar: 20 μm.
Quantification of vimentin leading edge/nuclear ratio (n (−DOX siCtr) = 68; n (+DOX siCtr) = 63; n (−DOX siKIF5B) = 70; n (+DOX siKIF5B) = 64; n (−DOX sip150) = 58; n (+DOX sip150) = 63).
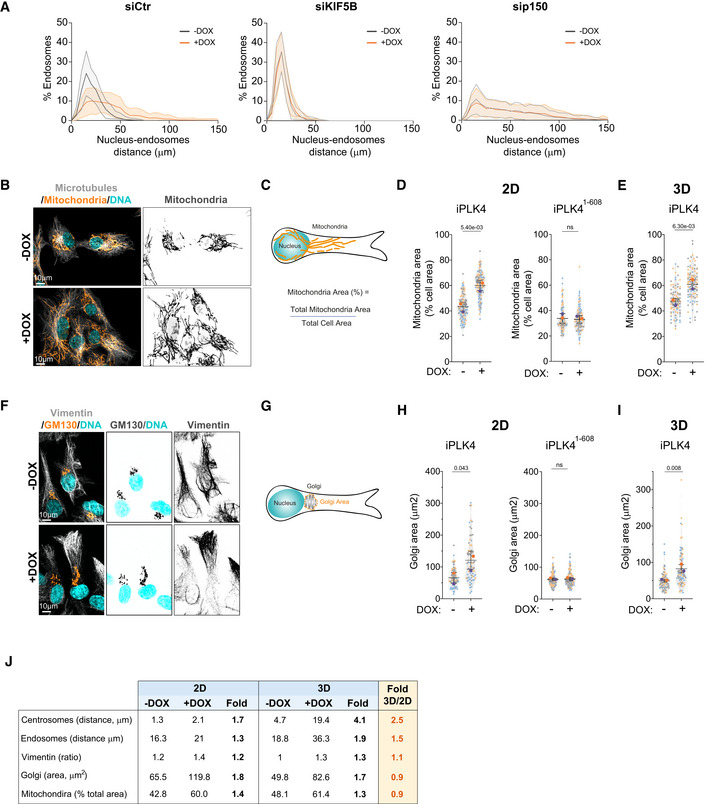
Distribution of endosomes in cells upon depletion of KIF5B and p150 (n (−DOX siCtr) = 84; n (+DOX siCtr) = 81; n (−DOX siKIF5B) = 84; n (+DOX siKIF5B) = 83; n (−DOX sip150) = 82; n (+DOX sip150) = 83).
Representative images of cells stained for mitochondria (MitoTracker, orange), microtubules (α‐tubulin, gray), and DNA (Hoechst, cyan). Scale bar: 10 μm.
Representative scheme of mitochondria area quantification.
Quantification of mitochondria area in cells plated in 2D upon induction of PLK4 (Left panel; n (−DOX) = 113; n (+DOX) = 114) or PLK41‐608 overexpression (Right panel; n (−DOX) = 95; n (+DOX) = 98).
Quantification of mitochondria area in cells plated in 3D (n (−DOX) = 90; n (+DOX) = 102).
Representative images of cells stained for Golgi (GM130, orange), vimentin (gray) and DNA (Hoechst, cyan). Scale bar: 10 μm.
Representative scheme of Golgi area quantification.
Quantification of Golgi area upon induction of PLK4 (Left panel; n (−DOX) = 94; n (+DOX) = 70) or PLK41‐608 overexpression (Right panel; n (−DOX) = 146; n (+DOX) = 133).
Quantification of Golgi area in cells plated in 3D (n (−DOX) = 91; n (+DOX) = 83).
Table summarizing the fold change between 2D and 3D conditions for the intracellular compartments analyzed.
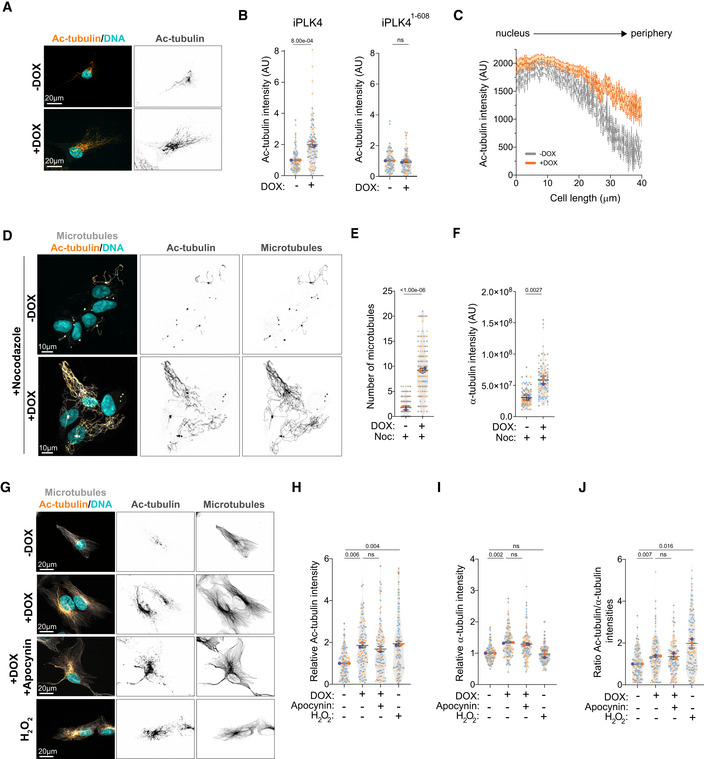
Representative images of cells stained for acetylated tubulin (Ac‐tubulin, orange) and DNA (Hoechst, cyan). Scale bar: 20 μm.
Quantification of acetylated tubulin fluorescence intensity upon induction of PLK4 (Left panel: n (−DOX) = 98; n (+DOX) = 89) or PLK41‐608 overexpression (Right panel: n (−DOX) = 78; n (+DOX) = 85).
Distribution of acetylated tubulin fluorescence intensity throughout the cell length (nucleus to periphery) (n (−DOX) = 37; n (+DOX) = 42).
Representative images of cells stained for microtubules (α‐tubulin, gray), tubulin acetylation (Ac‐tubulin, orange) and DNA (Hoechst, cyan) upon nocodazole treatment (Noc, 2 μM). Scale bar: 10 μm.
Quantification of the number of microtubules (n (−DOX Noc) = 185; n (+DOX Noc) = 149).
Quantification total α‐tubulin fluorescence intensity (n (−DOX Noc) = 128; n (+DOX Noc) = 105).
Representative images of cells stained for microtubules (α‐tubulin, gray), acetylated tubulin (Ac‐tubulin, orange) and DNA (Hoechst, cyan) treated with Apocynin (0.5 mM) or H2O2 (75 μM). Scale bar: 20 μm.
Quantification of acetylated tubulin fluorescence intensity (n (−DOX) = 118; n (+DOX) = 111; n (+DOX Apocynin) = 110; n (−DOX H2O2) = 118).
Quantification of total α‐tubulin fluorescence intensity (n (−DOX) = 118; n (+DOX) = 111; n (+DOX Apocynin) = 110; n (−DOX H2O2) = 118).
Ratio of acetylated tubulin intensity relative to total α‐tubulin intensity (n (−DOX) = 118; n (+DOX) = 111; n (+DOX Apocynin) = 110; n (−DOX H2O2) = 118).
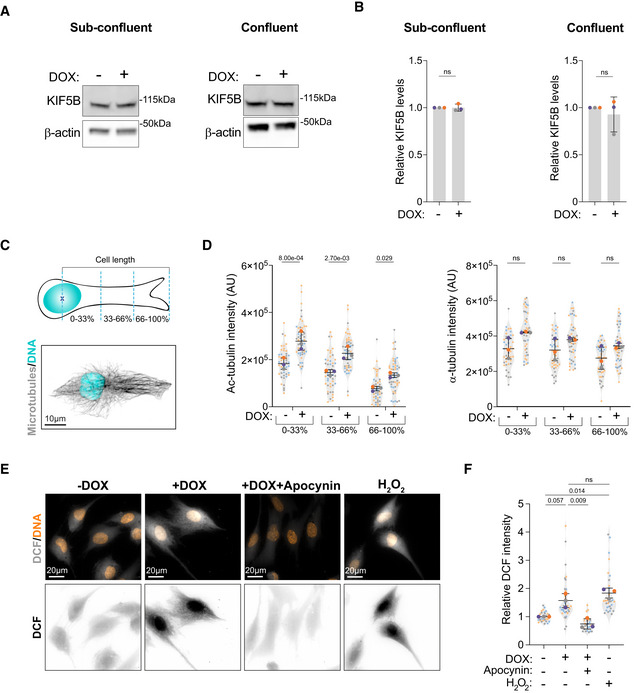
Immunoblots of KIF5B and β‐actin in cells without (−DOX) and with amplified centrosomes (+DOX) under sub‐confluent (Left panel) and confluent (Right panel) conditions.
Quantification of KIF5B total levels in cell lysates under sub‐confluent (Left panel) and confluent (Right panel) conditions.
Top panel: Representative scheme of the quantification of intracellular distribution of acetylated tubulin. Bottom panel: Representative image of a control cell stained for microtubules (α‐tubulin, gray) and DNA (Hoechst, cyan). Scale bar: 10 μm.
Left panel: Quantification of intracellular distribution of acetylated tubulin across the length of the cell; Right panel: Quantification of intracellular distribution of total tubulin across the length of the cell (n (−DOX) = 47; n (+DOX) = 52).
Representative images of cells stained for DNA (Hoechst, orange) and DCF (gray) treated with Apocynin (0.5 mM) and H2O2 (75 μM). Scale bar: 20 μm.
Quantification of total DCF fluorescence intensity (n (−DOX) = 30; n (+DOX) = 36; n (+DOX Apocynin) = 27; n (−DOX H2O2) = 30).
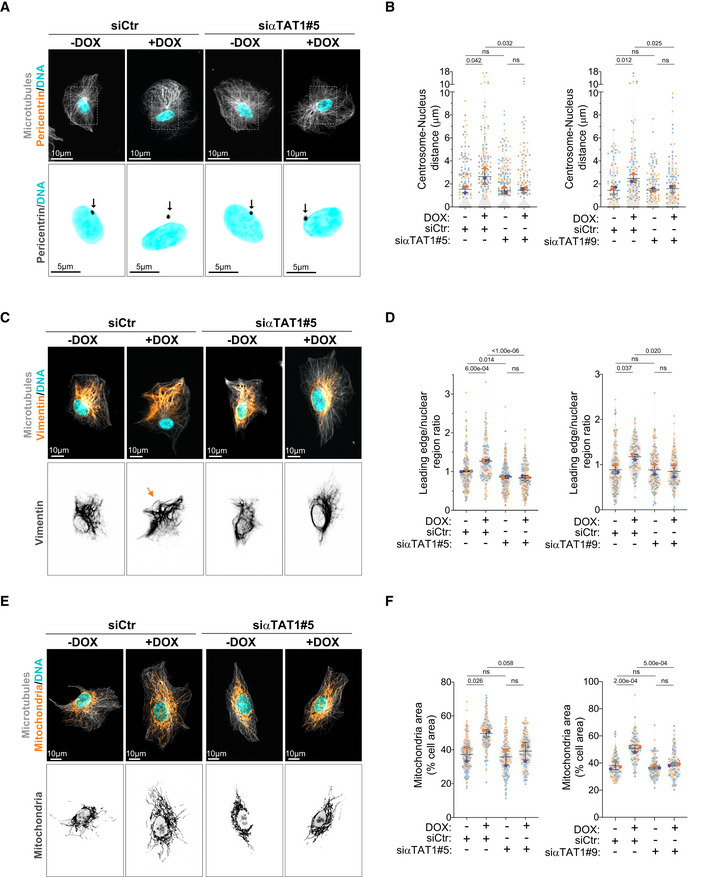
Representative images of cells stained for centrosomes (Pericentrin, orange), microtubules (α‐tubulin, gray), and DNA (Hoechst, cyan) upon depletion of αTAT1. Scale bar: 10 μm. Black arrows indicate the position of the centrosome(s). Scale bar: 5 μm.
Quantification of centrosome‐nucleus distance (Left panel: n (−DOX siCtr) = 164; n (+DOX siCtr) = 158; n (−DOX siαTAT1#5) = 235; n (+DOX siαTAT1#5) = 173; Right panel: n (−DOX siCtr) = 107; n (+DOX siCtr) = 119; n (−DOX siαTAT1#9) = 110; n (+DOX siαTAT1#9) = 118).
Representative images of cells stained for vimentin (orange), microtubules (α‐tubulin, gray), and DNA (Hoechst, cyan) upon depletion of αTAT1. Orange arrows indicate the displacement of vimentin towards cell periphery. Scale bar: 10 μm.
Quantification of vimentin leading edge/nuclear ratio (Left panel: n (−DOX siCtr) = 164; n (+DOX siCtr) = 123; n (−DOX siαTAT1#5) = 179; n (+DOX siαTAT1#5) = 137; Right panel: n (−DOX siCtr) = 144; n (+DOX siCtr) = 109; n (−DOX siαTAT1#9) = 130; n (+DOX siαTAT1#9) = 117).
Representative images of cells stained for mitochondria (MitoTracker, orange), microtubules (α‐tubulin, gray), and DNA (Hoechst, cyan) upon depletion of αTAT1. Scale bar: 10 μm.
Quantification of mitochondria area (Left panel: n (−DOX siCtr) = 169; n (+DOX siCtr) = 125; n (−DOX siαTAT1#5) = 130; n (+DOX siαTAT1#5) = 134; Right panel: n (−DOX siCtr) = 91; n (+DOX siCtr) = 89; n (−DOX siαTAT1#9) = 101; n (+DOX siαTAT1#9) = 89).
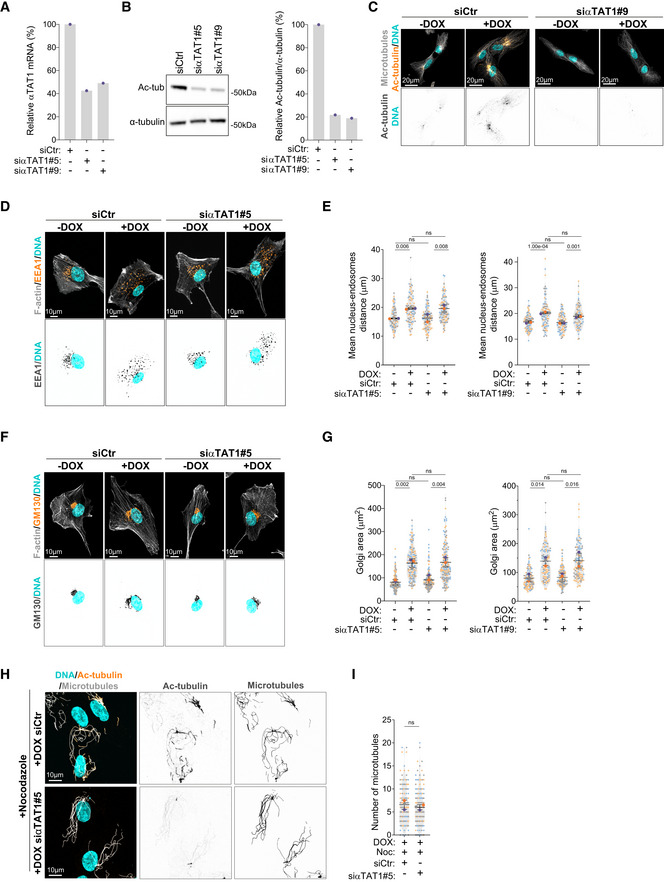
Quantification of αTAT1 mRNA expression in cells treated with siRNA against αTAT1 (two independent siRNAs; #5 and #9).
Left panel; immunoblot for α‐tubulin and acetylated tubulin (Ac‐tub) upon αTAT1 depletion (two independent siRNAs; #5 and #9). Right panel; percentage of acetylated tubulin relative to total α‐tubulin.
Representative images of cells stained for microtubules (α‐tubulin; gray), acetylated tubulin (Ac‐tubulin, orange) and DNA (Hoechst, cyan) upon αTAT1 depletion. Scale bar: 20 μm.
Representative images of cells stained for early endosomes (EEA1, orange), F‐actin (phalloidin, gray), and DNA (Hoechst, cyan) upon αTAT1 depletion. Scale bar: 10 μm.
Quantification of endosome‐nucleus distance (Left panel: n (−DOX siCtr) = 88; n (+DOX siCtr) = 90; n (−DOX siαTAT1#5) = 91; (+DOX siαTAT1#5) = 98; Right panel: n (−DOX siCtr) = 70; n (+DOX siCtr) = 64; n (−DOX siαTAT1#9) = 69; (+DOX siαTAT1#9) = 67).
Representative images of cells stained for Golgi (GM130, orange), F‐actin (phalloidin, gray), and DNA (Hoechst, cyan) upon αTAT1 depletion. Scale bar: 10 μm.
Quantification of Golgi area (Left panel: n (−DOX siCtr) = 177; n (+DOX siCtr) = 147; n (−DOX siαTAT1#5) = 172; n (+DOX siαTAT1#5) = 156; Right panel: n (−DOX siCtr) = 103; n (+DOX siCtr) = 103; n (−DOX siαTAT1#9) = 128; n (+DOX siαTAT1#9) = 109).
Representative images of cells treated with siRNA against αTAT1, stained for microtubules (α‐tubulin, cyan), acetylated tubulin (Ac‐tubulin, orange) and DNA (Hoechst, gray) upon nocodazole treatment (Noc, 2 μM). Scale bar: 10 μm.
Quantification of microtubule numbers (n (+DOX siCtr+Noc) = 145; n (+DOX siαTAT1+Noc) = 159).
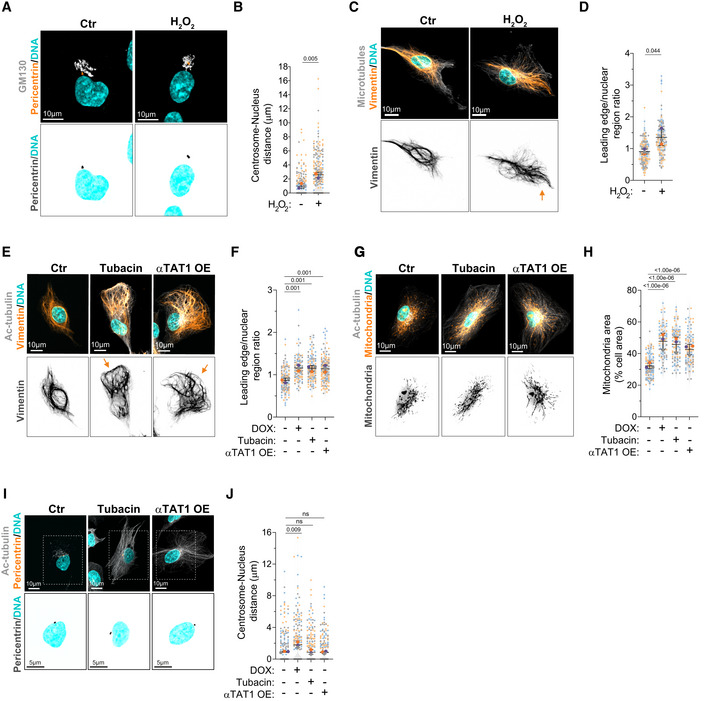
Representative images of cells stained for centrosomes (Pericentrin, orange), Golgi (GM130, gray), and DNA (Hoechst, cyan) treated with H2O2 (75 μM). Scale bar: 10 μm.
Quantification of centrosome‐nucleus distance (n (Ctr) = 192; n (H2O2) = 211).
Representative images of cells stained for vimentin (orange), microtubules (α‐tubulin, gray), and DNA (Hoechst, cyan) treated with H2O2. Orange arrows indicate the displacement of vimentin towards cell periphery. Scale bar: 10 μm.
Quantification of vimentin leading edge/nuclear ratio (n (Ctr) = 132; n (H2O2) = 117).
Representative images of cells stained for vimentin (orange), acetylated tubulin (Ac‐tubulin, gray), and DNA (Hoechst, cyan) treated with Tubacin (5 μM) or overexpressing eGFP‐αTAT1 (αTAT1 OE). Orange arrows indicate the displacement of vimentin towards cell periphery. Scale bar: 10 μm.
Quantification of vimentin leading edge/nuclear ratio (n (−DOX) = 108; n (+DOX) = 95; n (Tubacin) = 137; n (αTAT1 OE) = 123).
Representative images of cells stained for mitochondria (MitoTracker, orange), acetylated tubulin (Ac‐tubulin, gray), and DNA (Hoechst, cyan) treated with Tubacin or overexpressing eGFP‐αTAT1 (αTAT1 OE). Scale bar: 10 μm.
Quantification of mitochondria area (n (−DOX) = 102; n (+DOX) = 86; n (Tubacin) = 90; n (αTAT1 OE) = 101).
Representative images of cells stained for centrosomes (Pericentrin, orange), acetylated tubulin (Ac‐tubulin, gray), and DNA (Hoechst, cyan) treated with Tubacin or overexpressing eGFP‐αTAT1 (αTAT1 OE). Scale bar: 10 μm. Inset scale bar: 5 μm.
Quantification of centrosome‐nucleus distance (n (−DOX) = 270; n (+DOX) = 222; n (Tubacin) = 248; n (αTAT1 OE) = 288).
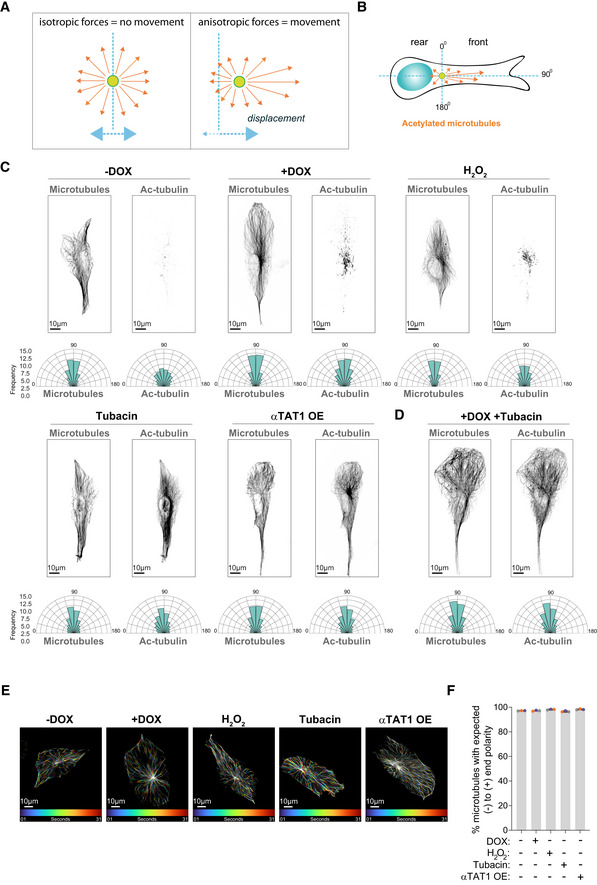
Scheme representing how distribution of forces could impact movement/displacement of the centrosome.
Scheme depicting how orientation of total and acetylated microtubules was determined in cells.
Top: Representative images of total and acetylated microtubules (gray) in control cells (−DOX), cells with amplified centrosomes (+DOX), treated with H2O2 or Tubacin and overexpressing eGFP‐αTAT1 (αTAT1 OE). Scale bar: 10 μm. Bottom panel: Rose plots displaying the frequency of total and acetylated microtubules orientation in the cell front (n (−DOX) = 61; n (+DOX) = 48; n (H2O2) = 84; n (Tubacin) = 89; n (αTAT1 OE) = 70).
Top: Representative images of total and acetylated microtubules (gray) in cells with amplified centrosomes treated with Tubacin (+DOX + Tubacin). Bottom panel: Rose plots displaying the frequency of total and acetylated microtubules orientation in the cell front (n (+DOX Tubacin) = 73).
Representative images of color‐coded temporal projection of EB3‐GFP comets over 30 s. Scale bar: 10 μm.
Quantification of the percentage of EB3‐GFP comets per cell that follow normal (−) to (+) end polarity assessed by live‐cell imaging (n (−DOX) = 25; n (+DOX) = 23; n (H2O2) = 25; n (Tubacin) = 23; n (αTAT1 OE) = 42).
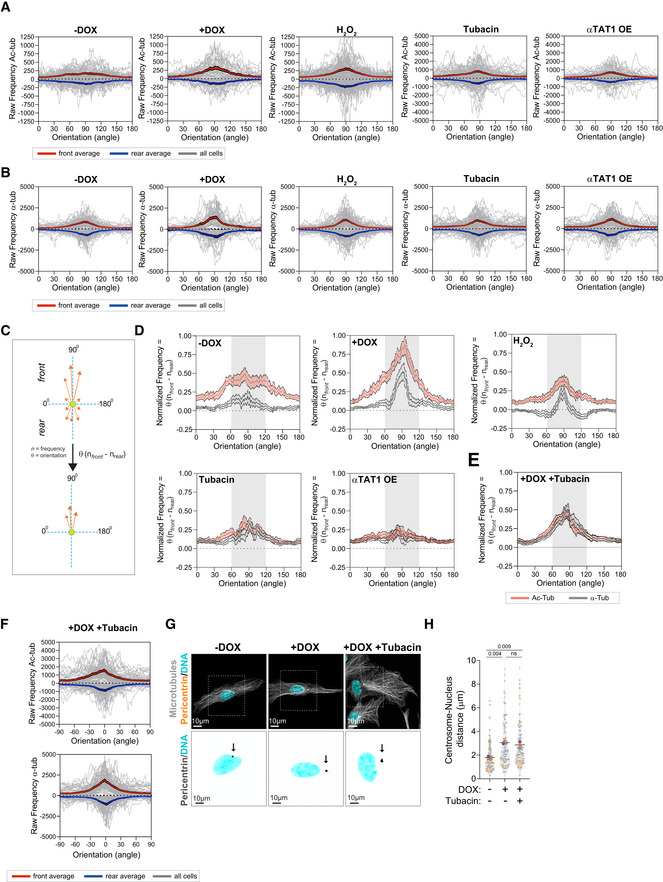
Raw frequency of the distribution of acetylated microtubules orientation towards cell front (+ve values) and rear (−ve values) for all individual cells (gray lines). Red line represents the average for front orientations and blue line the averages for rear orientations for all cells (n (−DOX) = 61; n (+DOX) = 48; n (H2O2) = 84; n (Tubacin) = 89; n (αTAT1 OE) = 70).
Raw frequency of the distribution of total microtubules orientation towards cell front (+ve values) and rear (−ve values) for all individual cells (gray lines). Red line represents the average for front orientations and blue line the averages for rear orientations for all cells (n (−DOX) = 61; n (+DOX) = 48; n (H2O2) = 84; n (Tubacin) = 89; n (αTAT1 OE) = 70).
Scheme depicting how subtraction of rear from front values was determined and how this could be used as a measure for polarized microtubule distribution.
Quantification of the distribution of acetylated microtubule orientation upon subtracting rear values from front values (n (−DOX) = 61; n (+DOX) = 48; n (H2O2) = 84; n (Tubacin) = 89; n (αTAT1 OE) = 70).
Quantification of the distribution of acetylated microtubule orientation upon subtracting rear values from front values (n (+DOX Tubacin) = 73).
Raw frequency of the distribution of acetylated microtubules (Left) and total microtubules (Right) orientation towards cell front (+ve values) and rear (−ve values) for all individual cells (gray lines). Red line represents the average for front orientations and blue line the averages for rear orientations for all cells (n (+DOX Tubacin) = 73).
Representative images of cells stained for centrosomes (Pericentrin, orange), microtubules (α‐tubulin, gray), and DNA (Hoechst, cyan). Scale bar: 10 μm. Black arrows indicate the position of the centrosome(s). Inset scale bar: 10 μm.
Quantification of nucleus‐centrosome distance (n (−DOX) = 108; n (+DOX) = 87; n (+DOX+Tubacin) = 97).
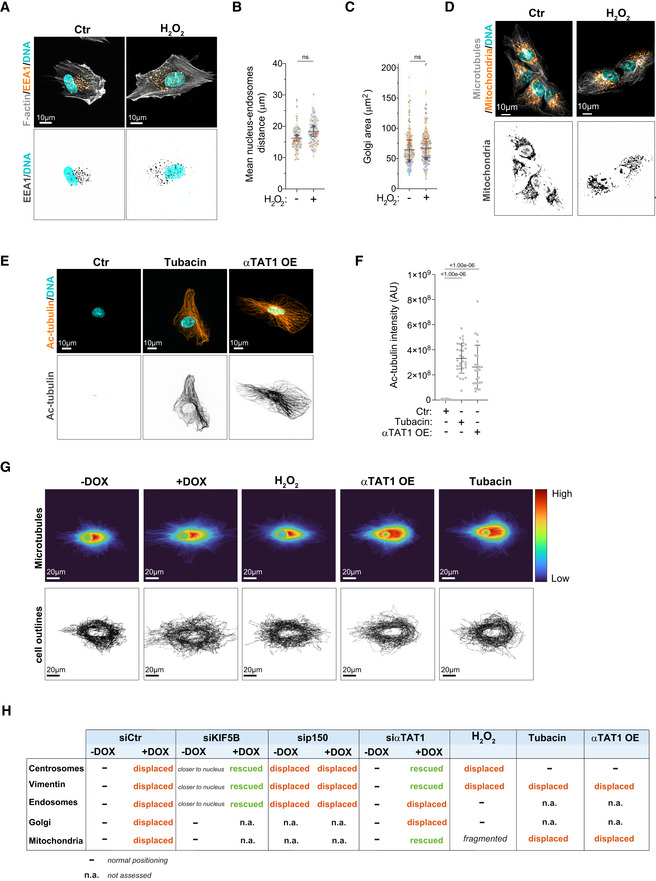
Representative images of cells stained for early endosomes (EEA1, orange), F‐actin (phalloidin, gray), and DNA (Hoechst, cyan) treated with H2O2. Scale bar: 10 μm.
Quantification of endosomes‐nucleus distance (n (Ctr) = 82; n (H2O2) = 79).
Quantification of Golgi area (n (Ctr) = 151; n (H2O2) = 157).
Representative images of cells stained for mitochondria (MitoTracker, orange), microtubules (α‐tubulin, gray), and DNA (Hoechst, cyan) treated with H2O2 (75 μM). Scale bar: 10 μm.
Representative images of cells stained for acetylated tubulin (Ac‐tubulin, orange) and DNA (Hoechst, cyan) treated with Tubacin (5 μM) or overexpressing eGFP‐αTAT1 (αTAT1 OE). Scale bar: 10 μm.
Quantification of acetylated tubulin fluorescence intensity (n (Ctr) = 29; n (Tubacin) = 32; n (αTAT1 OE) = 25).
Top: Heat map of α‐tubulin distribution in 50 cells from each condition. Bottom: Outline of all cells (based on α‐tubulin signal). Cells were superimposed using the center of the nucleus as reference point. Scale bar: 20 μm.
Table summarizing the effect of different treatments on intracellular organization.
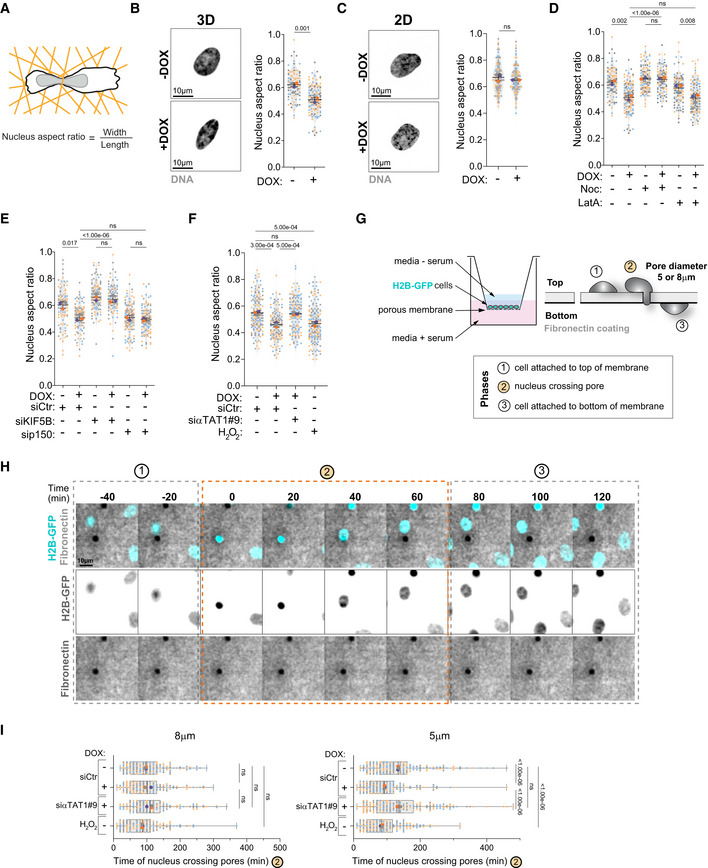
Representative scheme of nucleus aspect ratio quantification.
Left: Representative images of the nucleus (Hoechst, gray) in control cells (−DOX) and upon induction of extra centrosomes (+DOX) in 3D. Scale bar: 10 μm. Right: Quantification of nucleus aspect ratio in 3D (n (−DOX) = 100; n (+DOX) = 62).
Left: Representative images of the nucleus (Hoechst, gray) in control cells (−DOX) and upon induction of extra centrosomes (+DOX) in 2D. Scale bar: 10 μm. Right: Quantification of nucleus aspect ratio in 2D (n (−DOX) = 114; n (+DOX) = 102).
Quantification of nucleus aspect ratio (n (−DOX) = 90; n (+DOX) = 114; n (−DOX Noc) = 112; n (+DOX Noc) = 101; n (−DOX LatA) = 110; n (+DOX LatA) = 108).
Quantification of nucleus aspect ratio (n (−DOX siCtr) = 95; n (+DOX siCtr) = 107; n (−DOX siKIF5B) = 111; n (+DOX siKIF5B) = 91; n (−DOX sip150) = 115; n (+DOX sip150) = 117).
Quantification of nucleus aspect ratio (n (−DOX siCtr) = 148; n (+DOX siCtr) = 129; n (+DOX siαTAT1#9) = 134; n (H2O2) = 154).
Representative scheme of the Transwell system and nucleus crossing constrictions.
Still images from live‐cell imaging depicting cell nucleus (H2B‐GFP, cyan) crossing pores on membranes coated with fibronectin (gray). Time spent in phase 2 is depicted in the graph in (I). Scale bar: 10 μm.
Quantification of time spent by the nucleus to cross 5‐μm or 8‐μm diameter constrictions (phase 2) (Left panel, 8‐μm pores: n (−DOX siCtr) = 180; n (+DOX siCtr) = 132; n (+DOX siαTAT1#9) = 160; n (H2O2) = 153; Right panel, 5‐μm pores: n (−DOX siCtr) = 178; n (+DOX siCtr) = 150; n (+DOX siαTAT1#9) = 196; n (H2O2) = 172).
Similar articles
-
Posttranslational modifications of tubulin and the polarized transport of kinesin-1 in neurons.Mol Biol Cell. 2010 Feb 15;21(4):572-83. doi: 10.1091/mbc.e09-01-0044. Epub 2009 Dec 23. Mol Biol Cell. 2010. PMID: 20032309 Free PMC article.
-
Microtubule acetylation promotes kinesin-1 binding and transport.Curr Biol. 2006 Nov 7;16(21):2166-72. doi: 10.1016/j.cub.2006.09.014. Curr Biol. 2006. PMID: 17084703
-
Mitotic Acetylation of Microtubules Promotes Centrosomal PLK1 Recruitment and Is Required to Maintain Bipolar Spindle Homeostasis.Cells. 2021 Jul 22;10(8):1859. doi: 10.3390/cells10081859. Cells. 2021. PMID: 34440628 Free PMC article.
-
Microtubule acetylation dyshomeostasis in Parkinson's disease.Transl Neurodegener. 2023 May 8;12(1):20. doi: 10.1186/s40035-023-00354-0. Transl Neurodegener. 2023. PMID: 37150812 Free PMC article. Review.
-
Interplay between microtubule dynamics and intracellular organization.Int J Biochem Cell Biol. 2012 Feb;44(2):266-74. doi: 10.1016/j.biocel.2011.11.009. Epub 2011 Nov 17. Int J Biochem Cell Biol. 2012. PMID: 22108200 Review.
Cited by
-
Centrosome amplification primes ovarian cancer cells for apoptosis and potentiates the response to chemotherapy.PLoS Biol. 2024 Sep 5;22(9):e3002759. doi: 10.1371/journal.pbio.3002759. eCollection 2024 Sep. PLoS Biol. 2024. PMID: 39236086 Free PMC article.
-
The Mitochondrial Connection: The Nek Kinases' New Functional Axis in Mitochondrial Homeostasis.Cells. 2024 Mar 7;13(6):473. doi: 10.3390/cells13060473. Cells. 2024. PMID: 38534317 Free PMC article. Review.
-
Vimentin supports cell polarization by enhancing centrosome function and microtubule acetylation.J R Soc Interface. 2024 Jun;21(215):20230641. doi: 10.1098/rsif.2023.0641. Epub 2024 Jun 5. J R Soc Interface. 2024. PMID: 38835244 Free PMC article.
-
How does the tubulin code facilitate directed cell migration?Biochem Soc Trans. 2025 Feb 21;53(1):BST20240841. doi: 10.1042/BST20240841. Biochem Soc Trans. 2025. PMID: 39998313 Free PMC article. Review.
-
Bystanders or active players: the role of extra centrosomes as signaling hubs.Cancer Metastasis Rev. 2024 Nov 20;44(1):1. doi: 10.1007/s10555-024-10224-4. Cancer Metastasis Rev. 2024. PMID: 39570514 Free PMC article. Review.
References
Publication types
MeSH terms
Substances
Grants and funding
LinkOut - more resources
Full Text Sources
Miscellaneous
