. 2023 Aug 25;51(15):e80.
doi: 10.1093/nar/gkad562.

Combining TSS-MPRA and sensitive TSS profile dissimilarity scoring to study the sequence determinants of transcription initiation

Affiliations

Combining TSS-MPRA and sensitive TSS profile dissimilarity scoring to study the sequence determinants of transcription initiation

Carlos Guzman et al. Nucleic Acids Res. .

Abstract

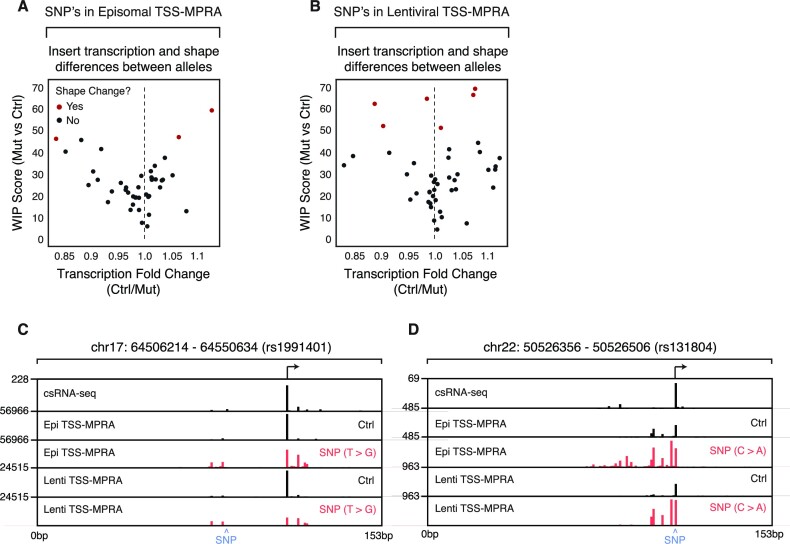
Cis-regulatory elements (CREs) can be classified by the shapes of their transcription start site (TSS) profiles, which are indicative of distinct regulatory mechanisms. Massively parallel reporter assays (MPRAs) are increasingly being used to study CRE regulatory mechanisms, yet the degree to which MPRAs replicate individual endogenous TSS profiles has not been determined. Here, we present a new low-input MPRA protocol (TSS-MPRA) that enables measuring TSS profiles of episomal reporters as well as after lentiviral reporter chromatinization. To sensitively compare MPRA and endogenous TSS profiles, we developed a novel dissimilarity scoring algorithm (WIP score) that outperforms the frequently used earth mover's distance on experimental data. Using TSS-MPRA and WIP scoring on 500 unique reporter inserts, we found that short (153 bp) MPRA promoter inserts replicate the endogenous TSS patterns of ∼60% of promoters. Lentiviral reporter chromatinization did not improve fidelity of TSS-MPRA initiation patterns, and increasing insert size frequently led to activation of extraneous TSS in the MPRA that are not active in vivo. We discuss the implications of our findings, which highlight important caveats when using MPRAs to study transcription mechanisms. Finally, we illustrate how TSS-MPRA and WIP scoring can provide novel insights into the impact of transcription factor motif mutations and genetic variants on TSS patterns and transcription levels.


Figures

Graphical Abstract
Graphical Abstract
Figure 1.
Figure 1.
TSS-MPRA of synthetic regulatory sequences mirrors the vast majority of endogenous initiation patterns and transcription levels. (A) Schematic of TSS-MPRA. Transcription activity and location of transcription initiation is determined by 5′ RNA-seq of reporter transcripts initiating within synthetic DNA inserts cloned into reporter plasmids and electroporated into cells. Histograms on the right show cumulative DNA-normalized number of sequence tags aligning to each base position of a 153-bp region surrounding the human HBE1 promoter in K562 cells. Capped reporter transcripts are drawn in purple. RT: reverse transcription primer landing site. BC: barcode sequence. (B) Spearman's correlation of DNA-normalized RNA levels of all inserts of two replicate episomal TSS-MPRA experiments. (C) Correlation between the transcriptional signal of 250 genomic DNA inserts in epi-short TSS-MPRA and csRNA-seq of the corresponding endogenous loci. TSS-MPRA inserts were chosen randomly from locations exhibiting transcription activity as measured by csRNA-seq. Spearman's correlation of TSS-MPRA and csRNA-seq transcription levels of all regulatory sequences, or of promoters (red) or enhancers (blue, outside of a ± 2-kb window of RefSeq-annotated promoters). Regions were chosen to cover a wide range of transcription levels and initiation patterns. Each dot represents the relative transcript levels observed in each assay as total normalized read counts of all transcripts aligning to each region. TSS-MPRA RNA read counts were normalized by the corresponding plasmid DNA read counts.
Figure 2.
Figure 2.
TSS-MPRA fidelity correlates with genomic TSS pattern width, transcription level, and presence of core promoter elements. (A) Schematic of the outlier detection model used to determine whether two TSS distributions are similar or not. Higher WIP scores (see methods for derivation) are indicative of more dissimilar initiation patterns. (B) TSS-MPRA preferentially recapitulates focused initiation patterns. Focus ratios (y-axis) of TSS-MPRA initiation patterns that are similar (blue) or dissimilar (red) to the corresponding endogenous initiation patterns as measured by csRNA-seq. Focus ratios of 0 indicate fully dispersed (broad) initiation patterns, while 1 indicates fully focused (sharp) patterns. (C) TSS-MPRA better recapitulates initiation patterns of more actively transcribed genomic regions. Endogenous locus transcription levels (csRNA-seq tag counts, y-axis) where TSS-MPRA initiation shape is similar (blue) or dissimilar (red) to the corresponding endogenous initiation pattern. (D) Strong transcription in the TSS-MPRA correlates with presence of TATA and Inr core promoter elements. Position-specific nucleotide frequencies (y-axis) (A: blue, C: purple, G: red, and T: orange) relative to each TSS in all TSS-MPRA inserts where: overall TSS-MPRA shapes of the inserts mirror the endogenous initiation patterns (I), or where insert TSS shapes do not mirror endogenous initiation patterns and either the respective TSSs within the overall TSS shape have 3x higher contribution to the overall signal of a given insert in TSS-MPRA data than in csRNA-seq (II), or the respective TSSs have 3× higher contribution to the overall signal of a given insert in csRNA-seq over TSS-MPRA data (III). The x-axis denotes the distance in bp from each TSS (bp 0).
Figure 3.
Figure 3.
Longer inserts initiate transcription at additional non-endogenous TSSs and decrease overall TSS-MPRA transcription initiation fidelity. (A) Non-native TSS use in epi-long TSS-MPRA. Frequency of TSS usage between csRNA-seq (top), short TSS-MPRA (middle), and long TSS-MPRA (bottom). The y-axis, TSS usage frequency, is defined as the oligo position-specific cumulative normalized initiation frequencies in TSS-MPRA and csRNA-seq across all native TSS-MPRA inserts and corresponding genomic regions. At the top a schematic representation of the insert-containing oligos: overhang cloning sequence, followed by genomic DNA insert, 11-mer barcode and second overhang cloning sequence. The box and dots in blue marked ‘CORE’ are the positions covered by the 153-bp insert of the epi-short pool. (B) Increased insert length increases enhancer but not promoter transcription correlation between TSS-MPRA and csRNA-seq. Spearman's correlation of epi-long TSS-MPRA and csRNA-seq levels between all (purple) 250 regulatory sequences selected to cover a wide range of transcription levels and initiation patterns, or of only enhancers (blue), or only promoters (red). (C) Increased correlation of CORE (153-bp region) initiation frequencies within longer inserts of enhancers but not promoters. This analysis is restricted to the 153-bp region marked ‘CORE’ in (A). Color scheme as in (B).
Figure 4.
Figure 4.
Reporter chromatinization has negligible effect on transcription initiation patterns and lowers correlation between TSS-MPRA and csRNA-seq transcription levels. (A) Schematic of genomic integration of a synthetic insert using lentiviral integration. (B) High reproducibility of Lenti-TSS-MPRA. Spearman's correlation of RNA/DNA normalized levels between all the inserts of two replicate lentiviral TSS-MPRA experiments. (C) High reproducibility in TSS profile changes between episomal and lentiviral TSS-MPRA experiments. WIP scores between csRNA-seq and lentiviral TSS-MPRA on the y-axis are highly correlated with the WIP scores between csRNA-seq and episomal TSS-MPRA on the x-axis. Dots are colored by how dissimilar insert TSS profiles are between lentiviral and episomal TSS-MPRA experiments. Higher WIP scores represent greater dissimilarity. (D) Spearman's correlation of lenti-short Lenti-TSS-MPRA and csRNA-seq levels between all 250 randomly selected regulatory sequences covering a wide range of transcription levels and initiation patterns (purple), only enhancers (blue), or only promoters (red). (E) Spearman's correlation of lenti-long Lenti-TSS-MPRA and csRNA-seq levels between all 250 randomly selected regulatory sequences covering a wide range of transcription levels and initiation patterns (purple), only enhancers (blue) or only promoters (red). (F) Spearman's correlation of lenti-long Lenti-TSS-MPRA and csRNA-seq levels between all 250 randomly selected regulatory sequences covering a wide range of transcription levels and initiation patterns (purple), only enhancers (blue), or only promoters (red). This analysis is restricted to the 153-bp region marked ‘CORE’ in Figure 3A.
Figure 5.
Figure 5.
TSS-MPRA enables studying the effect of motif mutations on reporter-driven initiation patterns and transcription levels. (A) Tracking transcription initiation changes caused by mutations in transcription factor and core promoter element motifs in episomal plasmids. Scatterplot comparing the changes in initiation patterns (WIP score, y-axis) and transcription levels (fold change, x-axis) between control and mutated inserts in episomal plasmids. Red dots signify inserts with significantly changed TSS shapes after mutation. (B) TSS shape changes after motif mutation in episomal constructs. The y-axis represents the mean WIP score between all inserts (and their barcode replicates) containing a particular motif and the corresponding insert with the mutated motif. Colors correspond to motif identities. (C) Transcription level changes associated with motif mutation in episomal constructs. The y-axis represents the mean fold transcription change of the inserts (and their barcode replicates) containing a particular wild-type or mutated motif (x-axis). (D) Tracking transcription initiation changes caused by transcription factor and core promoter element motif mutations after lentiviral integration into the genome. Scatterplot comparing the changes in initiation patterns (WIP score, y-axis) and transcription levels (fold change, x-axis) between control and mutated inserts in lentiviral plasmids. Red dots signify inserts with significantly changed TSS shapes after mutation. (E) TSS shape changes after motif mutation in lentiviral constructs. The y-axis represents the mean WIP score between all inserts (and their barcode replicates) containing a particular motif and the corresponding insert with the mutated motif. Colors correspond to motif identities. (F) Transcription level changes associated with motif mutation in lentiviral constructs. The y-axis represents the mean fold transcription change of the inserts (and their barcode replicates) containing a particular wild-type or mutated motif (x-axis). (G) Example track for the ACTB promoter, showing csRNA-seq (top), TSS-MPRA, and Lenti-TSS-MPRA output without (black) and with (red) TATA-box motif mutation. Blue highlights indicate the positions where motifs were replaced by a constant sequence with no known transcription factor motif. (H) Example track for the ENO1 promoter, showing csRNA-seq (top), TSS-MPRA, and Lenti-TSS-MPRA output before (black) and after (red) PU.1 motif mutation. Blue highlights indicate the positions where motifs were replaced.
Figure 6.
Figure 6.
Assessing the effects of single nucleotide polymorphisms on reporter-driven initiation patterns and transcription levels. (A) Allele-specific transcription initiation differences caused by known GWAS SNPs in episomal plasmids. Scatterplot comparing the changes in initiation patterns (y-axis) and transcription fold change (x-axis) between control and variant inserts in episomal constructs. Red dots signify inserts that had significant changes to their TSS shapes. (B) Allele-specific transcription initiation differences caused by known GWAS SNPs in lentiviral constructs. Scatterplot comparing the changes in initiation patterns (y-axis) and transcription fold change (x-axis) between control and variant inserts in lentivirally integrated constructs. Red dots signify inserts that had significant changes to their TSS shapes. (C) SNP rs1991401 is associated with TSS shape changes. Track showing csRNA-seq (top), TSS-MPRA, and Lenti-TSS-MPRA output of the T (black) and G (red) allele. A blue ‘^’ symbol indicates the location of the SNP. (D) TSS shape differences associated with SNP rs131804. Track showing csRNA-seq (top), TSS-MPRA, and Lenti-TSS-MPRA output of the C (black) and A (red) allele. A blue ‘^’ symbol marks the SNP location.

Similar articles

Cited by

References

    1. Shiraki T., Kondo S., Katayama S., Waki K., Kasukawa T., Kawaji H., Kodzius R., Watahiki A., Nakamura M., Arakawa T.et al. .. Cap analysis gene expression for high-throughput analysis of transcriptional starting point and identification of promoter usage. Proc. Natl. Acad. Sci. U.S.A. 2003; 100:15776–15781. - PMC - PubMed
    1. Nechaev S., Fargo D.C., Santos G., Liu L., Gao Y., Adelman K.. Global analysis of short rnas reveals widespread promoter-proximal stalling and arrest of Pol II in Drosophila. Science. 2010; 327:335–338. - PMC - PubMed
    1. Kruesi W.S., Core L.J., Waters C.T., Lis J.T., Meyer B.J.. Condensin controls recruitment of RNA polymerase II to achieve nematode X-chromosome dosage compensation. Elife. 2013; 2:e00808. - PMC - PubMed
    1. Core L.J., Martins A.L., Danko C.G., Waters C.T., Siepel A., Lis J.T.. Analysis of nascent RNA identifies a unified architecture of initiation regions at mammalian promoters and enhancers. Nat. Genet. 2014; 46:1311. - PMC - PubMed
    1. Duttke S.H., Chang M.W., Heinz S., Benner C.. Identification and dynamic quantification of regulatory elements using total RNA. Genome Res. 2019; 29:1836–1846. - PMC - PubMed

Publication types

MeSH terms

Substances