. 2023 Jul 25;17(14):14123-14135.
doi: 10.1021/acsnano.3c04726. Epub 2023 Jul 5.

Echinacoside-Zinc Nanomaterial Inhibits Skin Glycation by Suppressing the Transcriptional Activation of the Receptor for Advanced Glycation End-Products

Affiliations

Echinacoside-Zinc Nanomaterial Inhibits Skin Glycation by Suppressing the Transcriptional Activation of the Receptor for Advanced Glycation End-Products

Jingxia Han et al. ACS Nano. .

Abstract

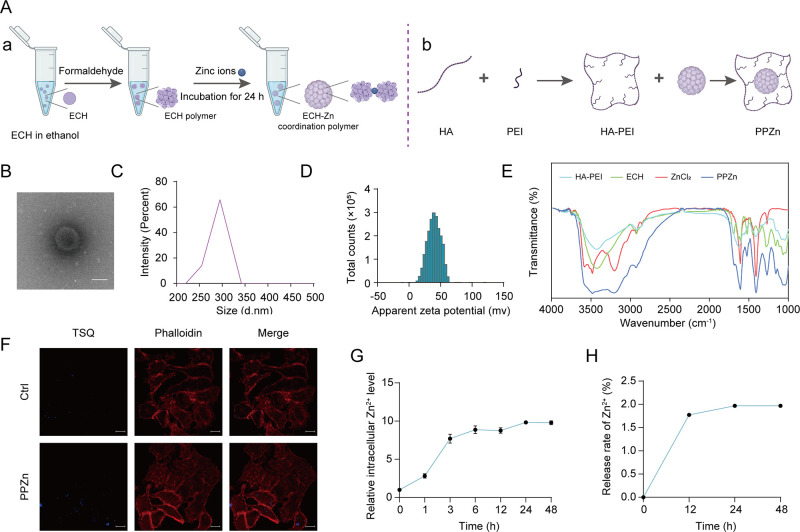
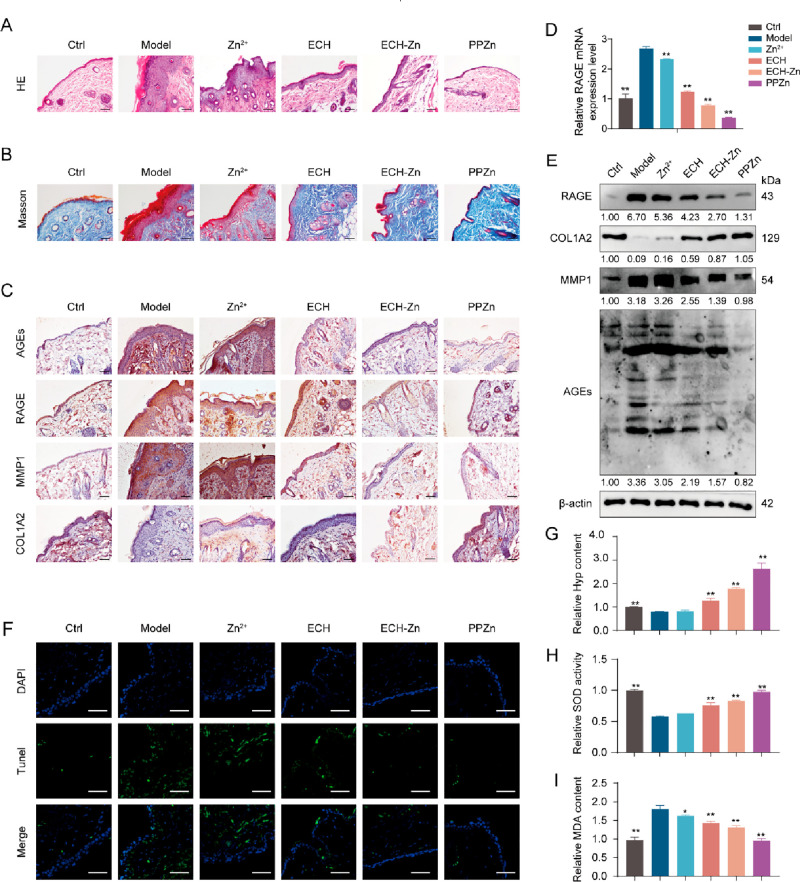
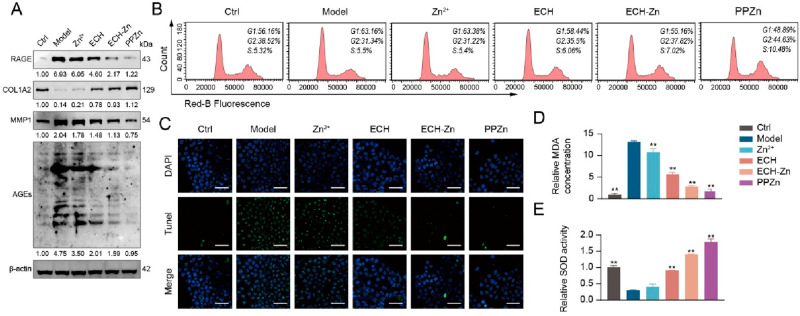
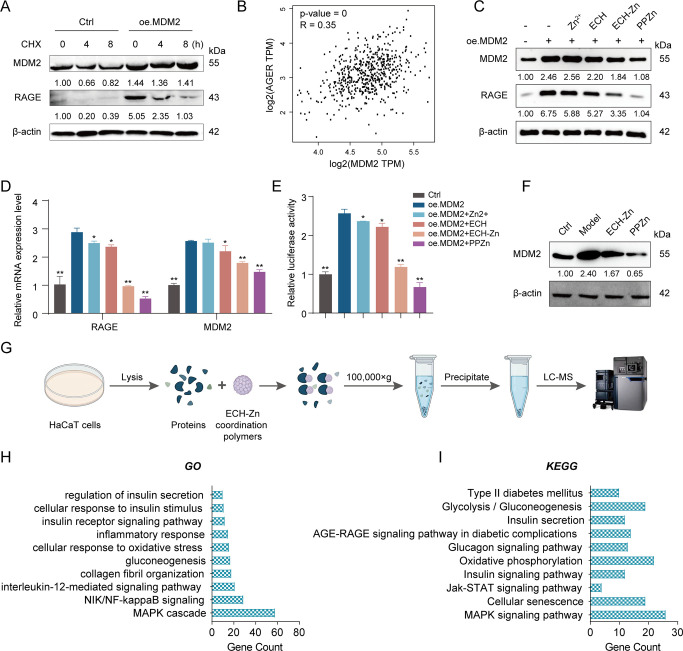
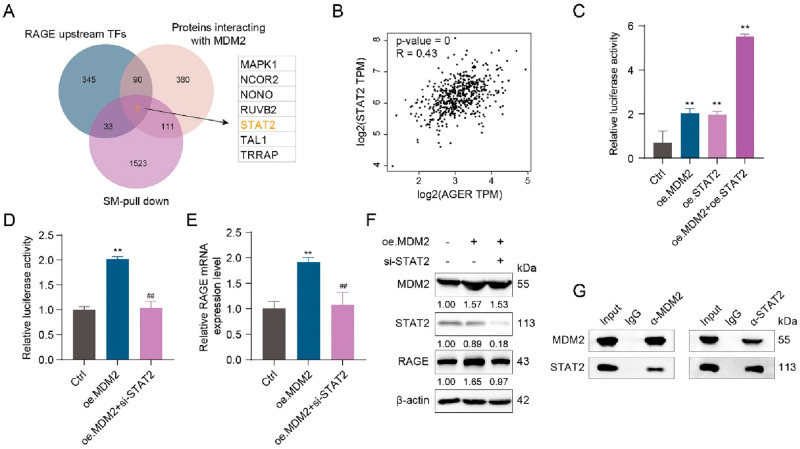
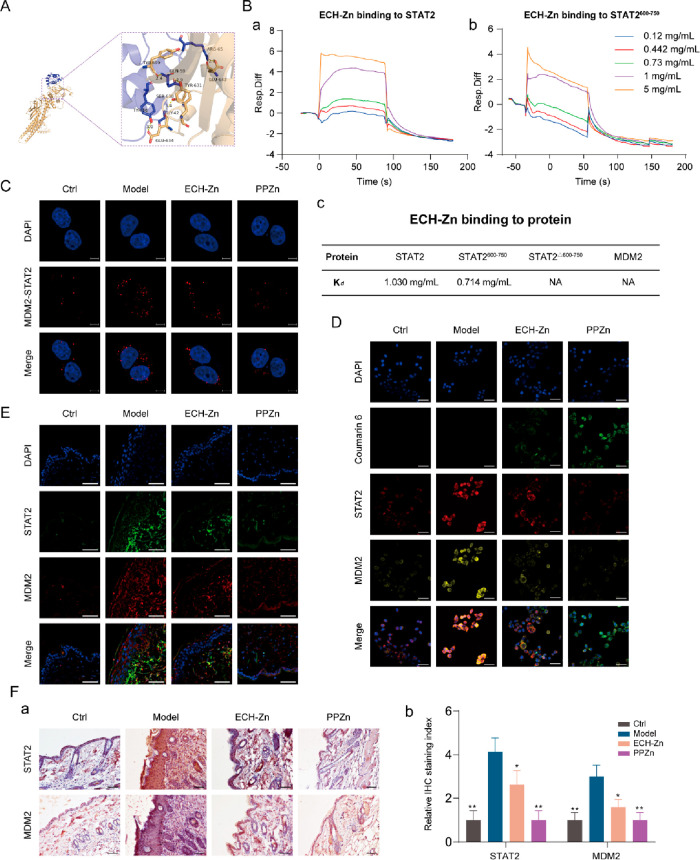
Glycation is a nonenzymatically catalyzed spontaneous reaction that eventually leads to the formation of advanced glycation end-products (AGEs), which can bind to the receptor for AGEs (RAGE). The consequences are oxidative damage, an inflammatory response, and aging. In this work, we synthesized echinacoside-zinc coordination polymers (ECH-Zn) by using the coordination interaction between the catechol group of ECH and zinc ions. ECH-Zn was further wrapped with hyaluronic acid/poly (ethylenimine) (HA-PEI) to obtain spherical nanoparticle polymers of HA-PEI-coated ECH-Zn (PPZn). PPZn can enhance the uptake and utilization of ECH-Zn and also have a better antiglycation effect in the skin under the effect of promoting transdermal absorption of HA-PEI. Mechanistic studies at the cellular level showed that MDM2 can interact with STAT2 to form a transcriptional complex and thus promote RAGE transcriptional activation. In vitro and in vivo studies revealed that PPZn can decrease the expression and inhibit the interaction of the MDM2/STAT2 complex. It inhibited the function of the MDM2/STAT2 complex and suppressed the transcriptional activation of RAGE, thereby exerting antiglycation effects. In conclusion, this work provides a nanomaterial and elucidated a mechanism of anti-skin glycation.

Keywords: MDM2; RAGE; STAT2; echinacoside; glycation.


Conflict of interest statement

The authors declare no competing financial interest.

Figures

Figure 1
Figure 1
Preparation and characterization of PPZn. (A) Flowchart of PPZn preparation. (B) Morphological detection of PPZn with cryo-TEM. Scale bar, 200 nm. (C) Size measurement of PPZn with NanoSight. (D) Zeta potentials of PPZn. (E) IR spectra of HA-PEI, ECH, ZnCl2, and PPZn. (F) Representative images of Zn2+ TSQ staining after the indicated treatment for 24 h. Scale bar, 10 μm. (G) Trend of Zn2+ with time detected using a microplate reader. (H) Release of Zn2+ as determined by ICP-MS.
Figure 2
Figure 2
PPZn exerted anti-antiglycan in glycated model mouse skin. (A–C) Representative images of immunohistochemical (IHC) staining (A–a), HE staining (B–a), and Masson staining (C–a) of mouse skin tissue after the indicated treatment. The statistical results of the IHC staining index (A–b), epidermal thickness (B–b), and collagen density (C–b) are shown on the right. Scale bar, 50 μm. (D) qRT-PCR detection of RAGE mRNA levels in skin tissues of mice after the indicated treatment. (E) Western blot representative images and quantitative analysis of RAGE, COL1A2, MMP1, AGEs, and β-actin protein levels in skin tissues of mice after the indicated treatment. (F) Representative images of TUNEL staining of mouse skin tissue after the indicated treatment. Scale bar, 50 μm. (G–I) Relative Hyp content (G), SOD activity (H), and MDA concentration (I) in skin tissues of mice after the indicated treatment. All values are presented as the mean ± SD; P-values determined by two-sided Student’s t test. *P < 0.05, **P < 0.01, compared with the model.
Figure 3
Figure 3
PPZn exerted antiglycation effects in HaCaT cells. (A) Western blot representative images and quantitative analysis of RAGE, COL1A2, MMP1, AGEs, and β-actin protein levels in HaCaT cells after the indicated treatment. (B) Cell cycle was determined by flow cytometry in HaCaT cells after the indicated treatment. (C) Representative images of TUNEL staining of HaCaT cells after the indicated treatment. Scale bar, 50 μm. (D, E) Relative MDA concentration (D) and SOD activity (E) in HaCaT cells after the indicated treatment. All values are presented as the mean ± SD; P-values determined by two-sided Student’s t test. *P < 0.05, **P < 0.01, compared with the model.
Figure 4
Figure 4
PPZn inhibited RAGE transcriptional activation via MDM2. (A) CHX chase assay for the half-life of RAGE. Western blot representative images and quantitative analysis of MDM2, RAGE, and β-actin protein levels in HaCaT cells after the indicated treatment. (B) Correlation analysis between MDM2 and AGER in skin was performed using the GEPIA2 web server. (C) Western blot representative images and quantitative analysis of MDM2, RAGE, and β-actin protein levels in HaCaT cells after the indicated treatment. (D) qRT-PCR detection of RAGE and MDM2 mRNA levels in HaCaT cells after the indicated treatment. (E) Relative luciferase activity of RAGE promoter in HaCaT cells after the indicated treatment by dual luciferase reporter gene assay. (F) Western blot representative images and quantitative analysis of MDM2, and β-actin protein levels in HaCaT cells after the indicated treatment. (G) Flowchart of SM pulldown. (H, I) GO (H) and KEGG (I) enrichment analysis results of SM pulldown-enriched proteins. All values are presented as the mean ± SD; P-values determined by two-sided Student’s t test. *P < 0.05, **P < 0.01, compared with oe. MDM2.
Figure 5
Figure 5
MDM2 formed a transcriptional complex by interacting with STAT2 to promote the transcriptional activation of RAGE. (A) Results of screening for MDM2 interacting transcription factors by Venn diagram. (B) Correlation analysis between STAT2 and AGER in the skin was performed using the GEPIA2 web server. (C, D) Relative luciferase activity of a RAGE promoter in HaCaT cells after the indicated treatment by a dual luciferase reporter gene assay. (E) qRT-PCR detection of RAGE mRNA levels in HaCaT cells after the indicated treatment. (F) Western blot representative images and quantitative analysis of MDM2, STAT2, RAGE, and β-actin protein levels in HaCaT cells after the indicated treatment. (G) Co-IP assays in HEK-293T cells after the indicated treatment. All values are presented as the mean ± SD; P-values determined by two-sided Student’s t test. **P < 0.01, compared with the control; ##P < 0.01, compared with oe. MDM2.
Figure 6
Figure 6
PPZn suppressed RAGE expression by inhibiting the transcriptional complex MDM2/STAT2. (A) Molecular docking of MDM2 (blue) and STAT2 (yellow). (B) Biacore analysis of ECH-Zn bonds to MDM2, STAT2, STAT2600–750, and STAT2Δ600–750. (C) Representative images of PLA assays of HaCaT cells with MDM2 and RAGE interaction after the indicated treatment. Scale bar, 5 μm. (D) ECH-Zn cellular uptake was detected using coumarin-6 fluorescent dye. Representative images of IF in HaCaT cells after the indicated treatment. Scale bar, 50 μm. (E) Representative IF images of mouse skin tissue after the indicated treatment. Scale bar, 50 μm. (F) Representative images of IHC of mouse skin tissue after the indicated treatment are shown in a. Meanwhile, the statistical results of the relative IHC staining index are shown in b. Scale bar, 50 μm. All values are presented as the mean ± SD; P-values determined by two-sided Student’s t test. *P < 0.05, **P < 0.01, compared with model.

Similar articles

Cited by

References

    1. González I.; Morales M. A.; Rojas A. Polyphenols and AGEs/RAGE axis. Trends and challenges. Food Research International (Ottawa, Ont.) 2020, 129, 108843.10.1016/j.foodres.2019.108843. - DOI - PubMed
    1. Perrone A.; Giovino A.; Benny J.; Martinelli F. Advanced Glycation End Products (AGEs): Biochemistry, Signaling, Analytical Methods, and Epigenetic Effects. Oxidative medicine and cellular longevity 2020, 2020, 3818196.10.1155/2020/3818196. - DOI - PMC - PubMed
    1. Paul R. G.; Bailey A. J. Glycation of collagen: the basis of its central role in the late complications of ageing and diabetes. international journal of biochemistry & cell biology 1996, 28 (12), 1297–1310. 10.1016/s1357-2725(96)00079-9. - DOI - PubMed
    1. Pageon H.; Zucchi H.; Pennacchi P. C.; Asselineau D.. Glycation and Skin Aging. In Textbook of Aging Skin; Farage M. A.; Miller K. W.; Maibach H. I., Eds.; Springer Berlin Heidelberg, 2017; pp 1247–1270.
    1. Gomes R. A.; Oliveira L. M.; Silva M.; Ascenso C.; Quintas A.; Costa G.; Coelho A. V.; Sousa Silva M.; Ferreira A. E.; Ponces Freire A.; et al. Protein glycation in vivo: functional and structural effects on yeast enolase. Biochemical journal 2008, 416 (3), 317–326. 10.1042/bj20080632. - DOI - PubMed

Publication types

MeSH terms