Review
. 2023 Jun 19:14:1197063.
doi: 10.3389/fendo.2023.1197063. eCollection 2023.

Structural insights into the HNF4 biology

Affiliations
Review

Structural insights into the HNF4 biology

Brice Beinsteiner et al. Front Endocrinol (Lausanne). .

Abstract

Hepatocyte Nuclear Factor 4 (HNF4) is a transcription factor (TF) belonging to the nuclear receptor (NR) family that is expressed in liver, kidney, intestine and pancreas. It is a master regulator of liver-specific gene expression, in particular those genes involved in lipid transport and glucose metabolism and is crucial for the cellular differentiation during development. Dysregulation of HNF4 is linked to human diseases, such as type I diabetes (MODY1) and hemophilia. Here, we review the structures of the isolated HNF4 DNA binding domain (DBD) and ligand binding domain (LBD) and that of the multidomain receptor and compare them with the structures of other NRs. We will further discuss the biology of the HNF4α receptors from a structural perspective, in particular the effect of pathological mutations and of functionally critical post-translational modifications on the structure-function of the receptor.

Keywords: DNA Allostery; HNF4; MODY1; hepatocyte nuclear factor 4; nuclear receptors; protein-DNA complexes; structural biology; transcription.


Conflict of interest statement

The authors declare that the research was conducted in the absence of any commercial or financial relationships that could be construed as a potential conflict of interest.

Figures

Figure 1
Figure 1
(A) Evolutionary history of the major human receptor families with respect to the existence of the π-turn motif in the protein sequence as well as in the protein structure and the corresponding dimerization properties. The NR LBD is illustrated by a rectangle, whose color corresponds to the class marker properties: red (e.g. RXR) when all class I markers are present, green (e.g. HNF4) when class I markers are present, except W109/40 and R321/105, and blue (e.g. NR1/4) when class II markers are present. Numbers in the blue circles correspond to the number of duplication events. The green circle inside the rectangle indicates the presence of high-affinity, specific ligand and the blue cross indicates the presence of less specialized, lower affinity ligand inside the ligand-binding pocket. (B) 3D representation of the π-turn (in red) in the H7 helix of HNF4 (PDB 4IQR). The residues Arg258 (Arg267) and Glu262 (Glu271) form a salt bridge.
Figure 2
Figure 2
Domain structure and ligand binding pocket. (A) One-dimensional representation of the human HNF4α. The DNA binding domain (DBD, or C-domain) is shown in dark blue. The hinge region (D-domain) is shown in magenta. The ligand binding domain (LBD or E-domain) is shown in green. The A/B domain at the N-terminal end is shown in red and the F domain at the very C-terminal end is shown in orange. (B, C) Two- and three-dimensional representations of the ligand environment inside the HNF4α pocket (PDB: 4IQR). The myristic acid ligand is shown in a sphere representation. Amino acid residues that form H-bonds with the ligand are shown in dark blue, the Van des Waals contacts with the ligand are shown in blue. Amino acid residues that form hydrophobic interactions with the ligand are shown in cyan. (D, E) Class I markers on (D) the RXR-RAR LBD heterodimer (PDB code 1DKF) and (E) the HNF4α-HNF4α LBD homodimer (PDB code 4IQR). For all class markers two different ways of numbering residues are used. The first one indicates the residue label according to the original paper, the second one refers to the residue number in the respective PDB file. The labels of class markers mutants Trp40 to Ala in H5 and Arg105 to Gln in H11 are shown in red. The mutation Trp40 to Ala created void volume inside the ligand binding pocket. The residue Arg105 is involved in the dimerization interface and its mutation to Gln is likely to weaken the dimerization strength. The ligands shown with a sphere representation, are shown inside the ligand binding pocket.
Figure 3
Figure 3
Structural analysis of the HNF4α DBD homodimer on a DR1 RE. (A) Superimposition of the homodimer structures of HNF4 DBD (PDB code 3CBB) and RXR DBD (PDB code 6FBQ) bound to their cognate DR1 RE, taking the 5’ subunit as the reference. The two structures adopt the same global topology when bound to their cognate DR1 RE, but show a difference in the positioning of the 3’-DBD subunits. The DBD are represented as ribbon, with the 5’-DBD in orange and white for HNF4 and RXR, respectively and the 3’- DBD in cyan and pink for HNF4 and RXR, respectively. The zinc ions are depicted with spheres with the same color as the respective DBD subunit. The DNA directionality is indicated with 5’ and 3’. (B) Sequence dependent DNA Minor Groove Width values (in Å) calculated with DNAshape (41) for the sequence of HNF4 DBD (3cbb-seq) (PDB code 3CBB) in magenta, compared to the HNF4-specific sequence H4-SBM in green and the consensus DR1 sequence (DR1cons) in light blue. (C) Model of the potential interactions that the HNF4 specific residues Asp69 (Asp78) and Arg76 (Arg85) would make with a C nucleotide at position +4, as present in the HNF4 specific H4-SBM motif. The model is based on the HNF4 DBD structure where the T is mutated to C. The large negative charge on the major groove of G, shown with a transparent blue ellipse, would drive a different conformation of Asp69 (indicated with an arrow), optimal for interactions with G.
Figure 4
Figure 4
Structural analysis of the multidomain HNF4α homodimer on a DR1 RE. (A) Three-dimensional representation of the HNF4α multidomain complex with DR1cons and coactivator peptides (PDB code 4IQR). The DBD is shown in dark blue and the hinge region in magenta. For one of the two monomers the hinge region which is not visible in the electron density (and thus not modelled) is shown with a dotted line. The LBD is shown in green. The A/B domain at the N-terminal end and the F domain at the vey C-terminal end of the receptor are not present in the constructs used for crystallization and their potential location is putatively shown with a double thin dotted red and orange line respectively. The ligand inside the ligand binding pocket of the LBD is displayed as red spheres. (B) Zoom on the DBD part of the superimposition of the homodimer structures of the multidomain HNF4α (PDB code 4IQR) and DBD (PDB code 3CBB) bound to DR1 RE, taking the 5’ subunit as the reference. The proteins are represented as a cartoon representation, with the 5’-subunit in orange and pink for HNF4 in the DBD and in the multidomain structures, respectively and the 3’-subunit in cyan and green for HNF4 in the DBD and in the multidomain structures, respectively. The zinc ions are depicted with spheres with the same color as the respective subunit. The DNA directionality is indicated with 5’ and 3’. (C-F). Two different views of (C, D) the multidomain RXR-RAR heterodimer in complex with a consensus DR1 RE (PDB: 5UAN) and (E, F) the multidomain HNF4α homodimer in complex with a consensus DR1 RE (PDB: 4IQR). The positions of the hinge regions (D domains) are highlighted with thick lines or with dotted circles for hinge regions that were not built, as it is the case for RXR-RAR/DR1 and for one of the HNF4α subunit (not built in the electron density, reflecting disorder and flexibility). The two N- and C-termini of the hinge region of RXR are indicated in dark blue and those of RAR in magenta. For HNF4α, the hinge region that is almost completely built in the electron density is shown in orange. For the other subunit of the HNF4α homodimer, the N- and the C-termini are indicated with a red and with a black dotted ellipse, respectively.
Figure 5
Figure 5
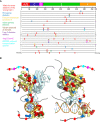
Localization of mutations involved in MODY1 and other diseases. (A) Position of the HNF4α mutations that are linked to established diseases. The 474 amino acid sequence of HNF4α is shown at the top together with the receptor domain representation. The next lines correspond to each of the 20 amino acid residues resulting from a mutation event. Note that this also includes the stop codon occurrence and the residue deletion. The colors of the bars correspond to the diseases indicated on the left. (B) Sphere representation of the HNF4α mutations shown in (A) plotted onto the multidomain HNF4α homodimer structure bound to DR1 RE (PDB: 4IQR). The color code is the same as the one used in (A). If a mutation is involved in several diseases, the mutated residue is shown with the color of the disease that is less frequently encountered. Note that the regions that are not present in the structure (either not considered in the construct, i.e. A/B and F domains, or not modelled, i.e. the hinge regions) are shown as black (dark grey for the second monomer) lines onto which the positions of the mutations are represented as simple colored spheres, with the color according to the affected pathology. Note that one subunit of the HNF4α homodimer is considered for the plotting of the residues, the other one is shown in pale cyan with a tube representation.
Figure 6
Figure 6
Structural analysis of mutations linked to diseases in the receptor and its RE. (A) Mapping of the residues that are mutated in diseases on the DBD-hinge region of the multidomain HNF4α homodimer bound to DR1 RE (PDB: 4IQR). The residues are shown in an all-atom sphere representation and a visual summary along the DBD and hinge region is depicted at the bottom. (B) Mapping of the residues that are mutated in diseases on the LBD region of the multidomain HNF4α homodimer bound to DR1 RE (PDB: 4IQR). The residues are shown in an all-atom sphere representation and a visual summary along the LBD is depicted at the bottom. (C, D) Structural consequence of mutating base pair in the RE of HNF4-responsive gene promoters, shown for (C) the promoter of the factor VII gene where the nucleotide A at position +1 is mutated to C in the disease state and (D) the promoter of the factor IX gene where the nucleotide G at position +5 is mutated to C is found in the disease state.
Figure 7
Figure 7
Post-translational modifications (PTM) of HNF4α. (A) The 474 amino acid sequence of HNF4α is shown at the top together with the receptor domain representation and the position of the residues subjected to the different types of PTMs are shown with colored bars. (B) Sphere representation of the HNF4α PTM shown in (A) plotted onto the multidomain HNF4α homodimer structure bound to DR1 RE (PDB: 4IQR). Light blue spheres indicate residues subjected to phosphorylation, brown spheres to residues subjected to acetylation (and are surrounded by red dotted lines, as the residues are difficult to see), purple spheres to residues subjected to ubiquitination and orange spheres to residues subjected to SUMOylation. Note that the regions that are not present in the structure (either not considered in the construct, i.e. A/B and F domains, or not modelled, i.e. the hinge regions) are shown as black (dark grey for the second monomer) lines onto which the positions of the mutations are represented as simple colored stars, with color according to the type of PTM.

Similar articles

Cited by

References

    1. Sladek FM, Zhong WM, Lai E, Darnell JE. Liver-enriched transcription factor HNF-4 is a novel member of the steroid hormone receptor superfamily. Genes Dev (1990) 4:2353–65. doi: 10.1101/gad.4.12b.2353 - DOI - PubMed
    1. Hwang-Verslues WW, Sladek FM. HNF4α–role in drug metabolism and potential drug target? Curr Opin Pharmacol (2010) 10:698–705. doi: 10.1016/j.coph.2010.08.010 - DOI - PMC - PubMed
    1. Drewes T, Senkel S, Holewa B, Ryffel GU. Human hepatocyte nuclear factor 4 isoforms are encoded by distinct and differentially expressed genes. Mol Cell Biol (1996) 16:925–31. doi: 10.1128/MCB.16.3.925 - DOI - PMC - PubMed
    1. Xanthopoulos KG, Prezioso VR, Chen WS, Sladek FM, Cortese R, Darnell JE. The different tissue transcription patterns of genes for HNF-1, C/EBP, HNF-3, and HNF-4, protein factors that govern liver-specific transcription. Proc Natl Acad Sci (1991) 88:3807–11. doi: 10.1073/pnas.88.9.3807 - DOI - PMC - PubMed
    1. Mietus-Snyder M, Sladek FM, Ginsburg GS, Kuo CF, Ladias JA, Darnell JE, Jr, et al. . Antagonism between apolipoprotein AI regulatory protein 1, Ear3/COUP-TF, and hepatocyte nuclear factor 4 modulates apolipoprotein CIII gene expression in liver and intestinal cells. Mol Cell Biol (1992) 12:1708–18. doi: 10.1128/mcb.12.4.1708-1718.1992 - DOI - PMC - PubMed

Publication types

MeSH terms

Substances