. 2023 Jun 19:17:1180868.
doi: 10.3389/fnins.2023.1180868. eCollection 2023.

Knockout of angiotensin converting enzyme-2 receptor leads to morphological aberrations in rodent olfactory centers and dysfunctions associated with sense of smell

Affiliations

Knockout of angiotensin converting enzyme-2 receptor leads to morphological aberrations in rodent olfactory centers and dysfunctions associated with sense of smell

Sarang Mahajan et al. Front Neurosci. .

Abstract

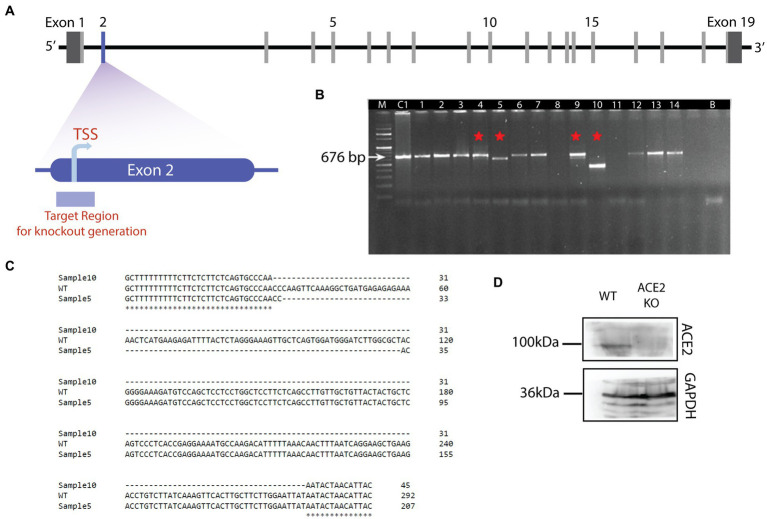
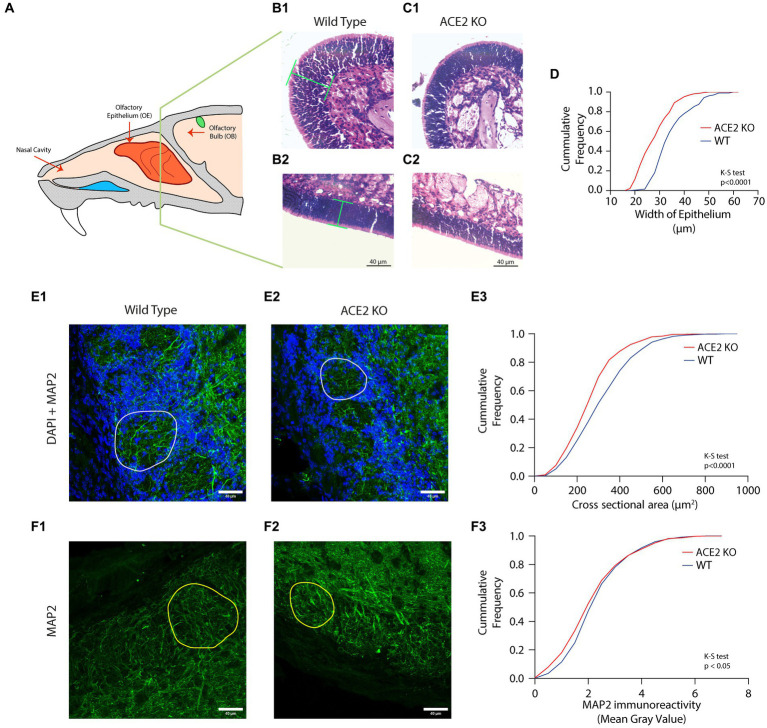
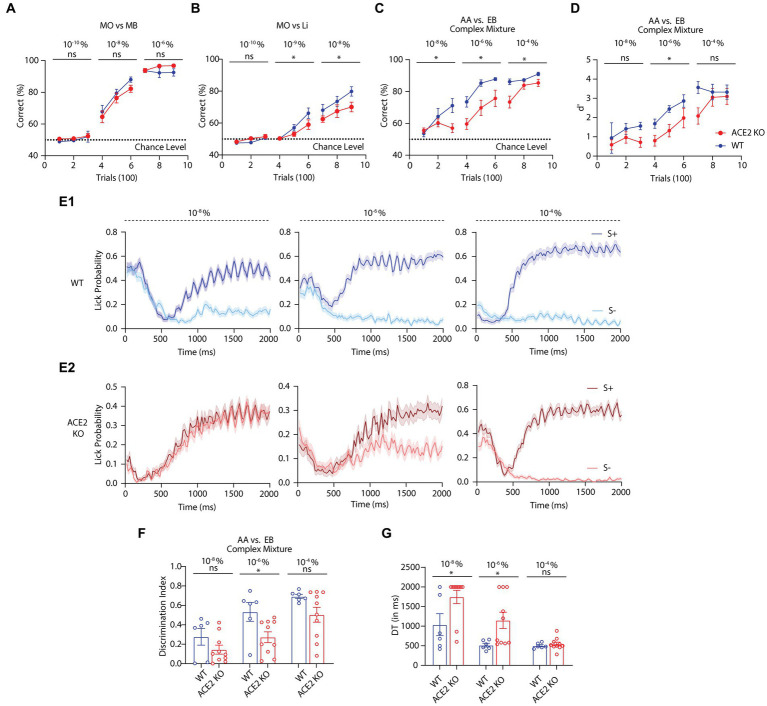
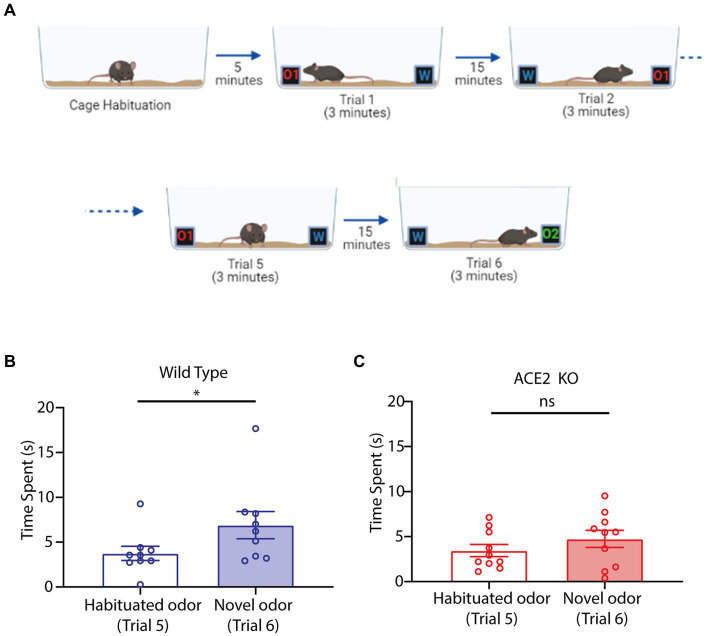
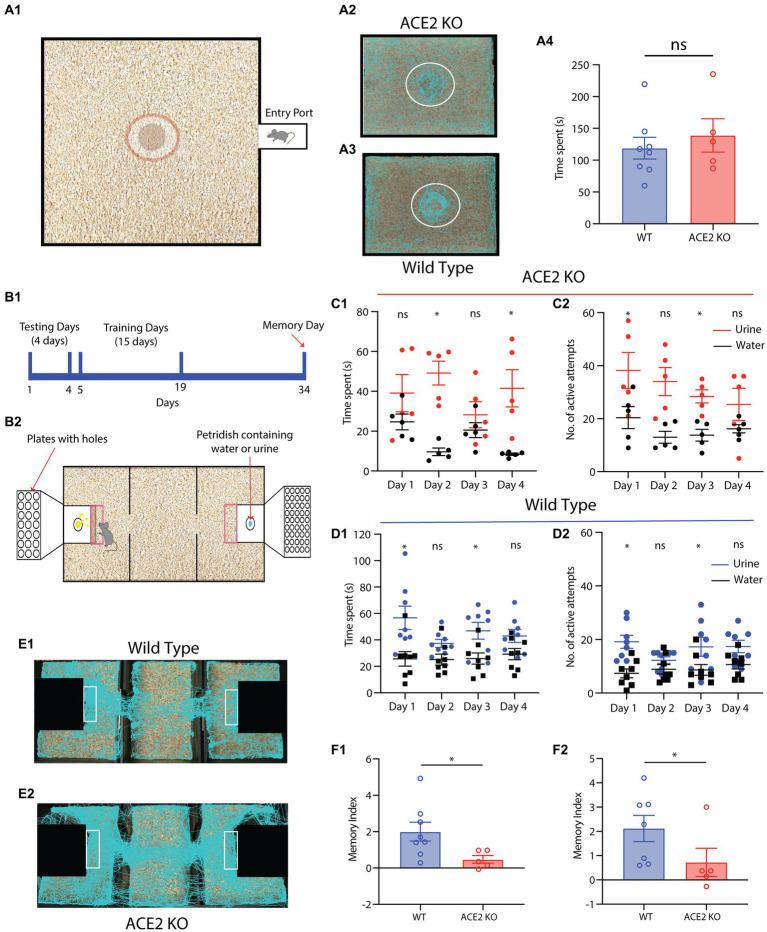
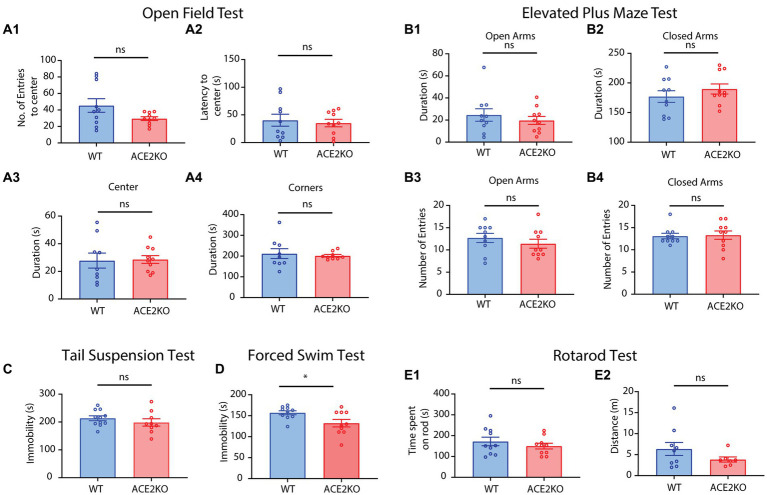
Neuronal morphological characterization and behavioral phenotyping in mouse models help dissecting neural mechanisms of brain disorders. Olfactory dysfunctions and other cognitive problems were widely reported in asymptomatic carriers and symptomatic patients infected with Severe Acute Respiratory Syndrome Coronavirus-2 (SARS-CoV-2). This led us to generate the knockout mouse model for Angiotensin Converting Enzyme-2 (ACE2) receptor, one of the molecular factors mediating SARS-CoV-2 entry to the central nervous system, using CRISPR-Cas9 based genome editing tools. ACE2 receptors and Transmembrane Serine Protease-2 (TMPRSS2) are widely expressed in the supporting (sustentacular) cells of human and rodent olfactory epithelium, however, not in the olfactory sensory neurons (OSNs). Hence, acute inflammation induced changes due to viral infection in the olfactory epithelium may explain transient changes in olfactory detectabilities. As ACE2 receptors are expressed in different olfactory centers and higher brain areas, we studied the morphological changes in the olfactory epithelium (OE) and olfactory bulb (OB) of ACE2 KO mice in comparison with wild type animals. Our results showed reduced thickness of OSN layer in the OE, and a decrease in cross-sectional area of glomeruli in the OB. Aberrations in the olfactory circuits were revealed by lowered immunoreactivity toward microtubule associated protein 2 (MAP2) in the glomerular layer of ACE2 KO mice. Further, to understand if these morphological alterations lead to compromised sensory and cognitive abilities, we performed an array of behavioral assays probing their olfactory subsystems' performances. ACE2 KO mice exhibited slower learning of odor discriminations at the threshold levels and novel odor identification impairments. Further, ACE2 KO mice failed to memorize the pheromonal locations while trained on a multimodal task implying the aberrations of neural circuits involved in higher cognitive functions. Our results thus provide the morphological basis for the sensory and cognitive disabilities caused by the deletion of ACE2 receptors and offer a potential experimental approach to study the neural circuit mechanisms of cognitive impairments observed in long COVID.

Keywords: ACE2 receptor; CRISPR-Cas9; gene knockout; olfactory system; sensory and cognitive deficits.


Conflict of interest statement

The authors declare that the research was conducted in the absence of any commercial or financial relationships that could be construed as a potential conflict of interest.

Figures

Figure 1
Figure 1
Generation of ACE2 knockout mouse model. (A) Schematic of the genetic structure of the ACE2 gene. ACE2 gene harbors 19 exons with the translation start site (TSS) in the exon 2. TSS is the target region to create the knockout using CRISPR-Cas9 mediated genome editing. (B) Agarose gel electrophoresis image of DNA samples isolated from the potential ACE2 KO animals. Sample C is the control (C57BL/6 J) genomic DNA (676 bp), Sample B is used as a negative control without any genomic DNA, and samples 1 to 14 are DNAs with genome editing. Samples 4, 5, 9, and 10 revealed the deletions and are depicted by red asterisk on the gel. Sample 10 showed the maximum deletion, hence selected for further breeding. (C) Sequence alignment showing deletions in samples 5 and 10. For the sample 5, 84 bp deletion was observed, whereas for sample 10, a 246 bp deletion occurred in the target region. These results confirmed the deletion of the ACE2 receptor gene in sample 10. (D) Western blot showing the expression of ACE2 protein in the brain of ACE2 KO and WT animals. The band corresponding to ACE2 protein was observed for WT animals, whereas in ACE2 KO animals, ACE2 expression was undetectable. Band corresponding to GAPDH protein is observed in brain lysates from both animals.
Figure 2
Figure 2
Morphological aberrations in the olfactory epithelium (OE) and olfactory bulb (OB) of ACE2 KO animals. (A) Schematic representation of the mouse olfactory system. The olfactory epithelium (OE) is present in the posterior region of the nasal cavity and harbors olfactory sensory neurons (OSNs). These OSNs express odor receptors. The signal from the OSNs is then transduced to the olfactory bulb (OB). (B,C) Representative images of different regions of OE stained with Hematoxylin and Eosin for WT (B1,B2) and ACE2 KO (C1,C2) animals, respectively. Green lines in the panel B1 and B2 represent the width of the epithelium. (D) Cumulative frequency distribution of epithelium width for ACE2 KO and WT animals. The width of epithelium for WT was 35.39 ± 0.5294 μm, ACE2 KO: 28.67 ± 0.4408, K-S test, p < 0.0001, number of animals: nWT = 4 and nACE2 KO = 4, number of region of interests (ROI): WT = 211, ACE2 KO = 232. (E) Representative images of the glomerular layer of the OB stained with DAPI and MAP2 from WT (E1) and ACE2 KO animals (E2). DAPI is visualized with blue color, whereas MAP2 is visualized with green color. (E3) Cumulative frequency distributions of cross-sectional area of the glomeruli pooled for WT and ACE2 KO animals. The cross-sectional area for WT was 335.6 ± 6.444 μm2, for ACE2 KO was 283.1± 5.191 μm2 (K-S test, p < 0.0001, number of animals: nWT = 3 and nACE2 KO = 3, number of glomeruli: WT = 496, ACE2 KO = 558). (F) Representative images of the glomerular layer of the OB stained with MAP2 (green color) for WT (F1) and ACE2 KO animals (F2). Yellow colored circles in the images represent individual glomeruli. (F3) Cumulative frequency distributions of MAP2 immunoreactivity measured using mean intensity for WT and ACE2 KO animals. The MAP2 immunoreactivity for WT was 2.490 ± 0.0499, for ACE2 KO was 2.357 ± 0.0517 (K-S test, p = 0.0349, number of animals: nWT = 3 and nACE2 KO = 3, number of glomeruli: WT = 496, ACE2 KO = 558).
Figure 3
Figure 3
Odor detection and discrimination characteristics of WT and ACE2 animals. (A) Accuracy of performance shown by learning curves for WT and ACE2 KO animals when trained to discriminate mineral oil (MO) vs. Methyl Benzoate (MB) at different concentrations (10−10%, 10−8%, and 10−6%). Comparisons of learning curves: Two-Way ANOVA. For, 10−10%: [F(1,45) = 0.8053, p = 0.3743], 10−8%: [F(1,45) = 2.495, p = 0.1212], and 10−6%: [F(1,45) = 4.236, p = 0.0554], number of animals: nACE2KO = 10, nWT = 7. (B) Learning curves of WT and ACE2 KO animals for mineral oil (MO) vs. Limonene (+) (Li) at different concentrations (10−10%, 10−9%, and 10−8%). Comparisons of learning curves: Two-Way ANOVA. For, 10−10%: [F(1,66) = 3.451, p = 0.0677], 10−9%: [F(1,63) = 4.435, p = 0.0392], and 10−8%: [F(1,63) = 7.574, p = 0.0077], number of animals: nACE2KO = 11, nWT = 13. (C) Learning curves of WT and ACE2 KO for a complex odor discrimination task [60% Amyl acetate (AA) + 40% Ethyl Butyrate (EB) vs. 60% EB + 40% AA, at different concentrations (10−8%, 10−6%, and 10−4%)]. Comparisons of learning curves: Two-Way ANOVA. For, 10−8%: [F(1,42) = 4.605, p = 0.0377], 10−6%: [F(1, 42) 15.09, p = 0.0004], and 10−4%: [F(1, 42) = 10.09, p = 0.0028], number of animals: nACE2KO = 10, nWT = 6. (D) d’ (d prime) of WT and ACE2 KO animals measured during a complex odor discrimination task, same as panel C, at different concentrations (10−8%, 10−6%, and 10−4%). d’ were compared between WT and ACE2 KO animals using Two-Way ANOVA. For, 10−8%: [F(1,42) = 3.360, p = 0.0739], 10−6%: [F(1,42) = 9.663, p = 0.0034], and 10−4%: [F (1, 42) = 3.277, p = 0.0774], number of animals: nACE2KO = 10, nWT = 6. (E) Lick patterns of WT (E1) and ACE2 KO (E2) animals for different concentrations during the complex odor discrimination used in panel C and D. Y-axis represents the lick probability as a function of time (X-axis). (F) Discrimination index calculated using the lick probabilities at different concentrations. Comparison using two-tailed unpaired t-test: For, 10−8%: p = 0.1585, 10−6%: p = 0.0235, and 10−4%: p = 0.5276. Number of animals: nACE2KO = 10, nWT = 6. (A) Comparison of discrimination times (DT) shown by WT and ACE2 KO animals for different concentrations, using two-tailed unpaired t-test: For, 10−8%: p = 0.0369, 10−6%: p = 0.0367, and 10−4%: p = 0.0858. Number of animals: nACE2KO = 10, nWT = 6. In the figure * indicates p < 0.05, ns indicates: non-significant.
Figure 4
Figure 4
Novel odor discrimination is impaired in ACE2 KO animals. (A) Schematic of the novel discrimination task. The task begins with animals getting habituated with the cage followed by 5 trials of odor habituation wherein at one end an odorant (O1) was provided whereas on the other end there was water (W). For each trial the cage was rotated by 180° to mitigate any non-specific preference. Following habituation, the odor O1 was replaced by a novel odor (O2) and time spent by animals near the novel odor (Trial 6) vs. habituated odor (Trial 5) was used to assess the novel odor discrimination ability. (B) Comparison of time spent by WT animals during the task near the habituated and the novel odor. Time spent by animals near habituated odor (3.753 ± 0.7959 s) was significantly lower than that for novel odor (6.908 ± 1.514 s), one-tailed paired t-test, p = 0.0132, n = 9. (C) Comparison of time spent by ACE2 KO animals during the task near the habituated and the novel odor. Time spent by animals near habituated odor (3.449 ± 0.6708 s) and novel odor (4.743 ± 0.9469 s) was similar, one-tailed paired t-test, p = 0.0965, n = 10.
Figure 5
Figure 5
ACE2 KO animals show impaired memory in a multimodal pheromone learning task. (A) Pheromone detection abilities of ACE2 KO animals are similar to that of the WT animals. (A1) Diagrammatic representation of the setup used for pheromonal detection assay. The dimensions of the setup are 60 cm x 45 cm. A petri dish containing male soiled bedding and urine was placed at the center of the arena and females were introduced in this arena. The animals were tracked using EthoVision software while their motions were captured on camera. The time spent by females near to the petri dish was measured in order to gage their pheromonal detection abilities. (A2,A3) Representative tracks taken by ACE2 KO and WT animals during the pheromone detection task, respectively. (A4) The pheromonal detection abilities of both groups of the animals was similar (WT: 118.8 ± 17.06 s, ACE2 KO: 138.8 ± 26.19 s, two-tailed unpaired t-test, p = 0.5143, nACE2KO = 5, nWT = 8). (B) (B1) Timeline of multimodal pheromone location learning task. Animals undergo testing for first 4 days, followed by 15 days training. Fifteen days post completion of the training, the memory of the animals was assessed. (B2) Illustration of the setup used for training the animals to associate the urine smell and neutral stimuli with specific orifice diameters. (C,D) Sampling parameters of ACE2 KO and Wildtype (WT) animals during first 4 days of testing, respectively. (C1) Time spent by ACE2 KO females near the water and urine zone during the testing days (two-way ANOVA with Bonferroni’s multiple comparison test, * represents p < 0.05 and ns represents p > 0.05). (C2) Number of active attempts by ACE2 KO females near the water and urine zone during the testing days (two-way ANOVA with Bonferroni’s multiple comparison test, * represents p < 0.05 and ns represents p > 0.05, nACE2KO = 5). (D) (D1) Time spent by WT females near the water and urine zone during the testing days (two-way ANOVA with Bonferroni’s multiple comparison test, * represents p < 0.05 and ns represents p > 0.05). (D2) Number of active attempts by WT females near the water and urine zone during the testing days (two-way ANOVA with Bonferroni’s multiple comparison test, * represents p < 0.05 and ns represents p > 0.05, nWT = 8). (E) (E1,E2) Representative tracks during the memory day for WT and ACE2 KO animals, respectively. (F) Comparison of Memory index between ACE2 KO and WT animals calculated using time spent and the number of active attempts. (F1) ACE2 KO females showed impaired memory (index calculated using time spent) compared to the WT animals (WT: 2.002 ± 0.5185, ACE2 KO: 0.4774 ± 0.2123, two-tailed unpaired t-test, p = 0.0483). (F2) ACE2 KO females showed impaired memory (index calculated using number of active attempts) compared to the WT animals (2.118 ± 0.54, ACE2 KO: 0.7249 ± 0.5810, two-tailed Mann–Whitney test (non-normal distribution), p = 0.0186, nACE2KO = 5, nWT = 7–8).
Figure 6
Figure 6
ACE2 KO and WT animals showed no differences in mood disorder-related behaviors. (A) Comparison of different parameters between ACE2 KO and WT animals for an open field test (OFT). (A1) Number of entries to the center between WT (45.40 ± 8.224) and ACE2 KO (29.50 ± 2.296) animals was similar (two-tailed unpaired t-test, p = 0.0790). (A2) Latency to the center between WT (40.34 ± 10.83 s) and ACE2 KO (35.17 ± 6.170) animals was similar (two-tailed unpaired t-test, p = 0.6895). (A3) Time spent in the center between WT (27.81 ± 5.448 s) and ACE2 KO (28.60 ± 2.825) animals was similar (two-tailed unpaired t-test, p = 0.8953). (A4) Time spent in the corners between WT (212.0 ± 23.80 s) and ACE2 KO (201.5 ± 6.158 s) animals was similar (two-tailed unpaired t-test, p = 0.6774). Number of animals: nACE2KO = 10, nWT = 9–10. (B) Comparison of different parameters between ACE2 KO and WT animals for an elevated plus maze test (EPM). (B1) Time spent in open arms between WT (24.56 ± 5.666 s) and ACE2 KO (19.65 ± 3.615) animals was similar (two-tailed unpaired t-test, p = 0.4747). (B2) Time spent in open arms between WT (177.1 ± 9.792 s) and ACE2 KO (189.8 ± 8.491) animals was similar (two-tailed unpaired t-test, p = 0.3403). (B3) Number of entries in open arms between WT (12.70 ± 1.023) and ACE2 KO (11.40 ± 1.013) animals was similar (two-tailed unpaired t-test, p = 0.3784). (B4) Number of entries in open arms between WT (13.10 ± 0.6227) and ACE2 KO (13.30 ± 0.9434) animals was similar (two-tailed unpaired t-test, p = 0.8615). Number of animals: nACE2KO = 10, nWT = 10. (C) Comparison of time immobile by ACE2 KO and WT animals for tail suspension test (TST). There was no significant difference in the time spent immobile between the groups (WT: 213.5 ± 8.628 s, ACE2 KO: 198.4 ± 13.30 s, two-tailed unpaired t-test, p = 0.3374, number of animals: nACE2KO = 9, nWT = 11). (D) Comparison of time spent immobile by ACE2 KO and WT animals for forced swim test (FST). Time immobile by the ACE2 KO animals was significantly higher than that by the WT WT: 0.157.0 ± 4.798 s, ACE2 KO: 132.3 ± 9.017 s, two-tailed unpaired t-test, p = 0.0264, number of animals: nACE2KO = 10, nWT = 10. (E) Comparison of different parameters between ACE2 KO and WT animals for rotarod test. (E1) There was no significant difference in the time spent on the rod between the groups (WT: 172.2 ± 20.61 s, ACE2 KO: 149.9 ± 13.55 s, two-tailed unpaired t-test, p = 0.3762). (E2) There was no significant difference in the total distance covered between the groups (WT: 6.356 ± 1.544 m, ACE2 KO: 3.836 ± 0.6166 m, two-tailed unpaired t-test, p = 0.1935).

Similar articles

Cited by

References

    1. Abraham N. M., Egger V., Shimshek D. R., Renden R., Fukunaga I., Sprengel R., et al. . (2010). Synaptic inhibition in the olfactory bulb accelerates odor discrimination in mice. Neuron 65, 399–411. doi: 10.1016/j.neuron.2010.01.009, PMID: - DOI - PMC - PubMed
    1. Abraham N. M., Spors H., Carleton A., Margrie T. W., Kuner T., Schaefer A. T. (2004). Maintaining accuracy at the expense of speed: stimulus similarity defines odor discrimination time in mice. Neuron 44, 865–876. doi: 10.1016/j.neuron.2004.11.017, PMID: - DOI - PubMed
    1. Abraham N. M., Vincis R., Lagier S., Rodriguez I., Carleton A. (2014). Long term functional plasticity of sensory inputs mediated by olfactory learning. Elife 3:e02109. doi: 10.7554/eLife.02109, PMID: - DOI - PMC - PubMed
    1. Alenina N., Bader M. (2019). ACE2 in brain physiology and pathophysiology: evidence from transgenic animal models. Neurochem. Res. 44, 1323–1329. doi: 10.1007/s11064-018-2679-4, PMID: - DOI - PMC - PubMed
    1. Barresi M., Ciurleo R., Giacoppo S., Foti Cuzzola V., Celi D., Bramanti P., et al. . (2012). Evaluation of olfactory dysfunction in neurodegenerative diseases. J. Neurol. Sci. 323, 16–24. doi: 10.1016/j.jns.2012.08.028 - DOI - PubMed