. 2023 Jun 19:13:1202585.
doi: 10.3389/fonc.2023.1202585. eCollection 2023.

Lestaurtinib inhibits Citron kinase activity and medulloblastoma growth through induction of DNA damage, apoptosis and cytokinesis failure

Affiliations

Lestaurtinib inhibits Citron kinase activity and medulloblastoma growth through induction of DNA damage, apoptosis and cytokinesis failure

Gianmarco Pallavicini et al. Front Oncol. .

Abstract

Introduction: Medulloblastoma (MB), the most common malignant pediatric brain tumor, is currently treated with surgery followed by radiation and chemotherapy, which is accompanied by severe side effects, raising the need for innovative therapies. Disruption of the microcephaly-related gene Citron kinase (CITK) impairs the expansion of xenograft models as well as spontaneous MB arising in transgenic mice. No specific CITK inhibitors are available.

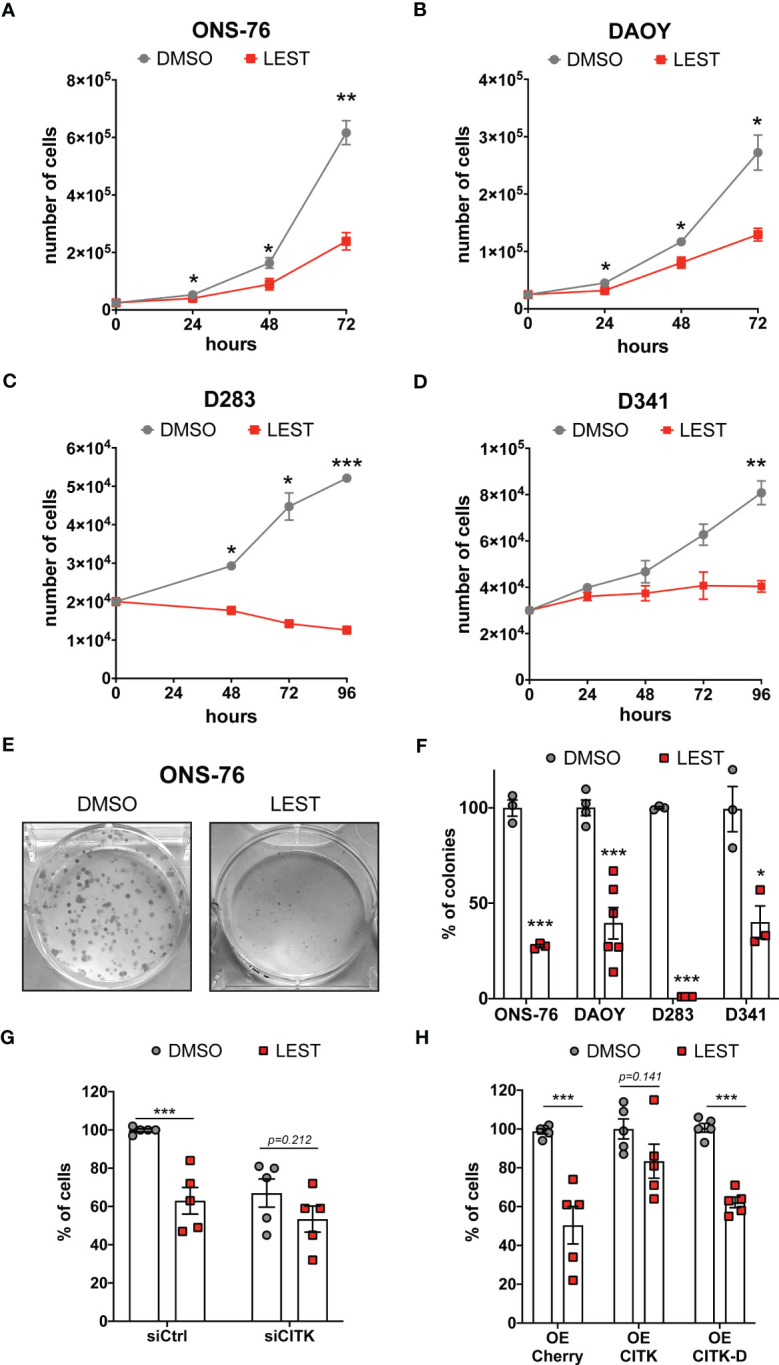
Methods: Lestaurtinib, a Staurosporine derivative also known as CEP-701, inhibits CITK with IC50 of 90 nM. We therefore tested the biological effects of this molecule on different MB cell lines, as well as in vivo, injecting the drug in MBs arising in SmoA1 transgenic mice.

Results: Similar to CITK knockdown, treatment of MB cells with 100 nM Lestaurtinib reduces phospho-INCENP levels at the midbody and leads to late cytokinesis failure. Moreover, Lestaurtinib impairs cell proliferation through CITK-sensitive mechanisms. These phenotypes are accompanied by accumulation of DNA double strand breaks, cell cycle block and TP53 superfamily activation in vitro and in vivo. Lestaurtinib treatment reduces tumor growth and increases mice survival.

Discussion: Our data indicate that Lestaurtinib produces in MB cells poly-pharmacological effects extending beyond the inhibition of its validated targets, supporting the possibility of repositioning this drug for MB treatment.

Keywords: CitK; Lestaurtinib; drug repurposing; medulloblastoma; preclinical studies.


Conflict of interest statement

The authors declare that the research was conducted in the absence of any commercial or financial relationships that could be construed as a potential conflict of interest.

Figures

Figure 1
Figure 1
Lestaurtinib inhibits Citron Kinase catalytic activity and induces cytokinesis failure. (A) Quantification of ATP consumption was measured with ADP-Glo™ Kinase Assay, by incubating CIT kinase domain with recombinant human MYPT1 (see methods) and the indicated concentrations of Lestaurtinib. (B) CITK domain was incubated with MYPT1 in the presence of [γ-32P] ATP. The reactions were then analyzed by SDS-PAGE and autoradiography. p-CITK arrow indicates auto-phosphorylation, p-MYPT1 arrow the substrate phosphorylation. (C-F) Analysis of high magnification images of midbodies, in ONS-76 cells treated for 24 hours with DMSO or 100 nM Lestaurtinib (LEST) and immunostained for INCENP (C), phospho(p)-INCENP (E), as well as α-tubulin. Midbody intensity of INCENP and p-INCENP was quantified (D and F, respectively). Scale bars: 5 μm. (G) Representative IF image of ONS-76 cells analyzed 24 hours after treatment with DMSO or 100 nM Lestaurtinib and immunostained for α-tubulin. White arrow indicates a typical binucleated cells. Scale bars: 20 μm (H) Quantification of binucleated cells in ONS-76, DAOY, D283 and D341 treated as in (G) Each dot indicates an independent biological replicate. >200 cells were counted for each treatment conditions in each experiment. All quantifications were based on at least three independent biological replicates. *P<0.05, **P<0.01 ***P<0.01; unpaired two-tailed Student’s t-test. A.U., arbitrary units.
Figure 2
Figure 2
Lestaurtinib reduces MB cells proliferation and impairs the clonogenic potential (A-D) Cell proliferation assay: 25,000 ONS-76 (A) and DAOY cells (B) 20,000 D283 cells (C) and 30,000 D341 cells (D) were treated with DMSO or 100 nM Lestaurtinib. Growth curves were obtained by assessing cells’ number in each well at the indicated times after treatment. (E) Images of ONS-76 colonies 10 days after treatment with DMSO or 100 nM Lestaurtinib and stained with crystal violet. (F) Quantification of the percentage of colonies formed after DMSO or 100 nM Lestaurtinib treatment; each dot indicates an independent biological replicate. (G) Quantification of ONS-76 cell number 48 hours after transfection of non-targeting (siCtrl) or CITK-specific siRNA (siCITK), treated with DMSO or 100nM of Lestaurtinib during the last 24 hours of the experiment. Each dot indicates the percentage of the corresponding negative control. (H) Quantification of ONS-76 cells number 48 hours after transfection of Cherry (control), wild type Cherry-tagged CITK (CITK) and K126A inactive mutant (CITK-D), treated with DMSO or 100nM of Lestaurtinib during the last 24 hours of the experiment. As above, numbers are expressed as percentage of control, in independent biological replicates. All quantifications were based on at least three independent biological replicates. Error bars, SEM. *P<0.05, **P<0.01 ***P<0.01; unpaired two-tailed Student’s t-test.
Figure 3
Figure 3
Lestaurtinib induces cell cycle block and apoptosis. (A) Exemplar cell-cycle profile of ONS-76 cells treated for 24 hours with DMSO or 100 nM Lestaurtinib. G0/G1, S and G2-M phases are shown. (B) Quantification of the percentage of ONS-76 and DAOY treated cells in the different cell-cycle phases; p=0,019 for ONS-76, p=0,04 for DAOY, Chi-Square test. (C, D) Quantification of Annexin V positive ONS-76 and DAOY cells, 24 hours after treatment with DMSO or 100 nM Lestaurtinib. (E) Western blot analysis of total lysate from ONS-76 cells and DAOY cells, 24 hours after treatment with DMSO or 100 nM Lestaurtinib. The levels of phospho-TP53, TP73, P21 as well as cleaved caspase 3 (cCASP3) were analyzed (loading control vinculin, VINC). (F, G) Quantification of the relative density of P21 (F), and cCASP3 (G) in 4 replicates of the experiments shown in (E) Values are expressed as a ratio over the DMSO control average (H) Representative image of ONS-76 cells processed for immunofluorescence 24 hours after treatment with DMSO or 100 nM Lestaurtinib and immunostained for cleaved caspase 3 (cCASP3) and α-tubulin. Scale bars: 5 μm. (I) Quantification of the percentage of cCASP3 positive cells in the indicated cell lines, 24 hours after treatment with DMSO or 100 nM Lestaurtinib. All quantifications were based on at least three independent biological replicates. Error bars, SEM. *P<0.05, **P<0.01 ***P<0.01; unpaired two-tailed Student’s t-test. Scale bars: 5 μm. A.U., arbitrary units.
Figure 4
Figure 4
Lestaurtinib induces DNA damage accumulation in MB cells. (A) Representative image of ONS-76 cells immunostained for 53BP1 24 hours after treatment with DMSO or 100 nM Lestaurtinib. Scale bars, 10 μm. (B) Quantification and 53BP1 nuclear foci in the indicated cell lines, treated as in (A); >250 cells were counted for each treatment conditions in each replicate. (C) Western blot analysis of total lysate from the indicated cell lines, 24 hours after treatment with DMSO or 100 nM Lestaurtinib. The levels of RAD51 and γH2AX were analyzed and the internal loading control was vinculin (VINC). (D, E) Quantification of the relative density of RAD51 (D) and γH2AX (E) in the indicated cell lines. All quantifications were based on at least three independent biological replicates. Error bars, SEM. *P<0.05, **P<0.01 ***P<0.01; unpaired two-tailed Student’s t-test for blots, Mann–Whitney U test for 53BP1 foci.
Figure 5
Figure 5
Lestaurtinib induces apoptosis and DNA damage accumulation in vivo. (A) Hematoxylin and eosin (H&E) staining of paraffin sections, obtained from MBs that developed in SmoA1 mice, treated with stereotaxic injection of 1μl DMSO or 1μl 100 nM Lestaurtinib (in PBS) for 24 hours. Yellow arrows indicate pyknotic nuclei. Scale bars: 20 μm. (B) Percentage of pyknotic nuclei in sections obtained as described in panel (A) Each dot indicates a treated animal. (C) Frozen sections from tumors obtained as in panel A were labeled by anti-caspase 3 (cCASP3) fluorescent immunostaining and TUNEL assay (red), counterstaining with DAPI. Scale bars: 50 μm. (D) Quantification of positive cells for mm2 of cCASP3- and TUNEL-positive cells in frozen sections treated as described in panel (C) Each dot indicates a treated animal. (E, F) Western blot analysis of total cell lysates obtained from tumors obtained as described in (A) The levels of cleaved caspase 3 (cCASP3) and γH2AX were analyzed and the internal loading control was GAPDH. Average relative density of cCASP3 and γH2AX in DMSO or Lestaurtinib treated mice (N=6) is reported in panel (E) Error bars, SEM. *P<0.05, **P<0.01; unpaired two-tailed Student’s t-test. A.U., arbitrary units.
Figure 6
Figure 6
Lestaurtinib inhibits medulloblastoma progression in SmoA1 mice (A) Representative T2 weighted MRI-based follow up (from tumor detection, week 0, to last time point monitored, week 7) of mice treated for 4 consecutive weeks with intrathecal injection of DMSO or Lestaurtinib 100nM. Pseudocolorized images are displayed; yellow lines outline the tumor area in MRI sections. (B) Quantitative analysis of tumor growth in follow up experiment performed as described in (A) Tumor volumes were reconstructed, summing up the corresponding voxels in each section (N = 6). Error bars, SEM. ***P<0.01; different between linear regression of each growth curve. The black arrows indicate Lestaurtinib administration. (C), Kaplan–Meier survival curves of control and mice treated for 4 weeks with Lestaurtinib at 10 weeks of age (N = 19 DMSO, 12 Lest). Log-rank (Mantel–Cox) test was used to compare survival between experimental groups (*P<0,05). The black arrows indicate Lestaurtinib administration.

Similar articles

Cited by

References

    1. Triscott J, Lee C, Foster C, Manoranjan B, Pambid MR, Berns R, et al. . Personalizing the treatment of pediatric medulloblastoma: polo-like kinase 1 as a molecular target in high-risk children. Cancer Res (2013) 73(22):6734–44. doi: 10.1158/0008-5472.CAN-12-4331 - DOI - PubMed
    1. Pollack IF, Agnihotri S, Broniscer A. Childhood brain tumors: current management, biological insights, and future directions. J Neurosurg Pediatr (2019) 23(3):261–73. doi: 10.3171/2018.10.PEDS18377 - DOI - PMC - PubMed
    1. Kool M, Korshunov A, Remke M, Jones DTW, Schlanstein M, Northcott PA, et al. . Molecular subgroups of medulloblastoma: an international meta-analysis of transcriptome, genetic aberrations, and clinical data of WNT, SHH, group 3, and group 4 medulloblastomas. Acta Neuropathol (2012) 123(4):473–84. doi: 10.1007/s00401-012-0958-8 - DOI - PMC - PubMed
    1. Northcott PA, Shih DJH, Peacock J, Garzia L, Morrissy AS, Zichner T, et al. . Subgroup-specific structural variation across 1,000 medulloblastoma genomes. Nature (2012) 488(7409):49–56. doi: 10.1038/nature11327 - DOI - PMC - PubMed
    1. Taylor MD, Northcott PA, Korshunov A, Remke M, Cho Y-J, Clifford SC, et al. . Molecular subgroups of medulloblastoma: the current consensus. Acta Neuropathol (2012) 123(4):465–72. doi: 10.1007/s00401-011-0922-z - DOI - PMC - PubMed