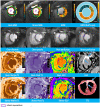
Detection of Myocardial Ischemia Using Cardiovascular MRI Stress T1 Mapping: A Miniature-Swine Validation Study
- PMID: 37404782
- PMCID: PMC10316297
- DOI: 10.1148/ryct.220092
Detection of Myocardial Ischemia Using Cardiovascular MRI Stress T1 Mapping: A Miniature-Swine Validation Study
Abstract
Purpose: To assess the efficacy of cardiac MRI stress T1 mapping in detecting ischemic and infarcted myocardium in a miniature-swine model, using pathologic findings as the reference standard.
Materials and methods: Ten adult male Chinese miniature swine, with coronary artery stenosis induced by an ameroid constrictor, and two healthy control swine were studied. Cardiac 3-T MRI rest and adenosine triphosphate stress T1 mapping and perfusion images, along with resting and late gadolinium enhancement images, were acquired at baseline and weekly up to 4 weeks after surgery or until humanely killed. A receiver operating characteristic analysis was used to analyze the performance of T1 mapping in the detection of myocardial ischemia.
Results: In the experimental group, both the infarcted myocardium (ΔT1 = 10 msec ± 2 [SD]; ΔT1 percentage = 0.7% ± 0.1) and ischemic myocardium (ΔT1 = 10 msec ± 2; ΔT1 percentage = 0.9% ± 0.2) exhibited reduced T1 reactivity compared with the remote myocardium (ΔT1 = 53 msec ± 7; ΔT1 percentage = 4.7% ± 0.6) and normal myocardium (ΔT1 = 56 msec ± 11; ΔT1 percentage = 4.9% ± 1.1). Receiver operating characteristic analysis demonstrated high diagnostic performance of ΔT1 in detecting ischemic myocardium, with an area under the curve (AUC) of 0.84 (P < .001). Rest T1 displayed high diagnostic performance in detecting infarcted myocardium (AUC = 0.95; P < .001). When rest T1 and ΔT1 were combined, the diagnostic performance for both ischemic and infarcted myocardium were improved (AUCs, 0.89 and 0.97, respectively; all P < .001). The collagen volume fraction correlated with ΔT1, ΔT1 percentage, and Δ extracellular volume percentage (r = -0.70, -0.70, and -0.50, respectively; P = .001, .001, and .03, respectively).
Conclusion: Using histopathologic validation in a swine model, noninvasive cardiac MRI stress T1 mapping demonstrated high performance in detecting ischemic and infarcted myocardium without the need for contrast agents.Keywords: Coronary Artery Disease, MRI, Myocardial Ischemia, Rest T1 Mapping, Stress T1 Mapping, Swine Model Supplemental material is available for this article. © RSNA, 2023See also commentary by Burrage and Ferreira in this issue.
Keywords: Coronary Artery Disease; MRI; Myocardial Ischemia; Rest T1 Mapping; Stress T1 Mapping; Swine Model.
© 2023 by the Radiological Society of North America, Inc.
Conflict of interest statement
Disclosures of conflicts of interest: B.Z. No relevant relationships. C.C. No relevant relationships. J.H. No relevant relationships. J.X. No relevant relationships. G.Y. No relevant relationships. X.D. No relevant relationships. G.Y. No relevant relationships. H.W. No relevant relationships. X.W. No relevant relationships. A.S. No relevant relationships. S.Z. No relevant relationships. M.L. No relevant relationships.
Figures


Similar articles
-
Gadolinium-Free Cardiac MR Stress T1-Mapping to Distinguish Epicardial From Microvascular Coronary Disease.J Am Coll Cardiol. 2018 Mar 6;71(9):957-968. doi: 10.1016/j.jacc.2017.11.071. J Am Coll Cardiol. 2018. Retraction in: J Am Coll Cardiol. 2020 Oct 20;76(16):1915. doi: 10.1016/j.jacc.2020.08.038. PMID: 29495995 Free PMC article. Retracted.
-
Cardiovascular magnetic resonance stress and rest T1-mapping using regadenoson for detection of ischemic heart disease compared to healthy controls.Int J Cardiol. 2021 Jun 15;333:239-245. doi: 10.1016/j.ijcard.2021.03.010. Epub 2021 Mar 9. Int J Cardiol. 2021. PMID: 33705843 Free PMC article.
-
Adenosine Stress and Rest T1 Mapping Can Differentiate Between Ischemic, Infarcted, Remote, and Normal Myocardium Without the Need for Gadolinium Contrast Agents.JACC Cardiovasc Imaging. 2016 Jan;9(1):27-36. doi: 10.1016/j.jcmg.2015.08.018. Epub 2015 Dec 9. JACC Cardiovasc Imaging. 2016. PMID: 26684978 Free PMC article.
-
T1 reactivity as an imaging biomarker in myocardial tissue characterization discriminating normal, ischemic and infarcted myocardium.Int J Cardiovasc Imaging. 2019 Jul;35(7):1319-1325. doi: 10.1007/s10554-019-01554-4. Epub 2019 May 15. Int J Cardiovasc Imaging. 2019. PMID: 31093894 Free PMC article.
-
Magnetic resonance imaging and multi-detector computed tomography assessment of extracellular compartment in ischemic and non-ischemic myocardial pathologies.World J Cardiol. 2014 Nov 26;6(11):1192-208. doi: 10.4330/wjc.v6.i11.1192. World J Cardiol. 2014. PMID: 25429331 Free PMC article. Review.
Cited by
-
Stress T1 Mapping in Hypertrophic Cardiomyopathy: Investigating Adenosine Administration Time for Adequate Vasodilation.J Korean Soc Radiol. 2025 May;86(3):381-388. doi: 10.3348/jksr.2025.0017. Epub 2025 May 28. J Korean Soc Radiol. 2025. PMID: 40502466 Free PMC article.
-
Cardiac MRI of differing ischemia and reperfusion times in a myocardial infarction pig model.Sci Rep. 2025 Jul 19;15(1):26270. doi: 10.1038/s41598-025-11390-3. Sci Rep. 2025. PMID: 40683945 Free PMC article.
-
Histopathologic Validation of Stress T1 Mapping in Myocardial Ischemia: Another Step toward Clinical Translation?Radiol Cardiothorac Imaging. 2023 Jun 22;5(3):e230145. doi: 10.1148/ryct.230145. eCollection 2023 Jun. Radiol Cardiothorac Imaging. 2023. PMID: 37404785 Free PMC article. No abstract available.
-
Stress T1 mapping and quantitative perfusion cardiovascular magnetic resonance in patients with suspected obstructive coronary artery disease.Eur Heart J Cardiovasc Imaging. 2025 May 30;26(6):980-990. doi: 10.1093/ehjci/jeaf059. Eur Heart J Cardiovasc Imaging. 2025. PMID: 39957254 Free PMC article.
References
-
- Lockie T , Ishida M , Perera D , et al. . High-resolution magnetic resonance myocardial perfusion imaging at 3.0-Tesla to detect hemodynamically significant coronary stenoses as determined by fractional flow reserve . J Am Coll Cardiol 2011. ; 57 ( 1 ): 70 – 75 . - PubMed
-
- Taylor A , Yang E . Comparing American and European guidelines for the initial diagnosis of stable ischaemic heart disease . Eur Heart J 2020. ; 41 ( 7 ): 811 – 815 . - PubMed
-
- Krittayaphong R , Chaithiraphan V , Maneesai A , Udompanturak S . Prognostic value of combined magnetic resonance myocardial perfusion imaging and late gadolinium enhancement . Int J Cardiovasc Imaging 2011. ; 27 ( 5 ): 705 – 714 . - PubMed
-
- Behzadi AH , Zhao Y , Farooq Z , Prince MR . Immediate allergic reactions to gadolinium-based contrast agents: a systematic review and meta-analysis . Radiology 2018. ; 286 ( 2 ): 471 – 482 . - PubMed
LinkOut - more resources
Full Text Sources

