Review
. 2023 Jun 15;5(3):e230042.
doi: 10.1148/ryct.230042. eCollection 2023 Jun.

Radiology: Cardiothoracic Imaging Highlights 2022

Affiliations
Review

Radiology: Cardiothoracic Imaging Highlights 2022

Domenico Mastrodicasa et al. Radiol Cardiothorac Imaging. .

Abstract

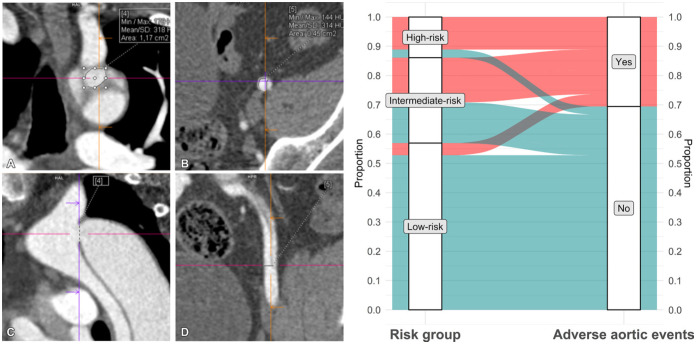
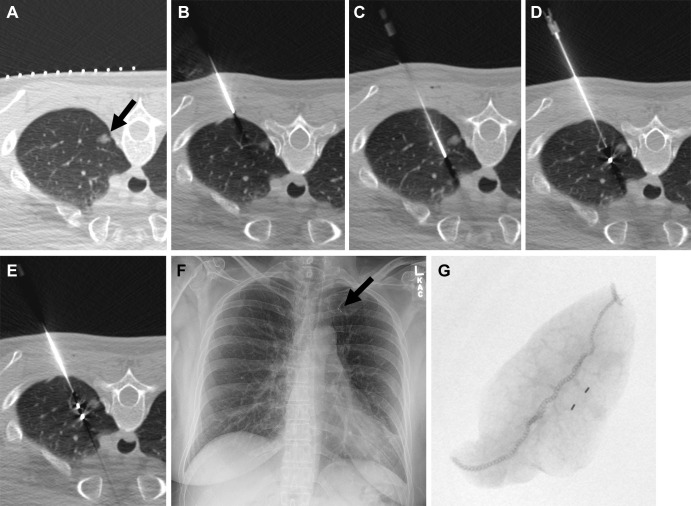
Since its inaugural issue in 2019, Radiology: Cardiothoracic Imaging has disseminated the latest scientific advances and technical developments in cardiac, vascular, and thoracic imaging. In this review, we highlight select articles published in this journal between October 2021 and October 2022. The scope of the review encompasses various aspects of coronary artery and congenital heart diseases, vascular diseases, thoracic imaging, and health services research. Key highlights include changes in the revised Coronary Artery Disease Reporting and Data System 2.0, the value of coronary CT angiography in informing prognosis and guiding treatment decisions, cardiac MRI findings after COVID-19 vaccination or infection, high-risk features at CT angiography to identify patients with aortic dissection at risk for late adverse events, and CT-guided fiducial marker placement for preoperative planning for pulmonary nodules. Ongoing research and future directions include photon-counting CT and artificial intelligence applications in cardiovascular imaging. Keywords: Pediatrics, CT Angiography, CT-Perfusion, CT-Spectral Imaging, MR Angiography, PET/CT, Transcatheter Aortic Valve Implantation/Replacement (TAVI/TAVR), Cardiac, Pulmonary, Vascular, Aorta, Coronary Arteries © RSNA, 2023.

Keywords: Aorta; CT Angiography; CT-Perfusion; CT–Spectral Imaging; Cardiac; Coronary Arteries; MR Angiography; PET/CT; Pediatrics; Pulmonary; Transcatheter Aortic Valve Implantation/Replacement (TAVI/TAVR); Vascular.


Conflict of interest statement

Disclosures of conflicts of interest: D.M. Grants or contracts from the National Institute of Biomedical Imaging and Bioengineering (no. 5T32EB009035); consulting fees from Segmed; stock or stock options in Segmed; member of Radiology: Cardiothoracic Imaging trainee editorial board. G.J.A. Member of Radiology: Cardiothoracic Imaging trainee editorial board. K.G.O. Payment or honoraria from Grand Rounds for lectures, presentations, speakers bureaus, manuscript writing, or educational events; president of the Society of Cardiovascular Magnetic Resonance; associate editor for Radiology: Cardiothoracic Imaging. D.V. Treasurer of the North American Society for Cardiovascular Imaging; member of Radiology: Cardiothoracic Imaging editorial board; mentor for Radiology: Cardiothoracic Imaging trainee editorial board. D.F. Deputy editor for Radiology: Cardiothoracic Imaging. S.A. Royalties from Elsevier for textbook authorship; member of the board of directors of the Society of Cardiovascular Computed Tomography; editor of Radiology: Cardiothoracic Imaging. K.H. Payment or honoraria from Sanofi Genzyme for lectures, presentations, speakers bureaus, manuscript writing, or educational events; associate editor and trainee editorial board lead for Radiology: Cardiothoracic Imaging.

Figures

Representative images of CT plaque analysis demonstrate differences
between type 1 and type 2 myocardial infarction. Left panel: Images in a
42-year-old man diagnosed with type 1 myocardial infarction. (A) Invasive
angiography demonstrates severe stenosis in the distal left anterior descending
artery. (B) Coronary CT angiogram, curved planar reformation, (C) quantitative
plaque analysis, and (D) three-dimensional quantitative plaque analysis
demonstrate a high burden of low-attenuation plaque. Right panel: Images in a
74-year-old man diagnosed with type 2 myocardial infarction. (E)
Electrocardiogram demonstrates broad-complex tachycardia consistent with
ventricular tachycardia. (F) Coronary CT angiogram, curved planar reformation,
(G) quantitative plaque analysis, and (H) three-dimensional quantitative plaque
analysis demonstrate a low burden of low-attenuation plaque. Both participants
have obstructive coronary artery disease detected with coronary CT angiography.
Quantitative plaque analysis demonstrates clear differences, with a much higher
burden of low-attenuation plaque in the participant presenting with type 1
myocardial infarction compared with the participant presenting with type 2.
(Reprinted, with permission, from reference 5.)
Figure 1:
Representative images of CT plaque analysis demonstrate differences between type 1 and type 2 myocardial infarction. Left panel: Images in a 42-year-old man diagnosed with type 1 myocardial infarction. (A) Invasive angiography demonstrates severe stenosis in the distal left anterior descending artery. (B) Coronary CT angiogram, curved planar reformation, (C) quantitative plaque analysis, and (D) three-dimensional quantitative plaque analysis demonstrate a high burden of low-attenuation plaque. Right panel: Images in a 74-year-old man diagnosed with type 2 myocardial infarction. (E) Electrocardiogram demonstrates broad-complex tachycardia consistent with ventricular tachycardia. (F) Coronary CT angiogram, curved planar reformation, (G) quantitative plaque analysis, and (H) three-dimensional quantitative plaque analysis demonstrate a low burden of low-attenuation plaque. Both participants have obstructive coronary artery disease detected with coronary CT angiography. Quantitative plaque analysis demonstrates clear differences, with a much higher burden of low-attenuation plaque in the participant presenting with type 1 myocardial infarction compared with the participant presenting with type 2. (Reprinted, with permission, from reference .)
Measurement of coronary CT angiography–derived left ventricular
(LV) long-axis shortening (LAS) using a reconstructed four-chamber view. Images
at (A) end diastole and (B) end systole in an 87-year-old woman with LV-LAS of
−11.24%, an ejection fraction of 75%, and a Society of Thoracic Surgeons
Predicted Risk of Mortality (STS-PROM) of 6.0% who remained alive after
undergoing transcatheter aortic valve replacement (TAVR) for severe aortic
stenosis. Images at (C) end diastole and (D) end systole in an 88-year-old man
with LV-LAS of −5.54%, an ejection fraction of 67%, and an STS-PROM of
3.6% who died 9 months after undergoing TAVR for severe aortic stenosis.
(Reprinted, with permission, from reference 7.)
Figure 2:
Measurement of coronary CT angiography–derived left ventricular (LV) long-axis shortening (LAS) using a reconstructed four-chamber view. Images at (A) end diastole and (B) end systole in an 87-year-old woman with LV-LAS of −11.24%, an ejection fraction of 75%, and a Society of Thoracic Surgeons Predicted Risk of Mortality (STS-PROM) of 6.0% who remained alive after undergoing transcatheter aortic valve replacement (TAVR) for severe aortic stenosis. Images at (C) end diastole and (D) end systole in an 88-year-old man with LV-LAS of −5.54%, an ejection fraction of 67%, and an STS-PROM of 3.6% who died 9 months after undergoing TAVR for severe aortic stenosis. (Reprinted, with permission, from reference .)
Images in a 72-year-old man with diabetes and hyperlipidemia. (A) Coronary
CT angiographic image shows severe stenosis (red arrow) in the proximal portion
of the left anterior descending artery (LAD). Both the (B) MBF CT map and (C)
MBF PET map demonstrate similar distribution of abnormal perfusion in the
anteroseptal wall and apex corresponding to the LAD stenosis. (D) The dynamic CT
perfusion (CTP) images and time-attenuation curve obtained with dynamic CTP are
demonstrated. AIF = arterial input function, LCX = left circumflex artery, MBF =
myocardial blood flow, MBFCT = CT-derived MBF, MBFCT-corrected = CT-derived MBF
after correction with the fitting curve, MBFPET = PET-derived MBF, RCA = right
coronary artery. (Reprinted, with permission, from reference 12.)
Figure 3:
Images in a 72-year-old man with diabetes and hyperlipidemia. (A) Coronary CT angiographic image shows severe stenosis (red arrow) in the proximal portion of the left anterior descending artery (LAD). Both the (B) MBF CT map and (C) MBF PET map demonstrate similar distribution of abnormal perfusion in the anteroseptal wall and apex corresponding to the LAD stenosis. (D) The dynamic CT perfusion (CTP) images and time-attenuation curve obtained with dynamic CTP are demonstrated. AIF = arterial input function, LCX = left circumflex artery, MBF = myocardial blood flow, MBFCT = CT-derived MBF, MBFCT-corrected = CT-derived MBF after correction with the fitting curve, MBFPET = PET-derived MBF, RCA = right coronary artery. (Reprinted, with permission, from reference .)
Coronary phantom content and imaging. Each column shows a different region
of interest (ROI), with the detailed 5-mm probe content shown in the top row.
Cross-sections of the probe at energy-integrating detector CT (EID; second row),
photon-counting CT (PCCT; third row), and high-resolution PCCT (HR PCCT; fourth
row) with and without stents. Window and level for unstented cases was 1600 HU
and 300 HU and for stented cases was 1000 HU and 250 HU, respectively.
(Reprinted, with permission, from reference 15.)
Figure 4:
Coronary phantom content and imaging. Each column shows a different region of interest (ROI), with the detailed 5-mm probe content shown in the top row. Cross-sections of the probe at energy-integrating detector CT (EID; second row), photon-counting CT (PCCT; third row), and high-resolution PCCT (HR PCCT; fourth row) with and without stents. Window and level for unstented cases was 1600 HU and 300 HU and for stented cases was 1000 HU and 250 HU, respectively. (Reprinted, with permission, from reference .)
Diagram representing the common sites of major aortopulmonary collateral
arteries origin and classification. D4–D6 = dorsal vertebrae 4 to 6, IMA
= internal mammary artery. (Reprinted, with permission, from reference
17.)
Figure 5:
Diagram representing the common sites of major aortopulmonary collateral arteries origin and classification. D4–D6 = dorsal vertebrae 4 to 6, IMA = internal mammary artery. (Reprinted, with permission, from reference .)
Four-dimensional (4D) flow assessment in an 11-year-old patient with
hypoplastic left heart syndrome after intra-atrial lateral tunnel Fontan
procedure. (A) Streamline visualization with velocity color coding of 4D flow
data. (B) Flow quantification in the aorta (Ao) (red), superior vena cava (SVC)
and lateral tunnel (LT) (green), left pulmonary artery (LPA) (yellow), and right
pulmonary veins (RPVs) (blue). IVC = inferior vena cava, SV = single ventricle.
(Reprinted, with permission, from reference 18.)
Figure 6:
Four-dimensional (4D) flow assessment in an 11-year-old patient with hypoplastic left heart syndrome after intra-atrial lateral tunnel Fontan procedure. (A) Streamline visualization with velocity color coding of 4D flow data. (B) Flow quantification in the aorta (Ao) (red), superior vena cava (SVC) and lateral tunnel (LT) (green), left pulmonary artery (LPA) (yellow), and right pulmonary veins (RPVs) (blue). IVC = inferior vena cava, SV = single ventricle. (Reprinted, with permission, from reference .)
Four-dimensional (4D) flow visualization of venovenous and aortopulmonary
collateral vessels to determine the cause of systemic-pulmonary venous shunting.
First are two patients with large venovenous collateral vessels (red arrow): (A)
a 5-year-old boy and (B) a 12-year-old boy, with drainage directly into the
atrium bypassing the pulmonary arteries. (C) In a 13-year-old girl, a small
aortopulmonary collateral artery is seen arising from the descending thoracic
aorta (white arrow). Finally, on the bottom row, a 33-year-old man with large
serpiginous venous collateral vessels (orange dashed arrows in D and E) is shown
on (D) 4D flow and (E, F) cardiac CT angiographic images, illustrating large
venous varices and their direct supply from the hepatic venous confluence (blue
arrow). (Reprinted, with permission, from reference 20.)
Figure 7:
Four-dimensional (4D) flow visualization of venovenous and aortopulmonary collateral vessels to determine the cause of systemic-pulmonary venous shunting. First are two patients with large venovenous collateral vessels (red arrow): (A) a 5-year-old boy and (B) a 12-year-old boy, with drainage directly into the atrium bypassing the pulmonary arteries. (C) In a 13-year-old girl, a small aortopulmonary collateral artery is seen arising from the descending thoracic aorta (white arrow). Finally, on the bottom row, a 33-year-old man with large serpiginous venous collateral vessels (orange dashed arrows in D and E) is shown on (D) 4D flow and (E, F) cardiac CT angiographic images, illustrating large venous varices and their direct supply from the hepatic venous confluence (blue arrow). (Reprinted, with permission, from reference .)
Cardiac MR native T1 mapping images in adults born (A) term and (B)
preterm. Native T1 values were measured in a midventricular section, with global
left ventricular (LV) values recorded as a mean native T1 value for the entire
mid-LV section (T1LV) and as a mean T1 value for a 1-cm2 region of interest in
the septum (dotted line). RV = right ventricle. (Reprinted, with permission,
from reference 22.)
Figure 8:
Cardiac MR native T1 mapping images in adults born (A) term and (B) preterm. Native T1 values were measured in a midventricular section, with global left ventricular (LV) values recorded as a mean native T1 value for the entire mid-LV section (T1LV) and as a mean T1 value for a 1-cm2 region of interest in the septum (dotted line). RV = right ventricle. (Reprinted, with permission, from reference .)
Position of the descending aorta relative to the left atrium (LA). (A)
Multiplanar reconstruction displaying a posterior view of the LA and the
descending aorta (AOD). (B) Multiplanar reconstruction displaying an axial view
of the LA and the AOD. (C) Contrast-enhanced MR angiogram of the LA and aorta.
(D) Late gadolinium enhancement MRI of the LA and the aorta. (E) An illustration
of the LA incorporating a common location of the AOD. AOA = ascending aorta, LAA
= LA appendage, LIPV = left inferior PV, LSPV = left superior PV, PA = pulmonary
artery, PV = pulmonary vein, RIPV = right inferior PV, RSPV = right superior PV.
(Reprinted, with permission, from reference 23.)
Figure 9:
Position of the descending aorta relative to the left atrium (LA). (A) Multiplanar reconstruction displaying a posterior view of the LA and the descending aorta (AOD). (B) Multiplanar reconstruction displaying an axial view of the LA and the AOD. (C) Contrast-enhanced MR angiogram of the LA and aorta. (D) Late gadolinium enhancement MRI of the LA and the aorta. (E) An illustration of the LA incorporating a common location of the AOD. AOA = ascending aorta, LAA = LA appendage, LIPV = left inferior PV, LSPV = left superior PV, PA = pulmonary artery, PV = pulmonary vein, RIPV = right inferior PV, RSPV = right superior PV. (Reprinted, with permission, from reference .)
COVID-19 vaccine–associated myocarditis. Case example in a
27-year-old man with myocarditis 3 days following COVID-19 vaccine
administration. Images from cardiac MRI performed at 1.5 T demonstrate
subepicardial late gadolinium enhancement at the (A) basal to mid anterior
lateral, inferior lateral, and inferior wall (red arrows), with (B)
corresponding high T2 signal (orange arrows), (C) high regional native T1 (1173
msec), and (D) high regional native T2 (59 msec) on short-axis images.
(Reprinted, with permission, from reference 29.)
Figure 10:
COVID-19 vaccine–associated myocarditis. Case example in a 27-year-old man with myocarditis 3 days following COVID-19 vaccine administration. Images from cardiac MRI performed at 1.5 T demonstrate subepicardial late gadolinium enhancement at the (A) basal to mid anterior lateral, inferior lateral, and inferior wall (red arrows), with (B) corresponding high T2 signal (orange arrows), (C) high regional native T1 (1173 msec), and (D) high regional native T2 (59 msec) on short-axis images. (Reprinted, with permission, from reference .)
On the left: Multiplanar reconstructions of a CT angiographic study show
(A, C) the proximal entry tear in the aortic isthmus and (B, D) the distal entry
tear in the left external iliac artery in a 49-year-old man with an
uncomplicated type B aortic dissection 3 months after discharge. Entry tears are
measured in a double oblique en face view close to the (A) coronal plane in a
1.2-cm2 proximal tear and (B) in the axial plane in a 0.5-cm2 distal tear. (C) A
sagittal plane of the arch and descending thoracic aorta and (D) a coronal plane
of the left iliac artery are provided as references for tear location and plane
adjustment. Crosshairs indicate the exact location of each tear in two planes.
On the right: Distribution and rate of adverse events in study participants
according to risk group. Only three of 41 participants in the low-risk group
(7%), which comprised 57% of the total cohort (41 of 72), had a nonacute
long-term aortic event (elective surgery). Max = maximum, Min = minimum.
(Adapted, with permission, from reference 36.)
Figure 11:
On the left: Multiplanar reconstructions of a CT angiographic study show (A, C) the proximal entry tear in the aortic isthmus and (B, D) the distal entry tear in the left external iliac artery in a 49-year-old man with an uncomplicated type B aortic dissection 3 months after discharge. Entry tears are measured in a double oblique en face view close to the (A) coronal plane in a 1.2-cm2 proximal tear and (B) in the axial plane in a 0.5-cm2 distal tear. (C) A sagittal plane of the arch and descending thoracic aorta and (D) a coronal plane of the left iliac artery are provided as references for tear location and plane adjustment. Crosshairs indicate the exact location of each tear in two planes. On the right: Distribution and rate of adverse events in study participants according to risk group. Only three of 41 participants in the low-risk group (7%), which comprised 57% of the total cohort (41 of 72), had a nonacute long-term aortic event (elective surgery). Max = maximum, Min = minimum. (Adapted, with permission, from reference .)
On the left: The “Dean effect” artifact in a 71-year-old
woman with increasing dyspnea and a history of hypertension, atrial
fibrillation, mitral regurgitation, and congestive heart failure (New York Heart
Association grade IV) with an estimated ejection fraction of 20%. One sagittal
(left) maximum intensity projection and three axial (right; 3.0-mm section
thickness) contrast-enhanced (Omnipaque 350; GE Healthcare) CT angiographic
images of the thorax through the level of the aortic arch in a narrowed and
decentered soft-tissue window (convolutional kernel l40) demonstrate a
flow-related artifact with distinct flow separation. This results in a
heterogeneous hypoattenuation along the inner curvature of the arch due to
incomplete mixing of unopacified blood with contrast material. The sagittal
plane best demonstrates that the finding is artifactual. On the right:
Artist’s conceptual illustration of the proposed process of flow
perturbation and mixing of blood as it flows from the proximal aorta
(superiormost cross section) to the descending aorta (inferiormost cross
section). The highest-velocity flow (red) occurs at the outer curvature, while
the lowest-velocity flow (blue) occurs at the inner curvature. This unique
separation of differential flow velocities is the hypothesized origin of the
artifact. As the Dean vortices form (second cross section) and begin to
experience flow perturbation and mixing (third cross section), there is eventual
flow velocity homogenization and a return to more normal laminar flow as the
blood enters the straight tube of the descending aorta (fourth cross section).
(Illustration reprinted, with permission, from Aletta Ann Frazier MD.) (Figures
adapted, with permission, from reference 38.)
Figure 12:
On the left: The “Dean effect” artifact in a 71-year-old woman with increasing dyspnea and a history of hypertension, atrial fibrillation, mitral regurgitation, and congestive heart failure (New York Heart Association grade IV) with an estimated ejection fraction of 20%. One sagittal (left) maximum intensity projection and three axial (right; 3.0-mm section thickness) contrast-enhanced (Omnipaque 350; GE Healthcare) CT angiographic images of the thorax through the level of the aortic arch in a narrowed and decentered soft-tissue window (convolutional kernel l40) demonstrate a flow-related artifact with distinct flow separation. This results in a heterogeneous hypoattenuation along the inner curvature of the arch due to incomplete mixing of unopacified blood with contrast material. The sagittal plane best demonstrates that the finding is artifactual. On the right: Artist’s conceptual illustration of the proposed process of flow perturbation and mixing of blood as it flows from the proximal aorta (superiormost cross section) to the descending aorta (inferiormost cross section). The highest-velocity flow (red) occurs at the outer curvature, while the lowest-velocity flow (blue) occurs at the inner curvature. This unique separation of differential flow velocities is the hypothesized origin of the artifact. As the Dean vortices form (second cross section) and begin to experience flow perturbation and mixing (third cross section), there is eventual flow velocity homogenization and a return to more normal laminar flow as the blood enters the straight tube of the descending aorta (fourth cross section). (Illustration reprinted, with permission, from Aletta Ann Frazier MD.) (Figures adapted, with permission, from reference .)
Images in a 50-year-old woman with an incidentally detected, enlarging,
10-mm, left upper lobe, part-solid nodule proven to be adenocarcinoma (100%
lepidic). (A) Preliminary axial CT image shows a left upper lobe nodule (arrow).
(B) The coaxial introducer needle was advanced through the subcutaneous tissue
to the pleura. (C) The needle was advanced deeply to the nodule. (D) The first
3-mm gold fiducial marker was deployed, and the needle was retracted. (E) The
second fiducial marker was deployed with the nodule sandwiched between fiducial
markers and the pleura. (F) Postprocedure radiograph demonstrates the two
fiducial markers in the left upper lung (arrow). (G) Radiograph of the specimen
with two fiducial markers in the specimen. (Reprinted, with permission, from
reference 41.)
Figure 13:
Images in a 50-year-old woman with an incidentally detected, enlarging, 10-mm, left upper lobe, part-solid nodule proven to be adenocarcinoma (100% lepidic). (A) Preliminary axial CT image shows a left upper lobe nodule (arrow). (B) The coaxial introducer needle was advanced through the subcutaneous tissue to the pleura. (C) The needle was advanced deeply to the nodule. (D) The first 3-mm gold fiducial marker was deployed, and the needle was retracted. (E) The second fiducial marker was deployed with the nodule sandwiched between fiducial markers and the pleura. (F) Postprocedure radiograph demonstrates the two fiducial markers in the left upper lung (arrow). (G) Radiograph of the specimen with two fiducial markers in the specimen. (Reprinted, with permission, from reference .)
PREFUL MRI parameter maps following treatment with placebo and IND-GLY in
one patient. Shown are the FVL-CM (see Figs 1 and 2 in reference 42), RVent, Q,
VQMCM, and VQMRVent of one patient with COPD (man, 67 years old,
postbronchodilator FEV1 at baseline of 31.6% and FEV1 postbronchodilator
treatment of 36.7%, GOLD stage 3) for one coronal section located at the
tracheal bifurcation. Note the difference between postplacebo and
postbronchodilator treatment: (A) 80% versus 86% (FVL-CM), (B) 8% versus 12%
(RVent), (C) 57 versus 85 mL/min/100 mL (Q), (D) 50% versus 60% (VQMCM), and (E)
36% versus 51% (VQMRVent), respectively. Ventilation and perfusion defects (VDP
and QDP) were defined as values below threshold (Q < 20 mL/min/100 mL,
FVL-CM < 0.9, RVent < 0.075). Images were acquired without
contrast agent administration using a two-dimensional gradient-echo sequence in
coronal orientation. COPD = chronic obstructive pulmonary disease, FVL-CM =
flow-volume loop correlation map, GOLD = Global Initiative for Chronic
Obstructive Lung Disease, IND/GLY = indacaterol-glycopyrronium, PREFUL =
phase-resolved functional lung, Q = perfusion, QDP = perfusion defect
percentage, RVent = regional ventilation, V = ventilation, VDP = ventilation
defect percentage, V/Q = ventilation-perfusion, VQM = ventilation-perfusion
match, VQMCM = ventilation-perfusion match with Q and FVL-CM, VQMRVent =
ventilation-perfusion match with Q and RVent. (Adapted, with permission, from
reference 42.)
Figure 14:
PREFUL MRI parameter maps following treatment with placebo and IND-GLY in one patient. Shown are the FVL-CM (see Figs 1 and 2 in reference 42), RVent, Q, VQMCM, and VQMRVent of one patient with COPD (man, 67 years old, postbronchodilator FEV1 at baseline of 31.6% and FEV1 postbronchodilator treatment of 36.7%, GOLD stage 3) for one coronal section located at the tracheal bifurcation. Note the difference between postplacebo and postbronchodilator treatment: (A) 80% versus 86% (FVL-CM), (B) 8% versus 12% (RVent), (C) 57 versus 85 mL/min/100 mL (Q), (D) 50% versus 60% (VQMCM), and (E) 36% versus 51% (VQMRVent), respectively. Ventilation and perfusion defects (VDP and QDP) were defined as values below threshold (Q < 20 mL/min/100 mL, FVL-CM < 0.9, RVent < 0.075). Images were acquired without contrast agent administration using a two-dimensional gradient-echo sequence in coronal orientation. COPD = chronic obstructive pulmonary disease, FVL-CM = flow-volume loop correlation map, GOLD = Global Initiative for Chronic Obstructive Lung Disease, IND/GLY = indacaterol-glycopyrronium, PREFUL = phase-resolved functional lung, Q = perfusion, QDP = perfusion defect percentage, RVent = regional ventilation, V = ventilation, VDP = ventilation defect percentage, V/Q = ventilation-perfusion, VQM = ventilation-perfusion match, VQMCM = ventilation-perfusion match with Q and FVL-CM, VQMRVent = ventilation-perfusion match with Q and RVent. (Adapted, with permission, from reference .)

References

    1. Gulati M , Levy PD , Mukherjee D , et al. . 2021 AHA/ACC/ASE/CHEST/SAEM/SCCT/SCMR Guideline for the Evaluation and Diagnosis of Chest Pain: Executive Summary: A Report of the American College of Cardiology/American Heart Association Joint Committee on Clinical Practice Guidelines . Circulation 2021. ; 144 ( 22 ): e368 – e454 . - PubMed
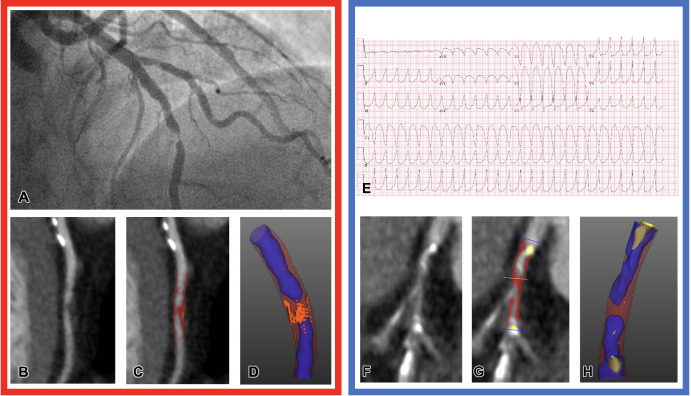
    1. Cury RC , Leipsic J , Abbara S , et al. . CAD-RADS™ 2.0 - 2022 Coronary Artery Disease - Reporting and Data System An Expert Consensus Document of the Society of Cardiovascular Computed Tomography (SCCT), the American College of Cardiology (ACC), the American College of Radiology (ACR) and the North America Society of Cardiovascular Imaging (NASCI) . Radiol Cardiothorac Imaging 2022. ; 4 ( 5 ): e220183 . - PMC - PubMed
    1. DeFilippis AP , Chapman AR , Mills NL , et al. . Assessment and treatment of patients with type 2 myocardial infarction and acute nonischemic myocardial injury . Circulation 2019. ; 140 ( 20 ): 1661 – 1678 . - PMC - PubMed
    1. Cappellini LA , Eberhard M , Templin C , Vogt PR , Manka R , Alkadhi H . Iatrogenic aortic root injury from coronary interventions: early and follow-up CT imaging findings . Radiol Cardiothorac Imaging 2021. ; 3 ( 6 ): e210241 . - PMC - PubMed
    1. Meah MN , Bularga A , Tzolos E , et al. . Distinguishing type 1 from type 2 myocardial infarction by using CT coronary angiography . Radiol Cardiothorac Imaging 2022. ; 4 ( 5 ): e220081 . - PMC - PubMed

LinkOut - more resources