. 2023 Oct;19(10):2769-2788.
doi: 10.1080/15548627.2023.2230837. Epub 2023 Jul 5.

High-resolution visualization and assessment of basal and OXPHOS-induced mitophagy in H9c2 cardiomyoblasts

Affiliations

High-resolution visualization and assessment of basal and OXPHOS-induced mitophagy in H9c2 cardiomyoblasts

Gustav Godtliebsen et al. Autophagy. 2023 Oct.

Abstract

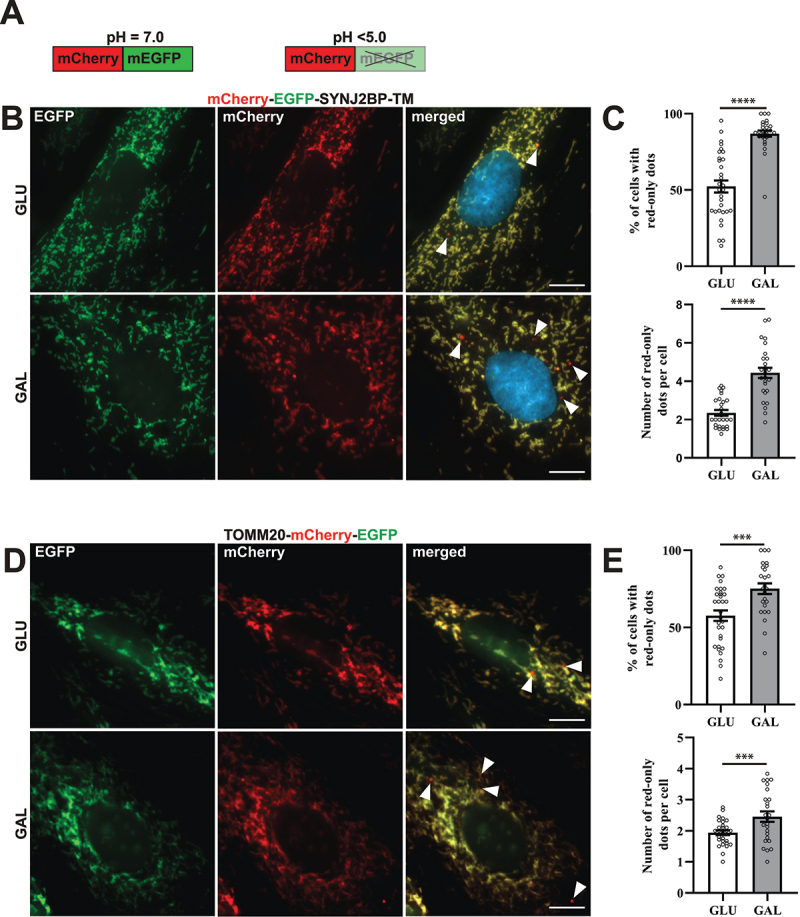
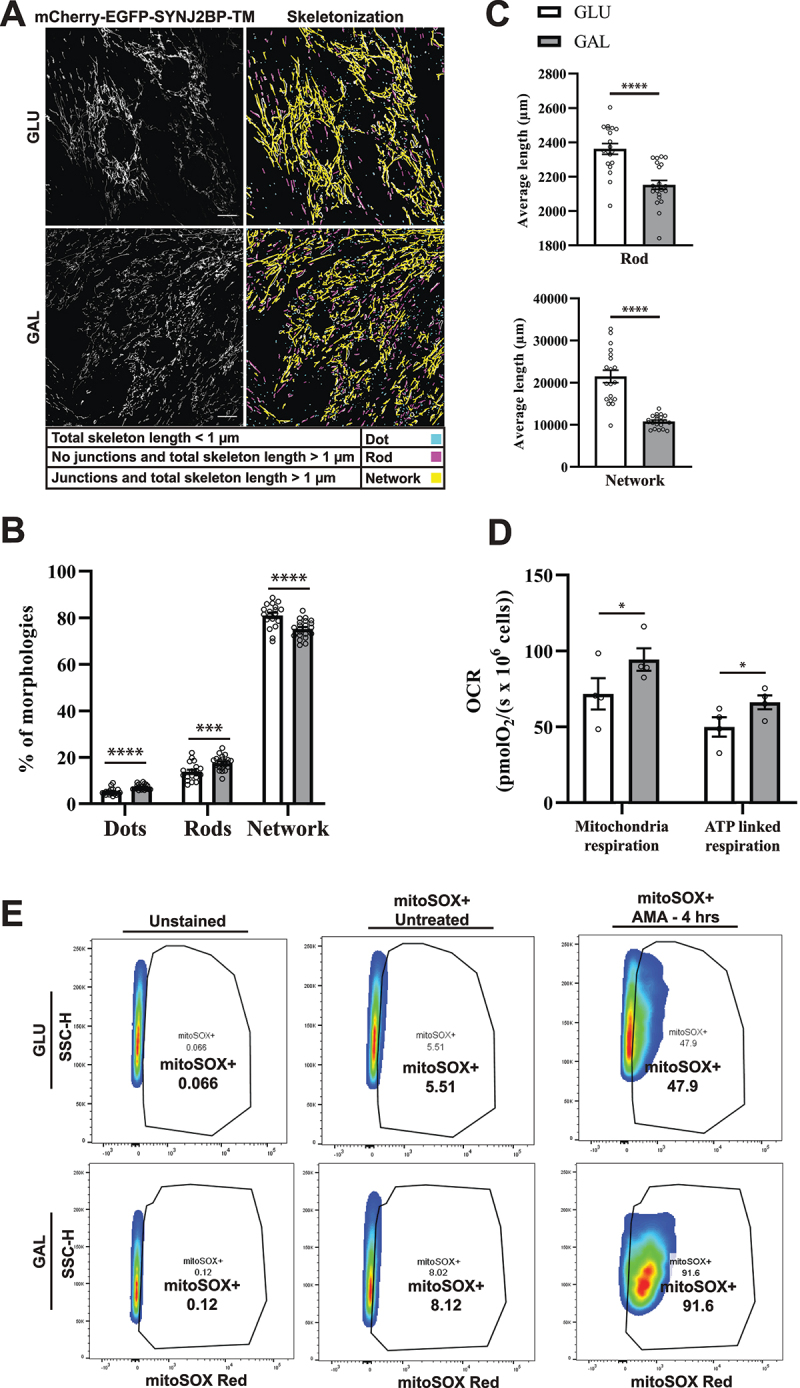
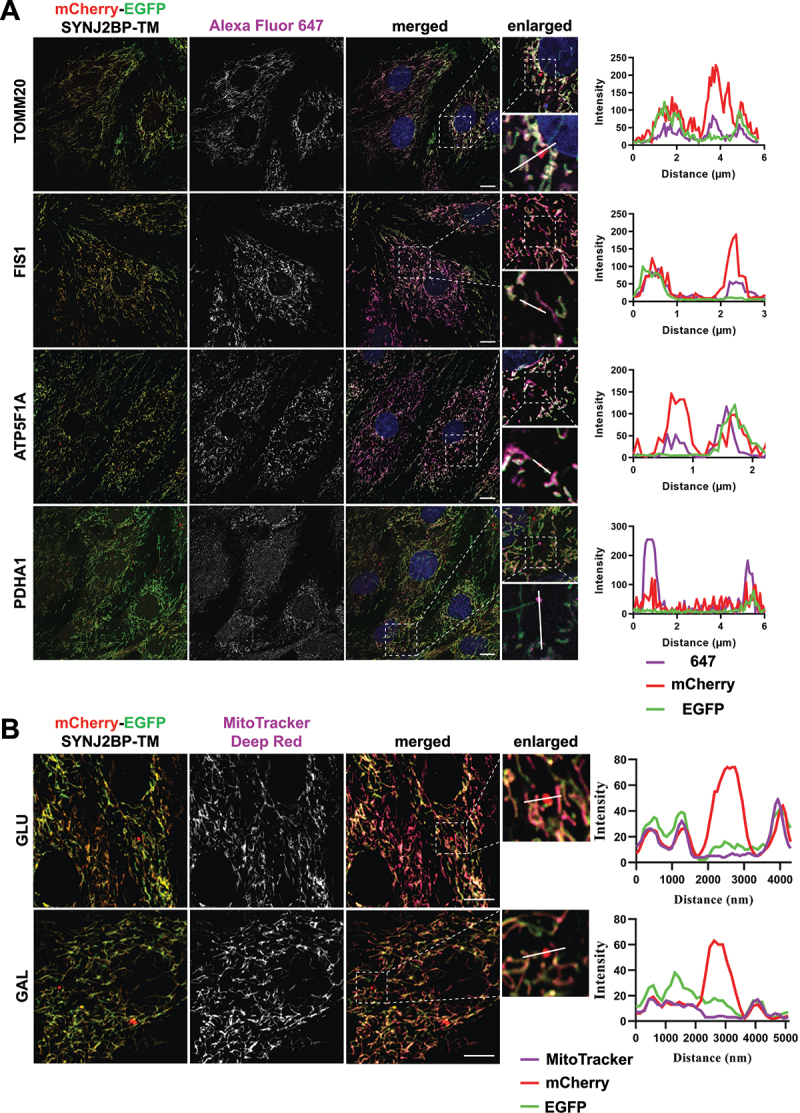
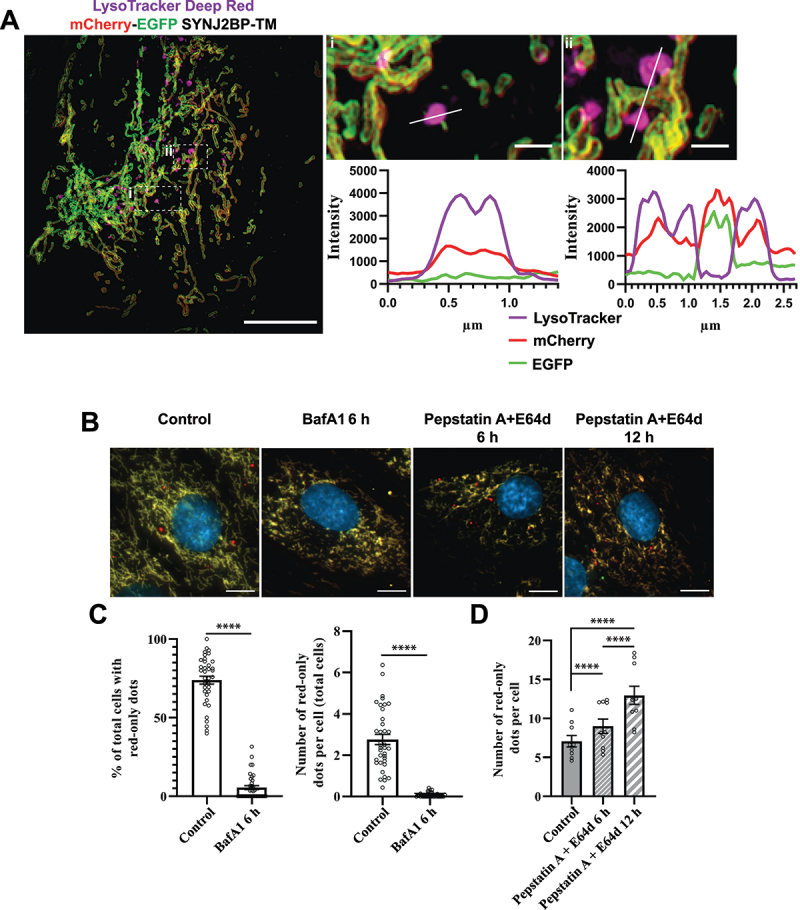
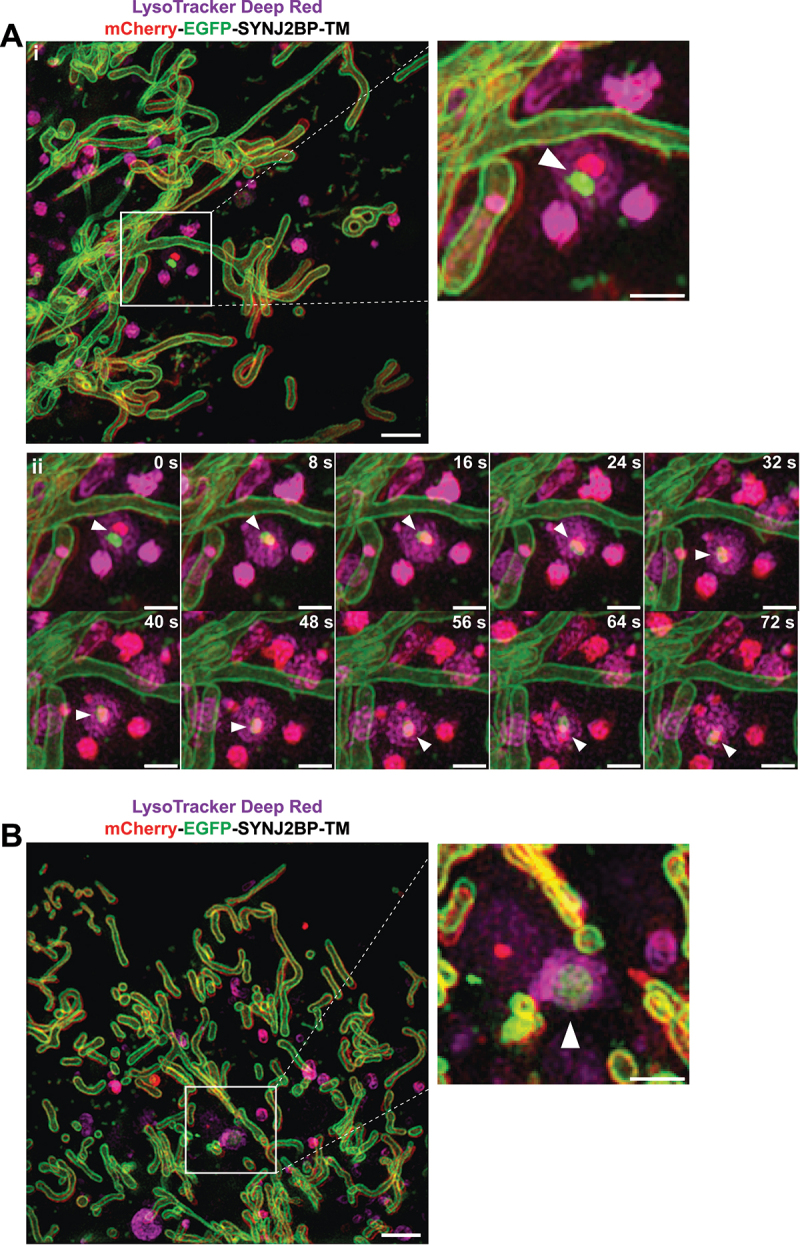
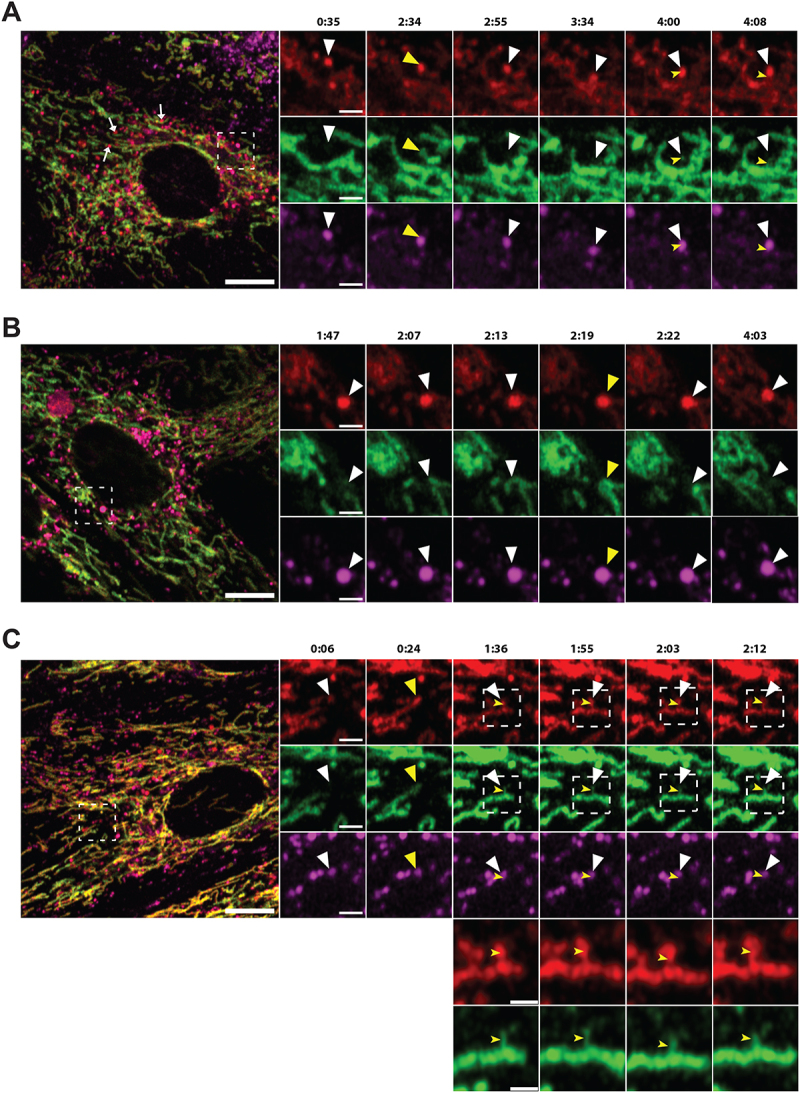
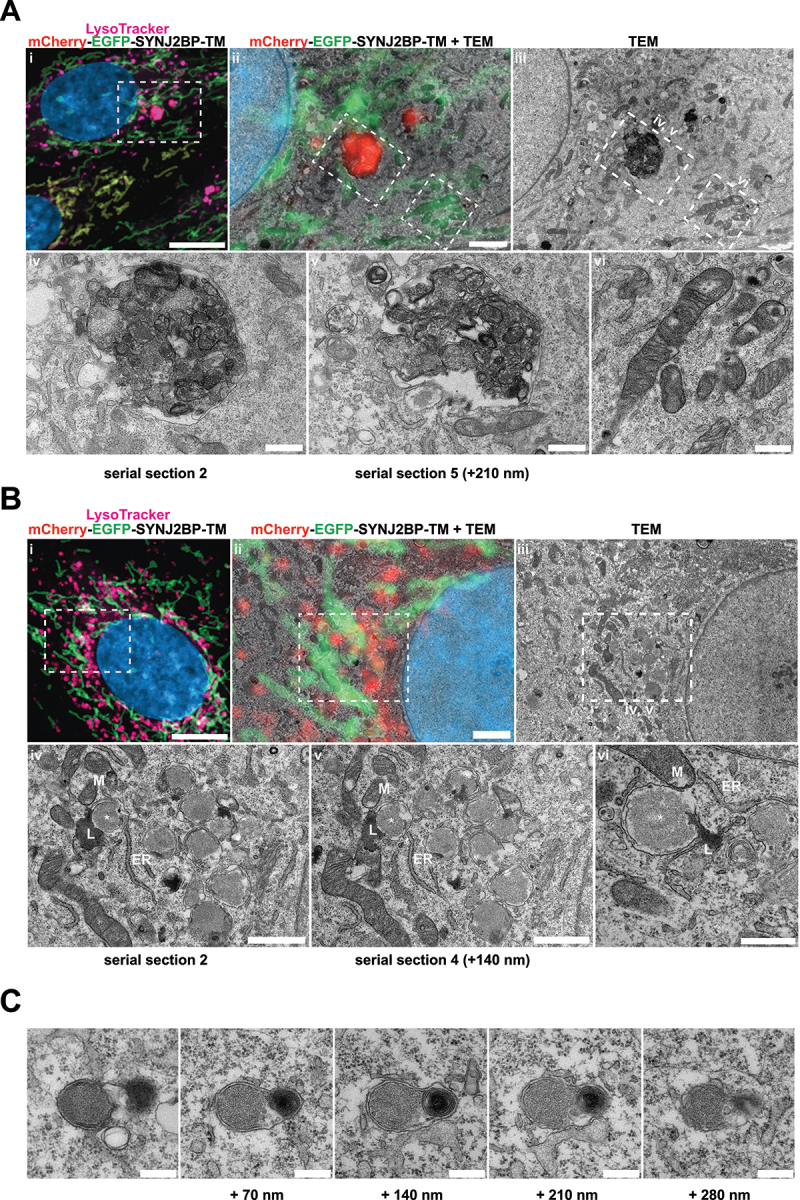
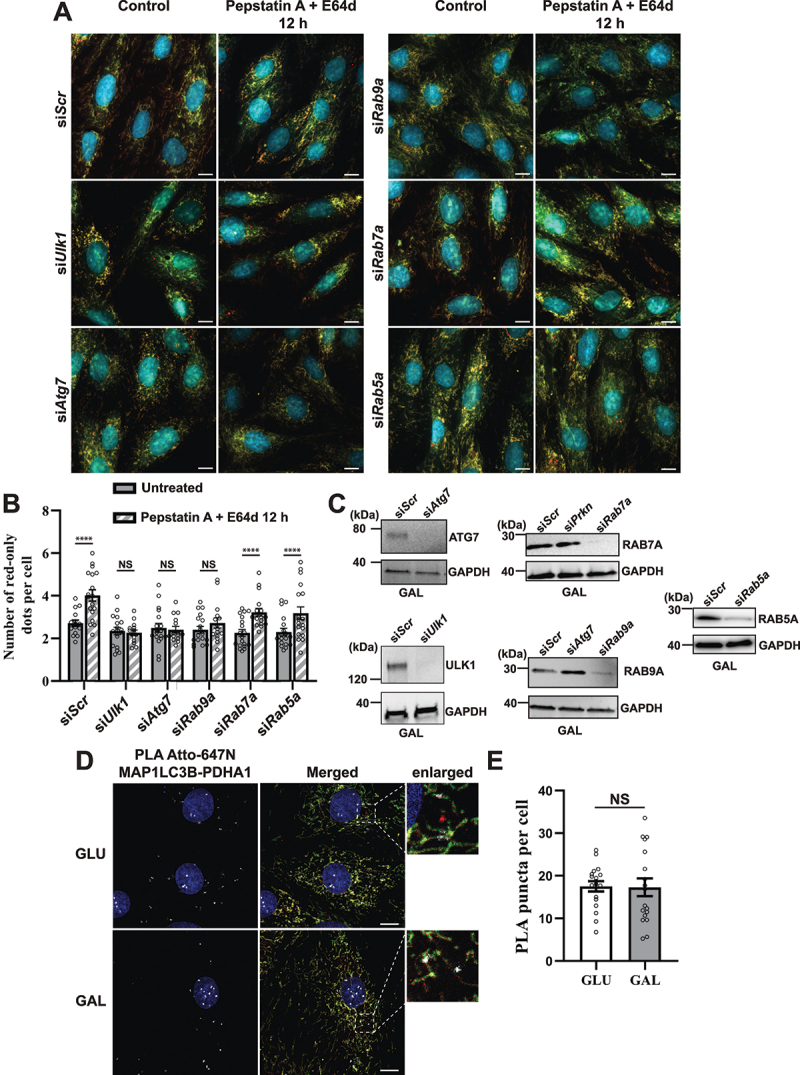
Mitochondria are susceptible to damage resulting from their activity as energy providers. Damaged mitochondria can cause harm to the cell and thus mitochondria are subjected to elaborate quality-control mechanisms including elimination via lysosomal degradation in a process termed mitophagy. Basal mitophagy is a house-keeping mechanism fine-tuning the number of mitochondria according to the metabolic state of the cell. However, the molecular mechanisms underlying basal mitophagy remain largely elusive. In this study, we visualized and assessed the level of mitophagy in H9c2 cardiomyoblasts at basal conditions and after OXPHOS induction by galactose adaptation. We used cells with a stable expression of a pH-sensitive fluorescent mitochondrial reporter and applied state-of-the-art imaging techniques and image analysis. Our data showed a significant increase in acidic mitochondria after galactose adaptation. Using a machine-learning approach we also demonstrated increased mitochondrial fragmentation by OXPHOS induction. Furthermore, super-resolution microscopy of live cells enabled capturing of mitochondrial fragments within lysosomes as well as dynamic transfer of mitochondrial contents to lysosomes. Applying correlative light and electron microscopy we revealed the ultrastructure of the acidic mitochondria confirming their proximity to the mitochondrial network, ER and lysosomes. Finally, exploiting siRNA knockdown strategy combined with flux perturbation with lysosomal inhibitors, we demonstrated the importance of both canonical as well as non-canonical autophagy mediators in lysosomal degradation of mitochondria after OXPHOS induction. Taken together, our high-resolution imaging approaches applied on H9c2 cells provide novel insights on mitophagy during physiologically relevant conditions. The implication of redundant underlying mechanisms highlights the fundamental importance of mitophagy.Abbreviations: ATG: autophagy related; ATG7: autophagy related 7; ATP: adenosine triphosphate; BafA1: bafilomycin A1; CLEM: correlative light and electron microscopy; EGFP: enhanced green fluorescent protein; MAP1LC3B: microtubule associated protein 1 light chain 3 beta; OXPHOS: oxidative phosphorylation; PepA: pepstatin A; PLA: proximity ligation assay; PRKN: parkin RBR E3 ubiquitin protein ligase; RAB5A: RAB5A, member RAS oncogene family; RAB7A: RAB7A, member RAS oncogene family; RAB9A: RAB9A, member RAS oncogene family; ROS: reactive oxygen species; SIM: structured illumination microscopy; siRNA: short interfering RNA; SYNJ2BP: synaptojanin 2 binding protein; TEM: transmission electron microscopy; TOMM20: translocase of outer mitochondrial membrane 20; ULK1: unc-51 like kinase 1.

Keywords: CLEM; SIM; deep learning; lysosomes; mitochondria; quality control.


Conflict of interest statement

No potential conflict of interest was reported by the author(s).

Figures

Figure 1.
Figure 1.
Reporter H9c2 cells display an increase in acidic mitochondria during galactose adaption. (A) An illustration of the pH-sensitive tandem fluorescent reporter mCherry-EGFP at different pH levels (red and green at neutral pH and red-only at acidic pH). (B) Representative widefield fluorescence microscopy images of H9c2 cells with a stable expression of the mCherry-EGFP-SYNJ2BP-TM reporter grown in glucose (GLU) or adapted to galactose (GAL) media. (C) Quantification of the percentage of cells containing red-only dots and quantification of the number of red-only dots per cell in cells with red-only dots in glucose vs galactose media for cells with the mCherry-EGFP-SYNJ2BP-TM reporter. (D) Representative widefield fluorescence microscopy images of H9c2 cells with a stable expression of the TOMM20-mCherry-EGFP reporter grown in glucose (GLU) or adapted to galactose (GAL) media. (E) Quantification of the percentage of cells containing red-only dots and quantification of the number of red-only dots per cell in cells with red only dots in glucose vs galactose media for cells with the TOMM20-mCherry-EGFP reporter. Data presented in (C) and (E) is shown as mean ± SEM from 3 independent experiments, with more than 100 cells in each condition. The individual datapoints are per frame cell averages.
Figure 2.
Figure 2.
Mitochondria morphology analysis, mitochondrial respiration and ROS measurements indicate more fragmented mitochondria and OXPHOS dependance after galactose adaptation. (A) Morphological analysis of confocal images of cells grown in glucose vs galactose media. A representative skeletonization mask is depicted for each culture condition with the different morphology classes indicated in different colors. Rules for morphology classes are displayed at the bottom. (B) Overview of the distribution of mitochondria morphology classes in percentage for the two different growth conditions. The distribution for glucose vs galactose adaption is 5.16% vs 7.14% for dots, 13.79% vs 17.58% for rods and 81.04% vs 75.28% for network. (C) Quantification of the average length of mitochondria in the rod and network morphology classes for cells grown in glucose vs galactose. (D) High-resolution respirometry performed in an Oxygraph-2k (Oroboros Instruments). Oxygen consumption rate, OCR (pmolO2/s × 106 cells) of cells grown under normal conditions (high glucose) or adapted to galactose was corrected for residual oxygen consumption (ROX) and normalized to the cell number per ml in the chambers. The values displayed in the graph are from four independent experiments ± SEM, indicating mitochondrial respiration (basal respiration minus ROX) and ATP-linked respiration (basal respiration minus proton leak), respectively. (E) Flow cytometry analysis of H9c2 cells grown in normal media with glucose or adapted to galactose. The antimycin A (AMA) treated/untreated cells were stained with mitoSOX Red and compared with unstained cells as a negative control. During normal culture conditions, antimycin A treatment resulted in approximately 47% mitoSOX Red positive cells, while in galactose 91% of the cells were mitoSOX Red positive. The data depicted represent one of three independent experiments. Data presented in (B) and (C) is shown as mean ± SEM of 20 fields of view per condition. The individual datapoints are per frame cell averages.
Figure 3.
Figure 3.
Red-only dots colocalize with mitochondrial markers of different mitochondrial compartments and lack membrane potential. (A) Confocal microscopy images of fixed tandem- tagged (mCherry-EGFP-SYNJ2BP-TM) H9c2 cells demonstrating colocalization of red-only dots with mitochondrial marker proteins of the different mitochondrial compartments; FIS1 and TOMM20 (outer membrane), ATP5F1 A (inner membrane) and PDHA1 (matrix). Region of interest for each marker is presented in a zoomed-in image with a line profile including an enlarged red-only dot displaying the colocalization. (B) Confocal microscopy images of live H9c2 cells with the mCherry-EGFP-SYNJ2BP-TM reporter and MitoTracker Deep Red staining for both glucose and galactose adapted cells. The enlarged region of interest depicts line profiles demonstrating colocalization of MitoTracker Deep Red in mitochondrial networks, but lack of colocalization in red-only dots. Scale bar: 10 μm.
Figure 4.
Figure 4.
Functional lysosomes are essential for the appearance and removal of red-only dots during galactose adaption. (A) Structured illumination microscopy (SIM) imaging of fixed mCherry-EGFP-SYNJ2BP-TM H9c2 cells showing red-only dots that are positive for LysoTracker DeepRed staining (magenta). Line profiles through the LysoTracker-positive red-only dots in the enlarged boxed regions of interest are depicted, with corresponding numbers between the overview image and enlarged images. (B) Representative images of galactose adapted mCherry-EGFP-SYNJ2BP-TM H9c2 cells during control conditions and after treatment with the lysosomal inhibitors bafilomycin A1 (BafA1; 200 nM) and pepstatin a (PepA;10 μg/ml) and E64d (10 μg/ml) for the indicated times. (C) Quantification of the effects of a 6 h treatment of BafA1 on galactose adapted cells with the mCherry-EGFP-SYNJ2BP-TM reporter by assessing the percentage of cells containing red-only dots and number of red-only dots per total cells. (D) Quantification of the effects of a time course treatment of PepA and E64d assessed by number of red-only dots per cell in cells with red-only dots in galactose adapted cells with the mCherry-EGFP-SYNJ2BP-TM reporter. Over 150 cells were analyzed for each condition. The data is presented as mean ± SEM from 3 independent experiments, with more than 100 cells per condition. The individual datapoints are per frame cell averages. NOTE: * p < 0.05, ** p < 0.01, *** p < 0.001 and **** p < 0.0001. Scale bars: 10 μm and 1 μm (Ai and Aii).
Figure 5.
Figure 5.
Three-dimensional (3D) structured illumination microscopy (SIM) live cell imaging of mCherry-EGFP-SYNJ2BP-TM H9c2 cells captures mitochondrial fragments within acidic structures. (Ai) A still frame overview image (merged channels) from the start of Video S1 displaying a cell during normal culture conditions after adding the LysoTracker Deep Red dye (100 nM for 40 min). The boxed area indicates a mitochondrial fragment with both EGFP and mCherry fluorescence inside a LysoTracker Deep Red-positive structure. The channels for red and green fluorescence are slightly shifted due to the time-delay between images of the different channels. The region of interest is shown as an enlarged image and the structure is highlighted with an arrowhead. (Aii) A time series of the boxed area in Video S1 following the movement of the lysosome containing the mitochondrial fragment (arrowhead). (B) A still frame overview image (merged channels) from the start of Video S2 displaying a cell after galactose adaptation after adding the LysoTracker Deep Red dye (100 nM for 40 min). The boxed area indicates a mitochondrial fragment with both EGFP and mCherry fluorescence inside a LysoTracker Deep Red-positive structure. The region of interest is shown as an enlarged image with the identified structure highlighted with an arrowhead. Max projection was utilized for all the images. Scale bars: 2 μm (overview images) and 1 μm (the enlarged images and for the time series).
Figure 6.
Figure 6.
Airyscan FAST imaging of live galactose adapted mCherry-EGFP-SYNJ2B-TM H9c2 cells stained with LysoView 650 reveals transient contact and transfer between the mitochondrial network and red-only dots. (A) Full frame of video S3 at time 0:35 with zoomed-in area indicated (white box) for the selected time points (small panels, right). White arrows in the full frame show examples of red-only dots in close proximity with tubular mitochondria. White arrowheads in the small panels highlight a red-only dot approaching and contacting the mitochondrial network, producing a brief colocalized signal (yellow arrowheads) around time 2:34. At time 2:55, EGFP fluorescence has diminished, and the structure again appears red-only (white arrowheads). In subsequent frames, small protrusions of EGFP fluorescence (notched yellow arrowheads at time points 4:00 and 4:08) can be seen upon close inspection to extend from the mitochondrion and into the red-only dot, and then rapidly disappear (see also video S3). (B) Full frame of video S4 at time 1:47 with zoomed-in area indicated (white box) as in (A). White arrowheads indicate a red-only dot approaching the mitochondrial network from time point 2:07. The EGFP signal remains detectable within the red-only dot for a few seconds around time 2:19 (yellow arrowheads) and then disappears around time point 2:22 (see also video S4). (C) Full frame of video S5 at time 0:06 with zoomed-in area indicated (white box) as in (A) and (B). White arrowheads indicate a red-only dot which encounters a tubular mitochondrion from time point 0:24 (yellow arrowheads). In subsequent frames, small protrusions of EGFP fluorescence can be seen to extend into the red-only dots (notched yellow arrowheads at time 1:36, 1:55, 2:03, and 2:12). An enlarged partial view (white boxes) of the mCherry and EGFP channels is shown below each time point. Scale bars: 10 μm (full frames), 2 μm (small panels), and 1 μm (enlarged views).
Figure 7.
Figure 7.
Correlative light and electron microscopy of mCherry-EGFP- SYNJ2BP-TM H9c2 cells reveals the ultrastructure of red-only dots. (A) Red-only dots in cells grown in media containing glucose correspond to autophagic vacuoles with a diverse internal milieu at varying stages of cargo engulfment and maturation (A iv-v). Meanwhile, mitochondria displaying both EGFP and mCherry fluorescence have a normal tubular morphology with distinct inner and outer membranes and intact cristae (A vi). (B) Structures corresponding to red-only dots in galactose adapted cells are more uniform and less electron dense. Imaging of consecutive ultrathin sections (B iv-vi) revealed that these structures are in close proximity (or may be continuous) with membranes of the endoplasmic reticulum (ER) and mitochondria (M). Also note apparent lysosomes (L) at the periphery of red-only structures (*). Scale bars: 10 μm (A i and B i), 2 μm (A ii and B ii), 1 μm (B iv and B v) and 0.5 μm (A iv-vi and B vi). (C) Serial section TEM imaging of a red-only dot shows a single membrane vesicle with apparent remnants of mitochondria and a multilamellar lysosome. Scale bar: 0.3 μm.
Figure 8.
Figure 8.
Effect of siRNA knockdowns on mitophagic flux and evaluation of LC3 involvement by proximity ligation assay (PLA). (A) Representative widefield images of mCherry-EGFP- SYNJ2BP-TM H9c2 cells analyzed 48 h after transfection with scrambled siRNA (siScr) or siRNA against Ulk1, Atg7, Rab9a, Rab7a or Rab5a respectively. (B) Quantification of the effect of 48 h siRNA knockdowns by assessment of number of red-only dots per cell in cells containing red-only dots in control conditions against a 12 h PepA and E64d treatment. The data is presented as mean ± SEM from 3 independent experiments, with more than 100 cells per condition (total number analyzed per experiment was over 1200 cells). (C) Western blots showing the expression levels of the siRNA targeted proteins in control and siRNA treated cells for verification of successful knockdown. (D) Representative confocal images of detected PLA puncta (white) using anti-MAP1LC3B and anti-PDHA1 antibody during normal (GLU) and galactose (GAL) adapted conditions. The enlarged boxes display the PLA puncta on the mitochondria network and small mitochondrial fragments but their absence on red-only dots. (E) Quantification of the number of PLA puncta per cell in 10 images (with more than 50 cells in total) per condition from two independent experiments. The individual datapoints are per frame cell averages. * p < 0.05, ** p < 0.01, *** p < 0.001 and **** p < 0.0001. Scale bar: 10 μm.

References

    1. Zorov DB, Juhaszova M, Sollott SJ.. Mitochondrial reactive oxygen species (ROS) and ROS-induced ROS release. Physiol Rev. 2014. Jul;94(3):909–950. Pubmed PMID: 24987008. doi: 10.1152/physrev.00026.2013 - DOI - PMC - PubMed
    1. Pathak T, Trebak M. Mitochondrial Ca2+ signaling. Pharmacol Ther. 2018. Dec;192:112–123. Pubmed PMID: 30036491. doi: 10.1016/j.pharmthera.2018.07.001 - DOI - PMC - PubMed
    1. Dietz JV, Fox JL, Khalimonchuk O. Down the Iron path: mitochondrial Iron Homeostasis and Beyond. Cells. 2021. Aug 25;10(9):2198. Pubmed PMID: 34571846. doi: 10.3390/cells10092198 - DOI - PMC - PubMed
    1. Sandhir R, Halder A, Sunkaria A. Mitochondria as a centrally positioned hub in the innate immune response. Biochim Biophys Acta Mol Basis Dis. 2017. May;1863(5):1090–1097. Pubmed PMID: 27794419. doi: 10.1016/j.bbadis.2016.10.020 - DOI - PubMed
    1. Bock FJ, Tait SWG. Mitochondria as multifaceted regulators of cell death. Nat Rev Mol Cell Biol. 2020. Feb;21(2):85–100. Pubmed PMID: 31636403. doi: 10.1038/s41580-019-0173-8 - DOI - PubMed

Publication types

MeSH terms

LinkOut - more resources