. 2023 Jul 5;80(8):196.
doi: 10.1007/s00018-023-04845-1.

Epigenetic silencing of OR and TAS2R genes expression in human orbitofrontal cortex at early stages of sporadic Alzheimer's disease

Affiliations

Epigenetic silencing of OR and TAS2R genes expression in human orbitofrontal cortex at early stages of sporadic Alzheimer's disease

Victoria Cunha Alves et al. Cell Mol Life Sci. .

Abstract

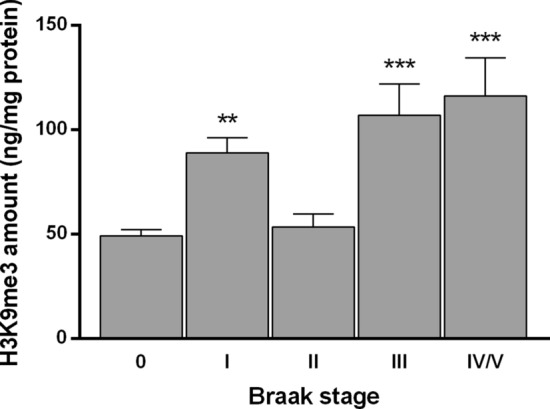
Modulation of brain olfactory (OR) and taste receptor (TASR) expression was recently reported in neurological diseases. However, there is still limited evidence of these genes' expression in the human brain and the transcriptional regulation mechanisms involved remain elusive. We explored the possible expression and regulation of selected OR and TASR in the human orbitofrontal cortex (OFC) of sporadic Alzheimer's disease (AD) and non-demented control specimens using quantitative real-time RT-PCR and ELISA. Global H3K9me3 amounts were measured on OFC total histone extracts, and H3K9me3 binding at each chemoreceptor locus was examined through native chromatin immunoprecipitation. To investigate the potential interactome of the repressive histone mark H3K9me3 in OFC specimens, native nuclear complex co-immunoprecipitation (Co-IP) was combined with reverse phase-liquid chromatography coupled to mass spectrometry analysis. Interaction between H3K9me3 and MeCP2 was validated by reciprocal Co-IP, and global MeCP2 levels were quantitated. We found that OR and TAS2R genes are expressed and markedly downregulated in OFC at early stages of sporadic AD, preceding the progressive reduction in their protein levels and the appearance of AD-associated neuropathology. The expression pattern did not follow disease progression suggesting transcriptional regulation through epigenetic mechanisms. We discovered an increase of OFC global H3K9me3 levels and a substantial enrichment of this repressive signature at ORs and TAS2Rs proximal promoter at early stages of AD, ultimately lost at advanced stages. We revealed the interaction between H3K9me3 and MeCP2 at early stages and found that MeCP2 protein is increased in sporadic AD. Findings suggest MeCP2 might be implicated in OR and TAS2R transcriptional regulation through interaction with H3K9me3, and as an early event, it may uncover a novel etiopathogenetic mechanism of sporadic AD.

Keywords: Alzheimer’s disease; Histone methylation; MeCP2; Olfactory receptors; Orbitofrontal cortex; Taste receptors.


Conflict of interest statement

The authors have no relevant financial or non-financial interests to disclose.

Figures

Fig. 1
Fig. 1
Ideogram of the distribution of the selected OR and TASR genes on the human genome (a) and ORs (b) and TAS2Rs (c) mRNA relative levels in OFC specimens from non-demented control samples. a Red lines indicate the genomic location of each selected gene, the cytogenetic band of each locus is shown on the left, and its corresponding gene name (symbol) is indicated on the right. Chromosome number is presented on top. The cytogenetic representation of the selected chromosomes of the human genome (GRCh38.p12) was adapted from NCBI’s Genome Decoration page (https://www.ncbi.nlm.nih.gov/genome/tools/gdp). b, c ORs (b) and TAS2Rs (c) mRNA relative levels were normalized to GAPDH. Error bars represent the standard error of the mean. Nonparametric Mann–Whitney U test (two-tailed) was used to compare the differences in the transcripts’ relative levels between male (n = 13) and female (n = 12) groups. Statistical significance is expressed as **P < 0.01, and ***P < 0.001 compared to male group
Fig. 2
Fig. 2
Olfactory and Taste Receptors expression on post-mortem OFC specimens from several Braak stages of sporadic AD compared to age-matched non-demented controls. ae mRNA relative expression: a OR2K2. b OR2H2. c OR1L8 separated by sex. d TAS2R14. e TAS2R5 separated by sex. mRNA relative levels were normalized to GAPDH. fj protein levels: f OR2K2. g OR2H2. h OR1L8 separated by sex. i TAS2R14. j TAS2R5 separated by sex. Error bars represent the standard error of the mean. Statistical significance is expressed as *P < 0.05, **P < 0.01, ***P < 0.001, and ****P < 0.0001 compared to age-matched non-demented controls (Braak stage 0), Kruskal–Wallis H test followed by Dunn's multiple comparisons post-hoc test. Sporadic AD samples, n = 49 and age-matched non-demented controls, n = 25
Fig. 3
Fig. 3
Global H3K9me3 amount (ng/mg protein) on post-mortem OFC histone extracts from sporadic AD. Error bars represent the standard error of the mean. Statistical significance is expressed as **P < 0.01, and ***P < 0.001 compared to age-matched non-demented controls (Braak stage 0), Kruskal–Wallis H test followed by Dunn’s multiple comparisons post-hoc test. Sporadic AD, n = 49 and age-matched non-demented controls, n = 24
Fig. 4
Fig. 4
Native chromatin immunoprecipitation (N-ChIP) and quantitative real-time PCR analysis of H3K9me3 at each genomic location of interest. a Proximal promoter of each receptor gene. b Coding region of each receptor gene. Results are reported as the percentage of the input chromatin that is precipitated at each region of interest. Mock denotes negative control. Error bars represent the standard error of the mean. Statistical significance is expressed as *P < 0.05, **P < 0.01, and ***P < 0.001 compared to control, and as ###P < 0.001, and ####P < 0.0001 compared to Braak stage I group, Mann–Whitney U tests (two-tailed). Non-demented controls, n = 15; Braak I, n = 14 and Braak IV/V, n = 10
Fig. 5
Fig. 5
H3K9me3 interactome identification by mass spectrometry-based proteomics and co-immunoprecipitation validation. ac H3K9me3 immunoprecipitation was performed in pooled samples from Braak I and V stages, and proteins were identified by mass spectrometry-based proteomics. Gene ontology (GO) annotation on biological process for proteins identified uniquely in Braak I (a), common to Braak I and V (b) and Braak V only (c). d Validation of H3K9me3–MeCP2 interaction by reciprocal nuclear complex co-immunoprecipitations. Nuclear fractions from OFC specimens of 3 pooled Braak I (male samples) were used for H3K9me3, MeCP2, and IgG negative control IP. The blots were cropped and full-length blots are presented in Supplementary Fig. 3. e Representative immunoblot of MeCP2 protein expression in nuclear fractions from pooled OFC samples, and Histone H3 as nuclear loading control. The blots were cropped and full-length blots are presented in Supplementary Fig. 3. A pool of samples (P) was loaded to compare across different assays. M, Male; F, Female. f, g Quantification of MeCP2 protein levels separated by sex (f) and combined (g). Stain-free total protein was used for total protein normalization. Statistical significance is expressed as **P < 0.01 compared to control (Braak stage 0), Kruskal–Wallis H test followed by Dunn’s multiple comparisons post-hoc test. Non-demented controls, n = 18; Braak I, n = 15 and Braak V, n = 9

References

    1. Querfurth HW, LaFerla FM. Alzheimer’s disease: mechanism of disease. N Engl J Med. 2010;362(4):329–344. doi: 10.1056/NEJMra0909142. - DOI - PubMed
    1. Braak H, Braak E. Neuropathological staging of Alzheimer-related changes. Acta Neuropathol. 1991;82:239–259. doi: 10.1007/BF00308809. - DOI - PubMed
    1. Braak H, Alafuzoff I, Arzberger T, Kretzschmar H, Tredici K. Staging of Alzheimer disease-associated neurofibrillary pathology using paraffin sections and immunocytochemistry. Acta Neuropathol. 2006;112(4):389–404. doi: 10.1007/s00401-006-0127-z. - DOI - PMC - PubMed
    1. Zhong S, Zhang S, Fan X, Wu Q, Yan L, Dong J, et al. A single-cell RNA-seq survey of the developmental landscape of the human prefrontal cortex. Nature. 2018;555(7697):524–528. doi: 10.1038/nature25980. - DOI - PubMed
    1. Nestor PG, Nakamura M, Niznikiewicz M, Thompson E, Levitt JJ, Choate V, et al. In search of the functional neuroanatomy of sociality: Mri subdivisions of orbital frontal cortex and social cognition. Soc Cogn Affect Neurosci. 2013;8(4):460–467. doi: 10.1093/scan/nss018. - DOI - PMC - PubMed