. 2023 Aug;70(8):854-864.
doi: 10.1109/TUFFC.2023.3292595. Epub 2023 Aug 2.

Acoustoelectric Time-Reversal for Ultrasound Phase-Aberration Correction

Acoustoelectric Time-Reversal for Ultrasound Phase-Aberration Correction

Chet Preston et al. IEEE Trans Ultrason Ferroelectr Freq Control. 2023 Aug.

Abstract

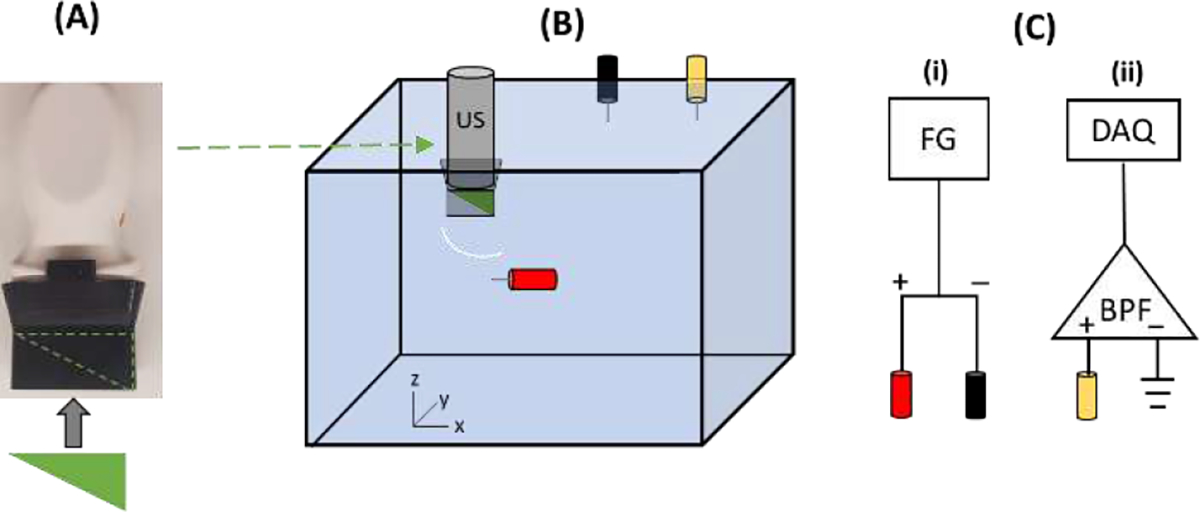
Acoustoelectric imaging (AEI) is a technique that combines ultrasound (US) with radio frequency recording to detect and map local current source densities. This study demonstrates a new method called acoustoelectric time reversal (AETR), which uses AEI of a small current source to correct for phase aberrations through a skull or other US-aberrating layers with applications to brain imaging and therapy. Simulations conducted at three different US frequencies (0.5, 1.5, and 2.5 MHz) were performed through media layered with different sound speeds and geometries to induce aberrations of the US beam. Time delays of the acoustoelectric (AE) signal from a monopole within the medium were calculated for each element to enable corrections using AETR. Uncorrected aberrated beam profiles were compared with those after applying AETR corrections, which demonstrated a strong recovery (29%-100%) of lateral resolution and increases in focal pressure up to 283%. To further demonstrate the practical feasibility of AETR, we further conducted bench-top experiments using a 2.5 MHz linear US array to perform AETR through 3-D-printed aberrating objects. These experiments restored lost lateral restoration up to 100% for the different aberrators and increased focal pressure up to 230% after applying AETR corrections. Cumulatively, these results highlight AETR as a powerful tool for correcting focal aberrations in the presence of a local current source with applications to AEI, US imaging, neuromodulation, and therapy.


Figures

Figure 1:
Figure 1:
(A) Schematic of acoustoelectric time reversal (AETR) with one element emitting a spherical US pulse to measure the time of flight (ToF) between it and an electrical target. (B) Representative AE signal detected for one of the elements during the delay acquisition process. (C) The detected AE signal over depth for each of the 96 elements on the US transducer. (D) Normalized magnitude of Dj, the cross-correlation function between the AE signal of one element Pj and that of the template element, R. (E) Profile of time-reversed differences per element relative to the element with shortest latency (e.g., from wedge aberrator).
Figure 2:
Figure 2:
A and B) The three-layered media used during simulation, as well as the density (A) and sound speed (B) values for the water, skull, and brain layers. Image Aii also depicts the location of the US transducer elements in yellow and focus in red. C) Simulation outputs for (i) the pressure waveform of a 2.5 MHz beam, (ii) the static current and (iii) the recorded AE signal generated by their interaction. To include dispersion, the alpha power used for all layers was 1.2.
Figure 3:
Figure 3:
A) Photograph of the 96 element 2.5 MHz US transducer with custom 3D-printed waveguide used in the study. The aberrators were inserted into the waveguide. B) Cartoon of the experimental setup. The US probe was positioned over the anode (red) with different aberrators inserted between the two (wedge depicted) and representation of a spherical wave emitted from a single element after passing through the wedge aberrator. The black and yellow electrodes represent cathode and recording electrodes. C) Connection diagram for stimulation (i) and recording AE signals (ii). FG = function generator, DAQ = data acquisition, BPF = bandpass filter.
Figure 4:
Figure 4:
(A) Standard geometric and (B) AETR-derived delay profiles in s for the 96 elements when focusing to z = 45 mm at 41 equally spaced lateral positions between −5 and 5 mm. Each line represents a different lateral focal position.
Figure 5:
Figure 5:
Simulation results for each aberrator using a 2.5 MHz US transducer. A) Delay profiles for each medium. Solid black line indicates uncorrected delays calculated for homogenous brain media; red-hashed line indicates corrected delays from AETR. B) and C) Resulting pressure envelopes at the focal point when using the uncorrected (B) or AETR corrected (C) delays. D) Plots of the lateral beam profiles through the focal point for the uncorrected (solid black) and AETR corrected (red-hashed) delay profiles.
Figure 6:
Figure 6:
Simulation results for each aberrator using a 1.5 MHz US transducer. A) Delay profiles used for each medium. Solid black line indicates uncorrected delays calculated for homogenous brain media; red-hashed line indicates corrected delays from AETR and the resulting pressure envelopes at the focal point for the uncorrected (B) and AETR corrected (C) delays. D) Lateral beam profile plots through the focal point for the uncorrected (solid black) and AETR corrected (red-hashed) delay profiles.
Figure 7:
Figure 7:
Simulation results for each aberrator using a 0.5 MHz US transducer. A) Delay profiles used for each medium. Solid black line indicates uncorrected delays calculated for homogenous brain media; red-hashed line indicates corrected delays from AETR and the resulting pressure envelopes at the focal point when using the uncorrected (B) and AETR corrected (C) delays. D) Lateral beam profile plots through the focal point for the uncorrected (solid black) and AETR corrected (red-hashed) delay profiles.
Figure 8:
Figure 8:
Improvement to image quality after AETR for each aberrating condition and US frequency expressed as percent. # within bar denotes actual improvement, if >200%.
Figure 9:
Figure 9:
AE B-Mode images from a monopole generated by the needle electrode. Each column contains the images from a different aberrator indicated at the top of each column. Each row relates to a different focusing condition with the “control” representing the image of the current source placed at a similar location in space in water without the abberrator. Green scale bars in top left image denote 2 mm.
Figure 10:
Figure 10:
AETR delay profiles calculated for each aberrator.
Figure 11:
Figure 11:
Experimental improvement in imaging metrics after AETR for each aberrator at 2.5MHz.

References

    1. Anderson ME, McKeag MS & Trahey GE The impact of sound speed errors on medical ultrasound imaging. J. Acoust. Soc. Am. 107, 3540–3548 (2000). - PubMed
    1. O’Donnell M & Flax SW Phase aberration measurements in medical ultrasound: Human studies. Ultrason. Imaging 10, 1–11 (1988). - PubMed
    1. Ammi AY et al. Characterization of Ultrasound Propagation Through Ex-vivo Human Temporal Bone HHS Public Access Author manuscript. Ultrasound Med Biol 34, 1578–1589 (2008). - PMC - PubMed
    1. Legon W, Bansal P, Tyshynsky R, Ai L & Mueller JK Transcranial focused ultrasound neuromodulation of the human primary motor cortex. Sci. Rep. 8, 10007 (2018). - PMC - PubMed
    1. Kubanek J Neuromodulation with transcranial focused ultrasound. Neurosurg. Focus 44, 14 (2018). - PMC - PubMed