. 2023 Jul 25;42(7):112715.
doi: 10.1016/j.celrep.2023.112715. Epub 2023 Jul 4.

Global and tissue-specific aging effects on murine proteomes

Affiliations

Global and tissue-specific aging effects on murine proteomes

Gregory R Keele et al. Cell Rep. .

Abstract

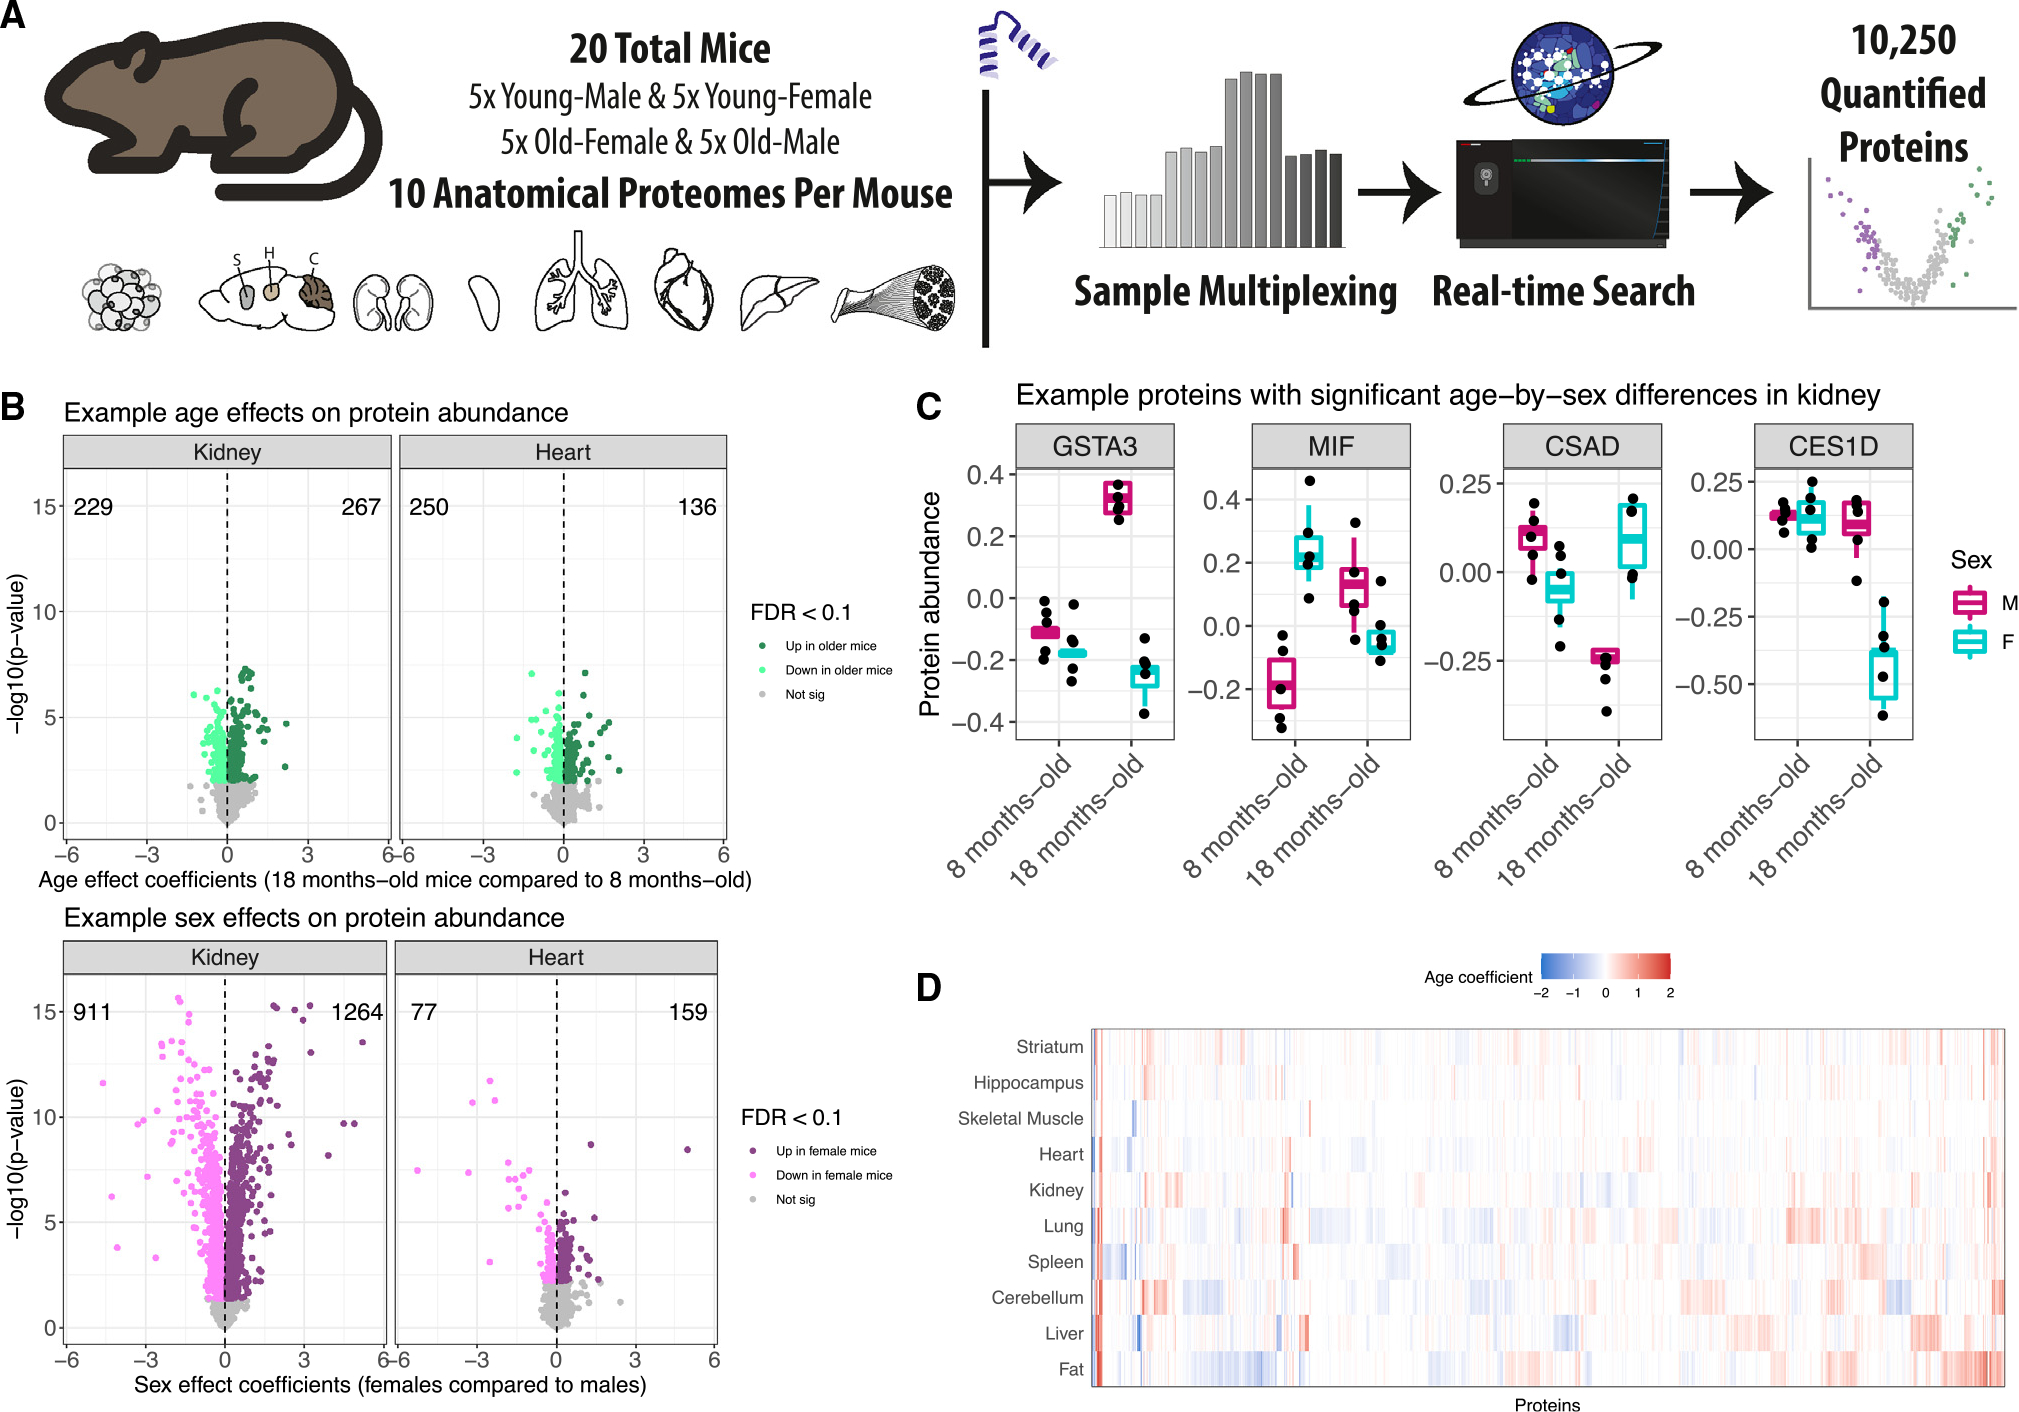
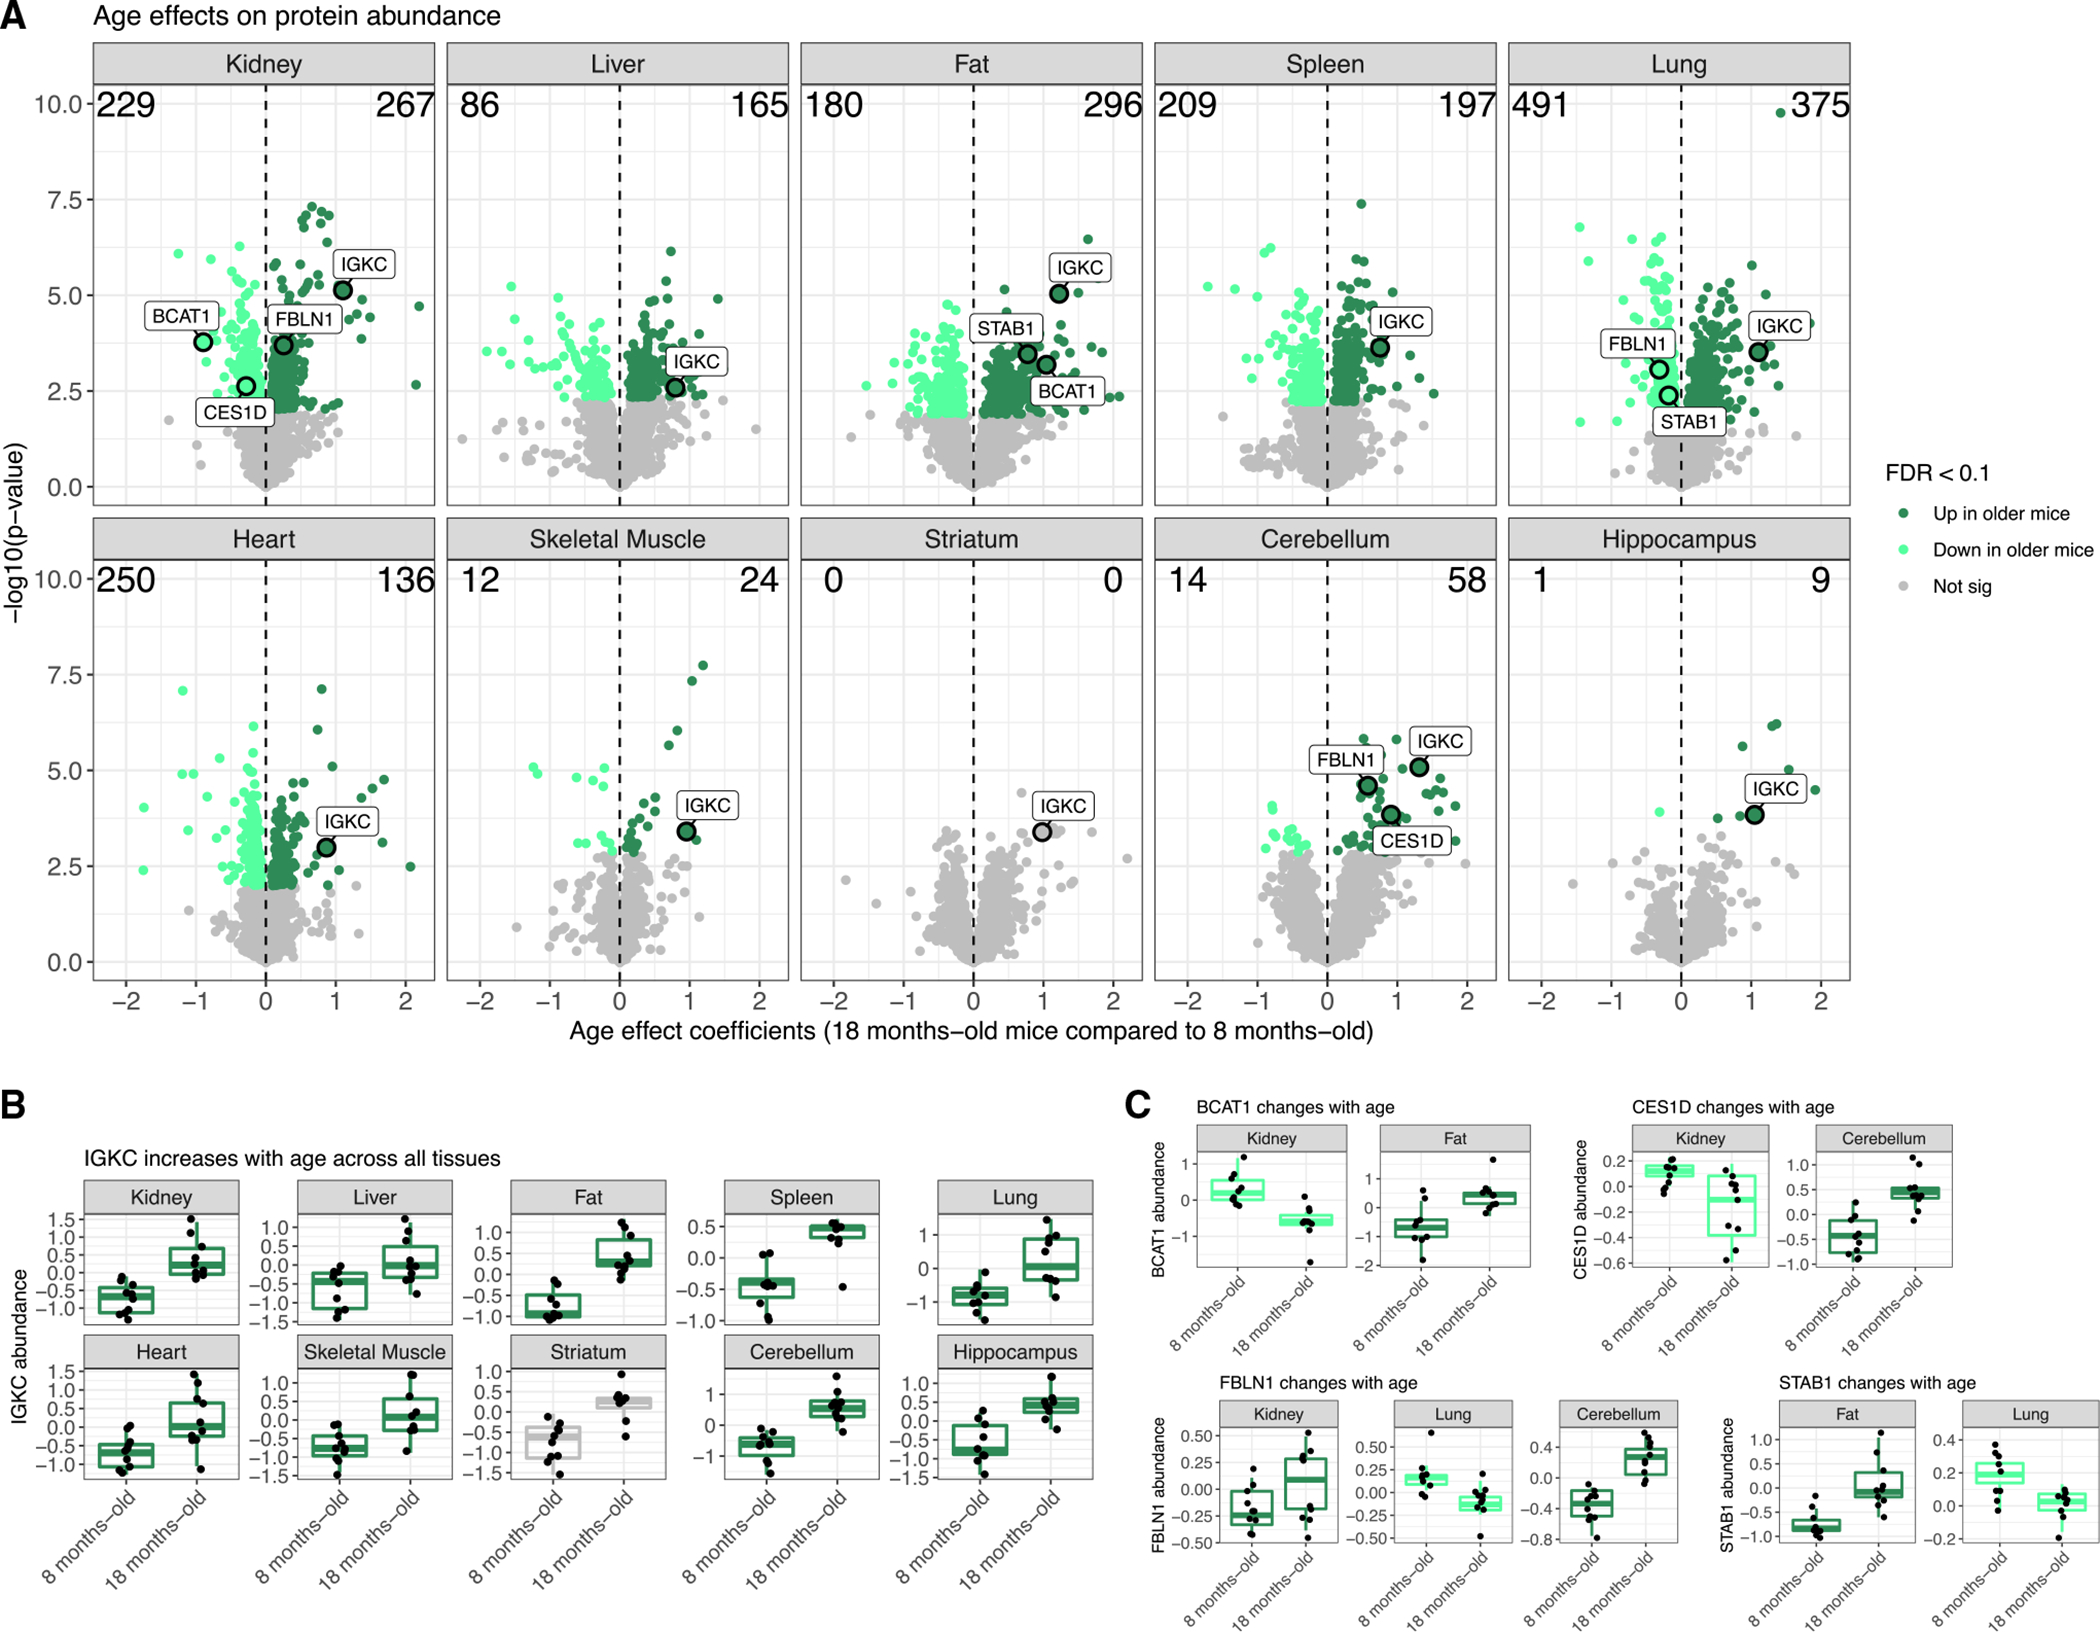
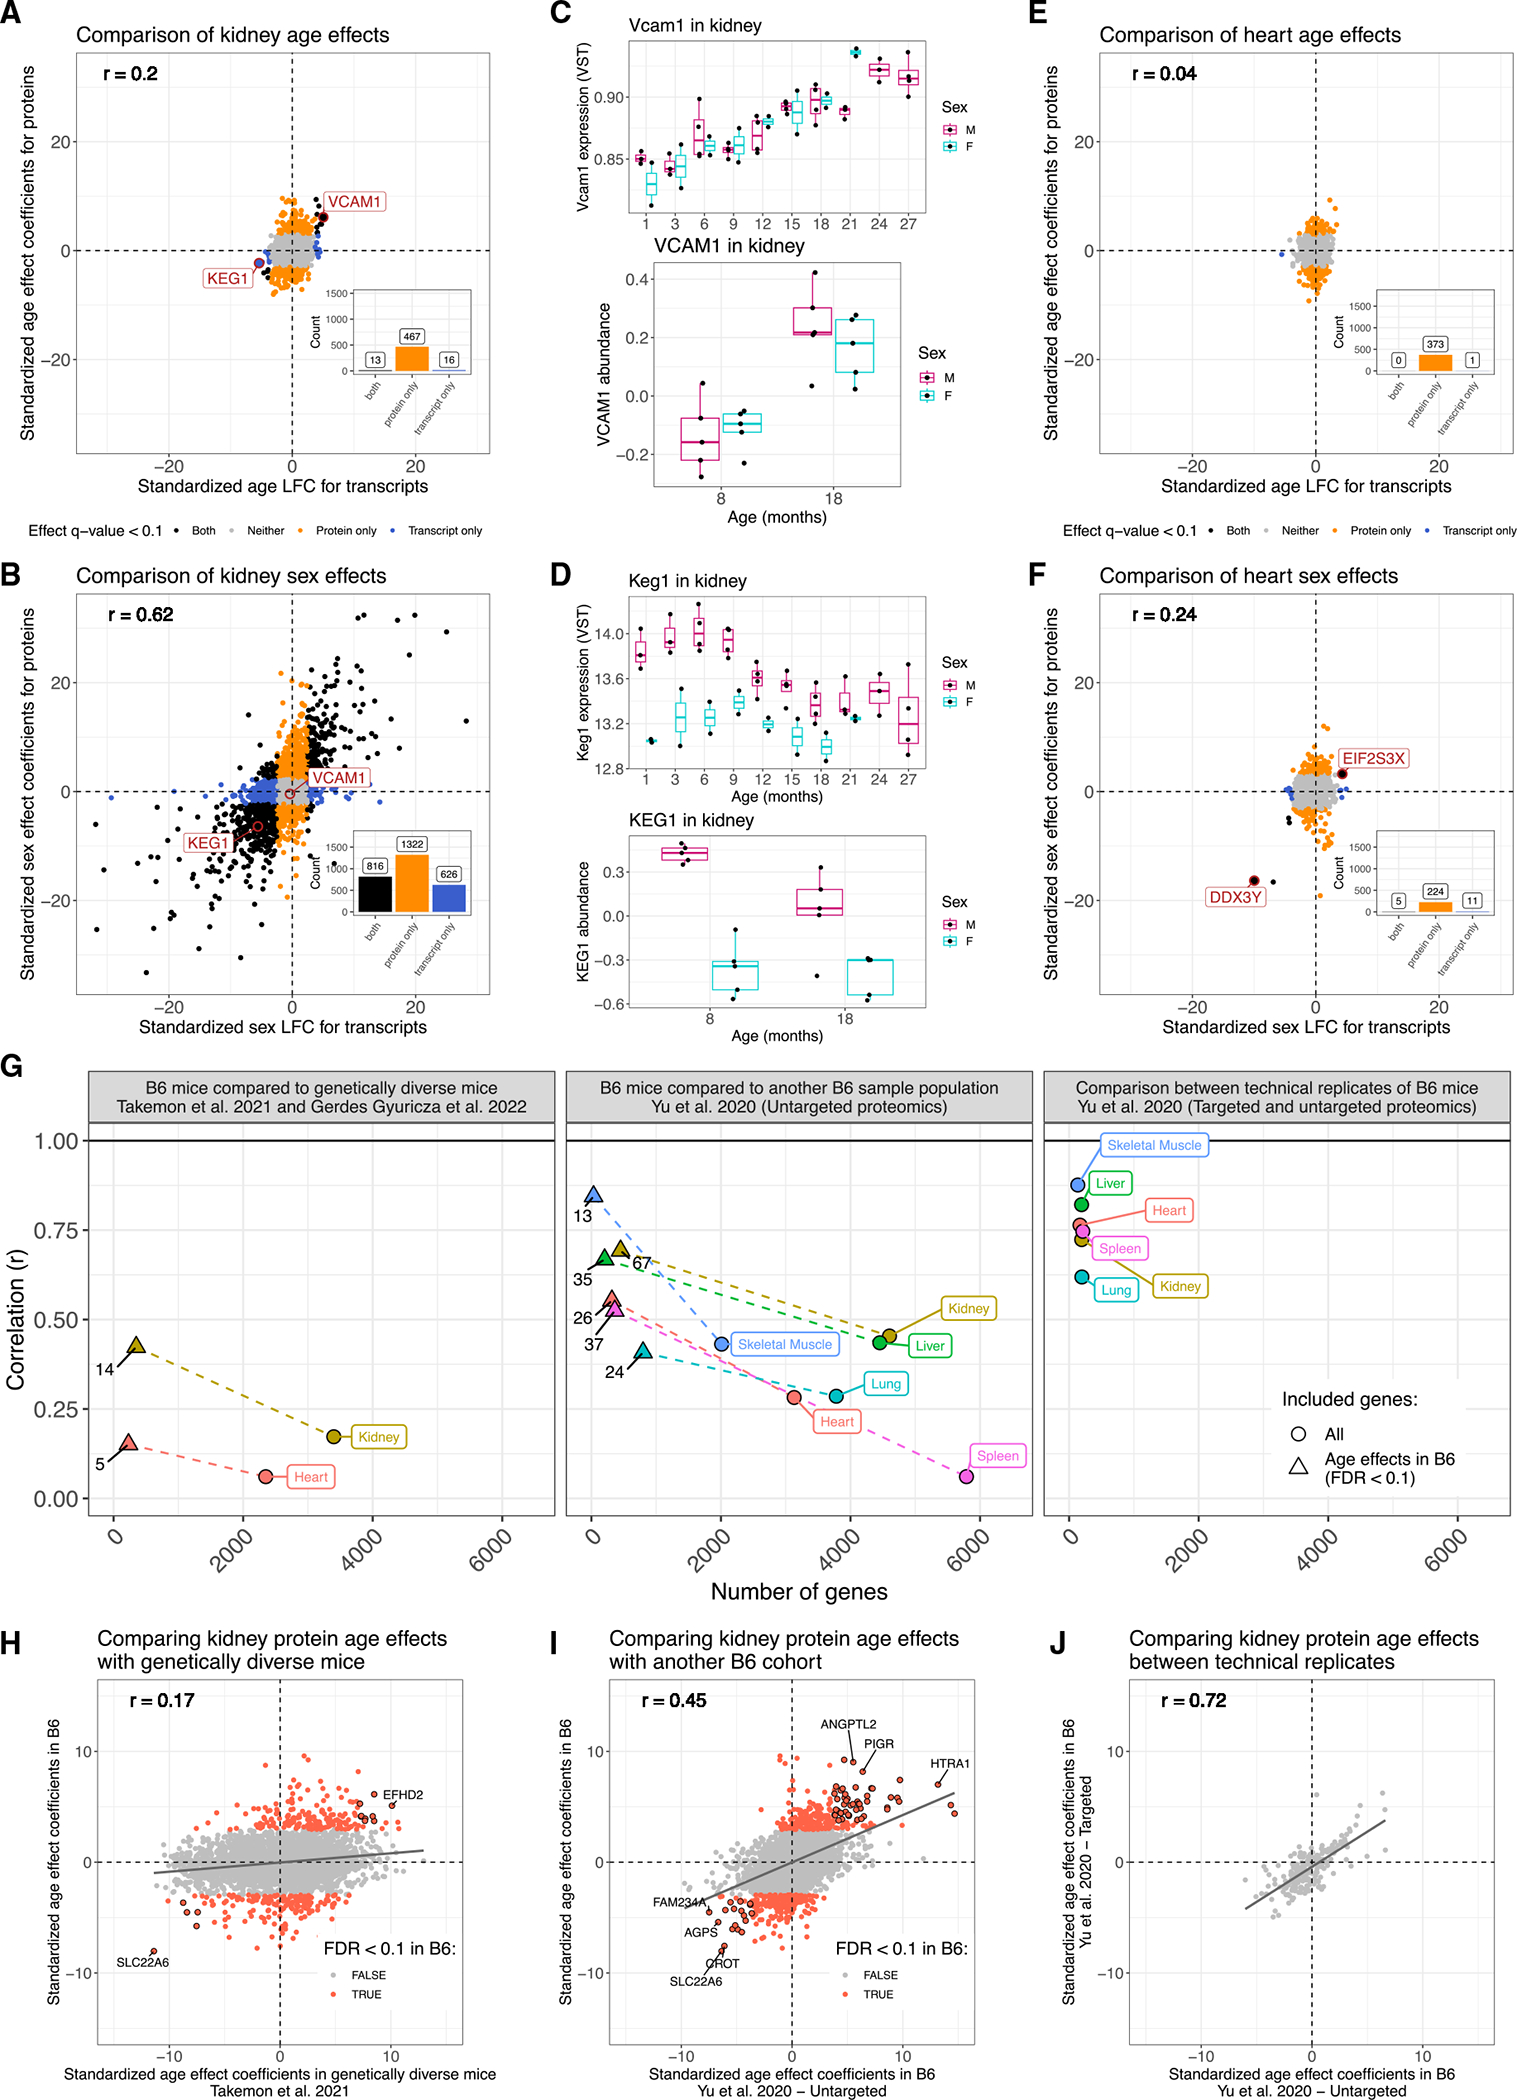
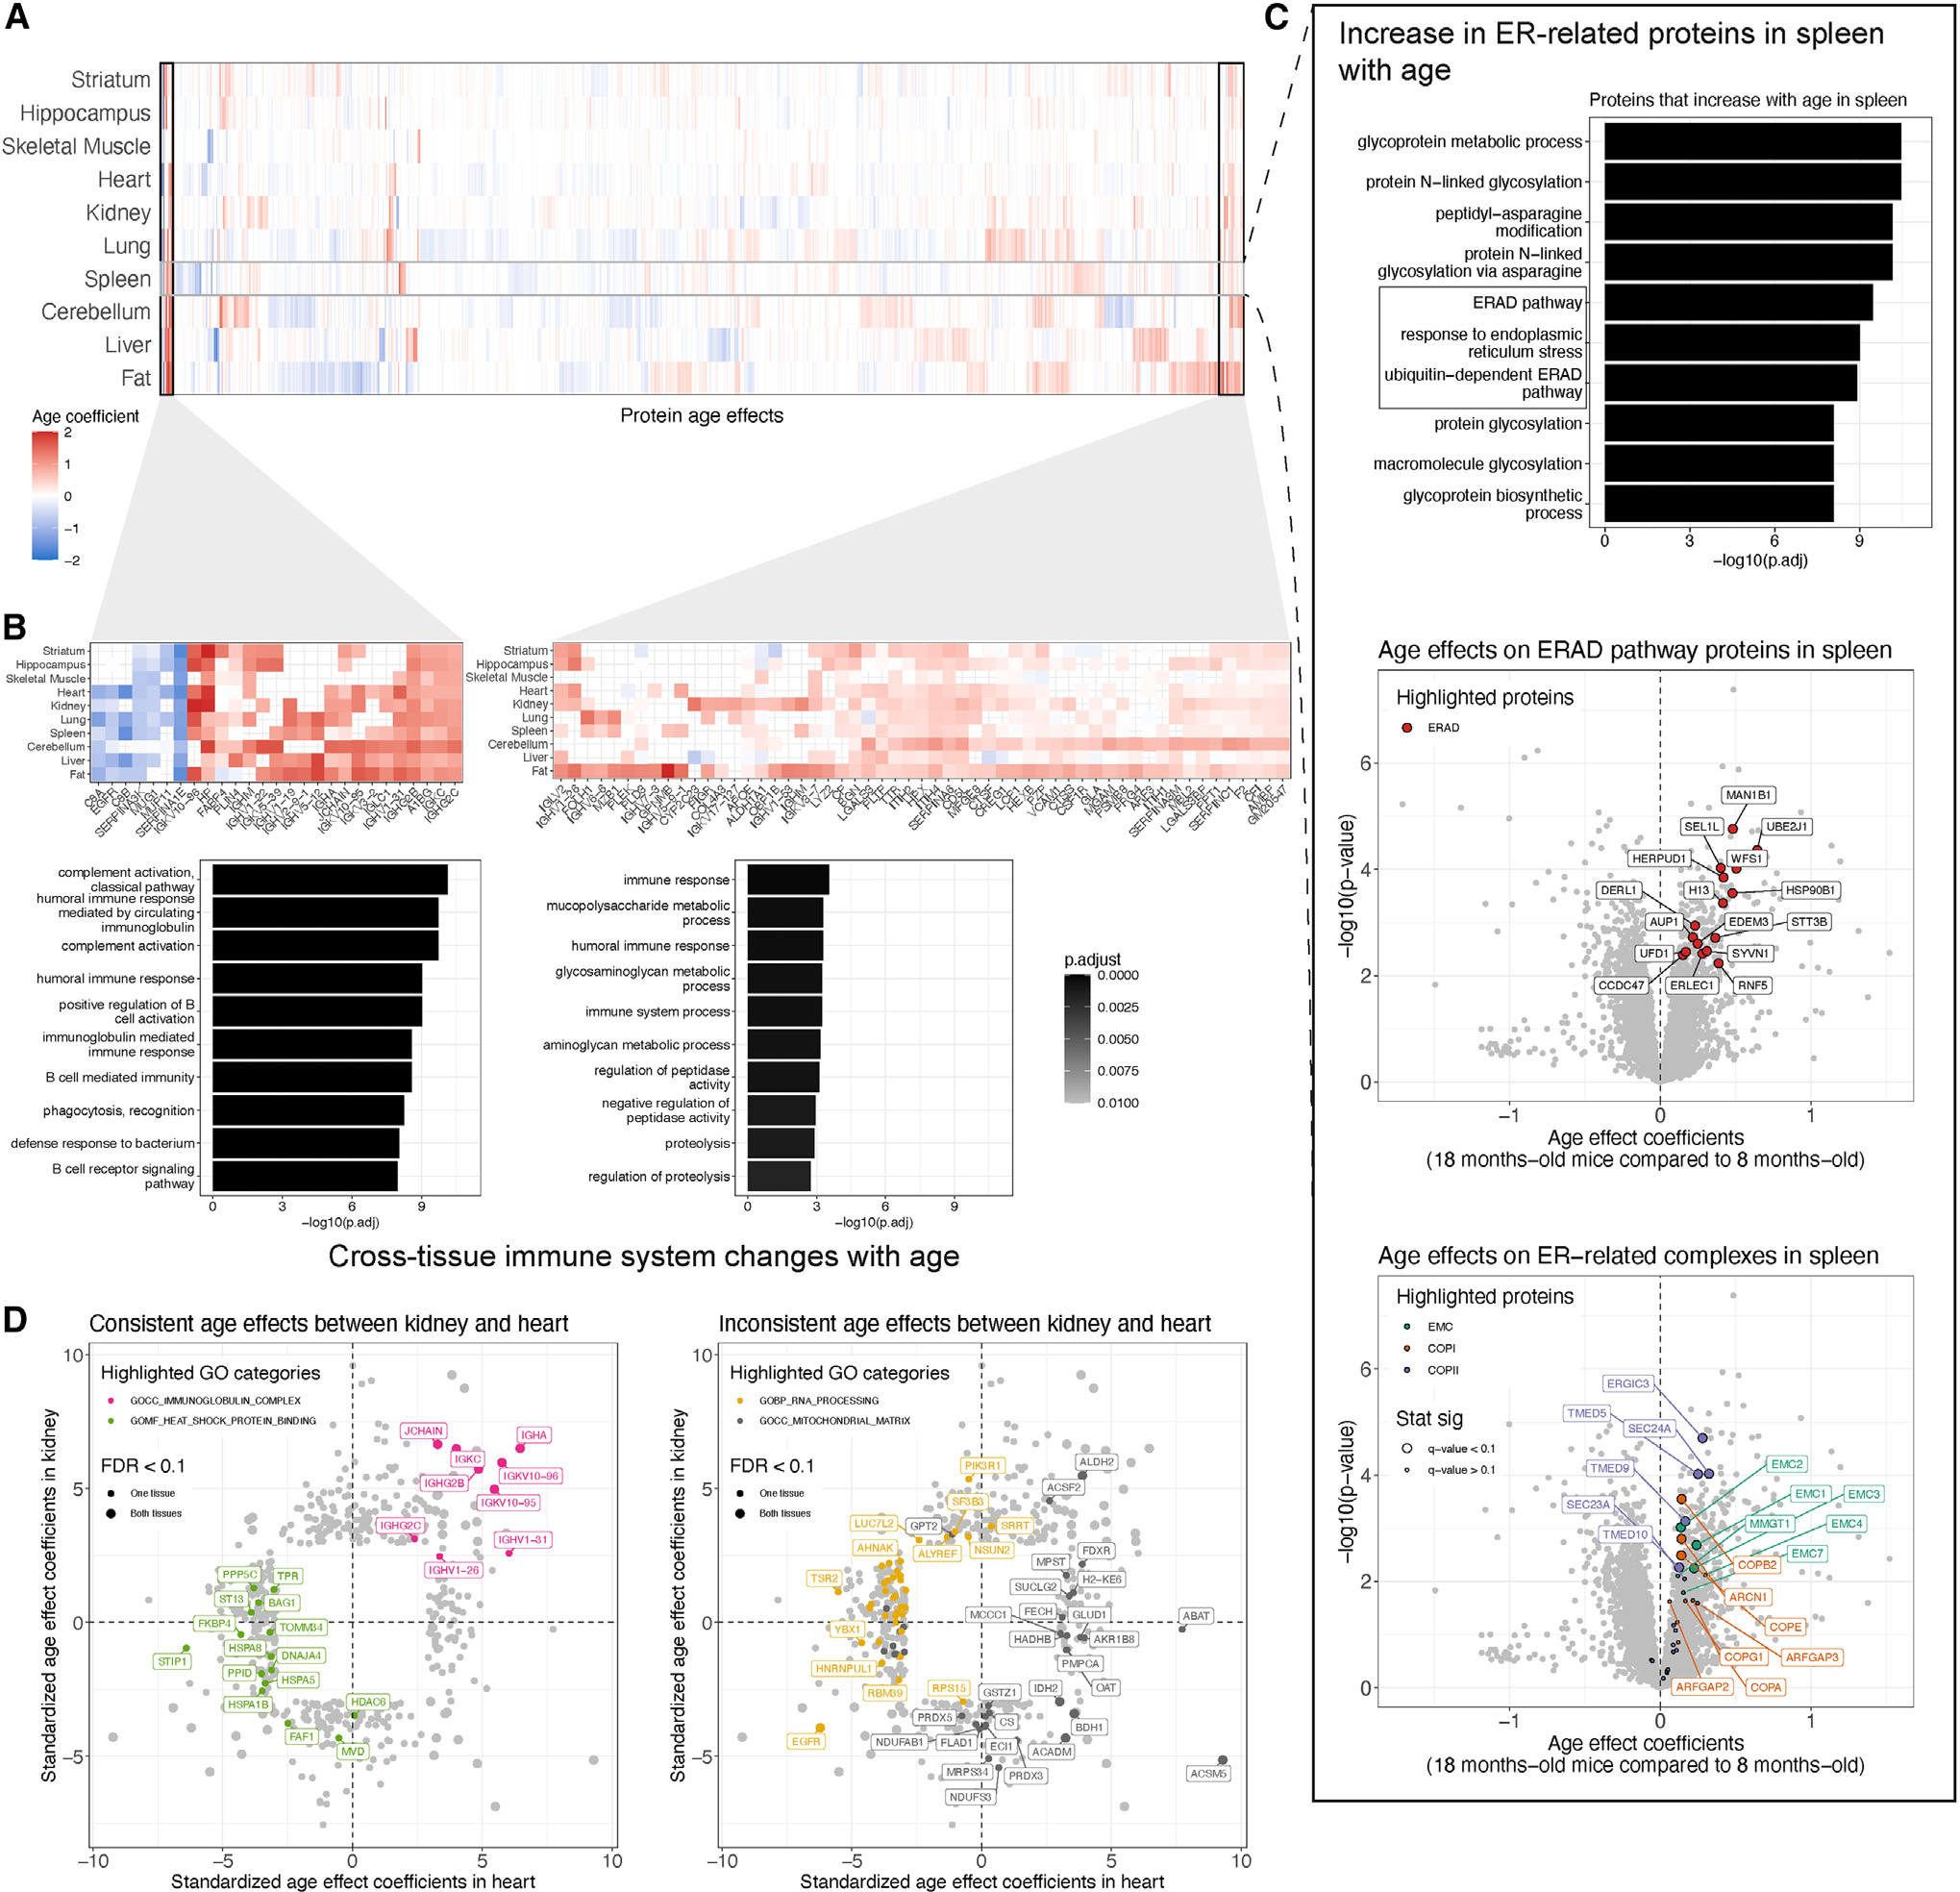
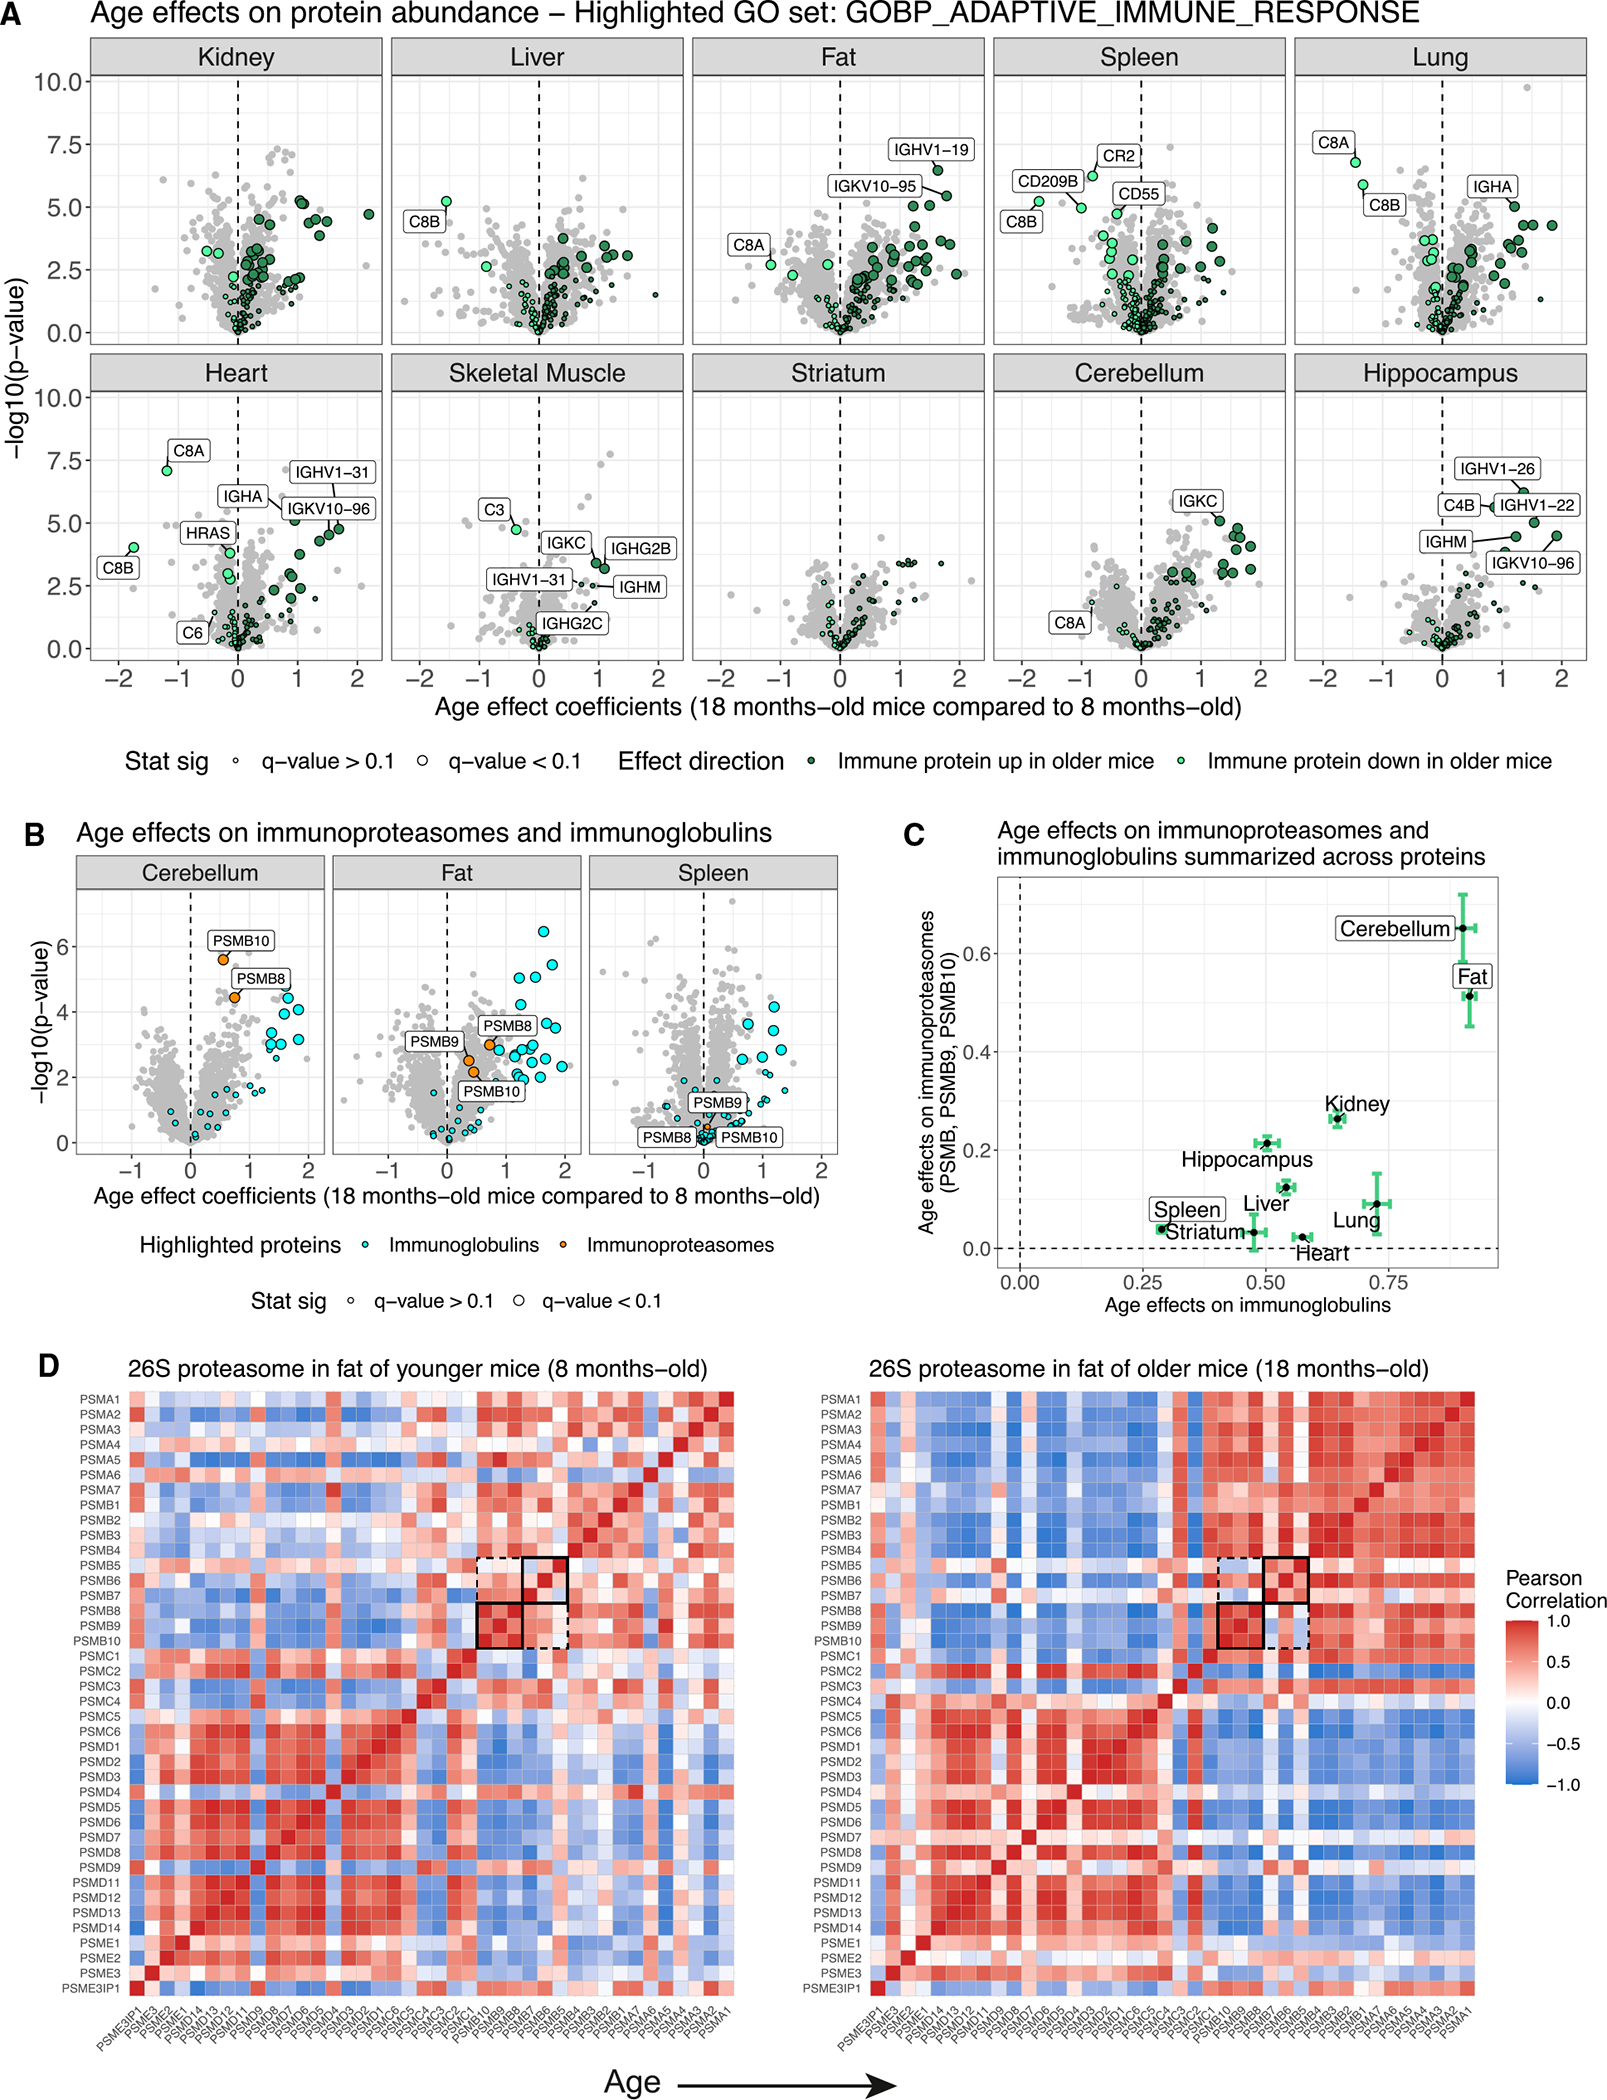
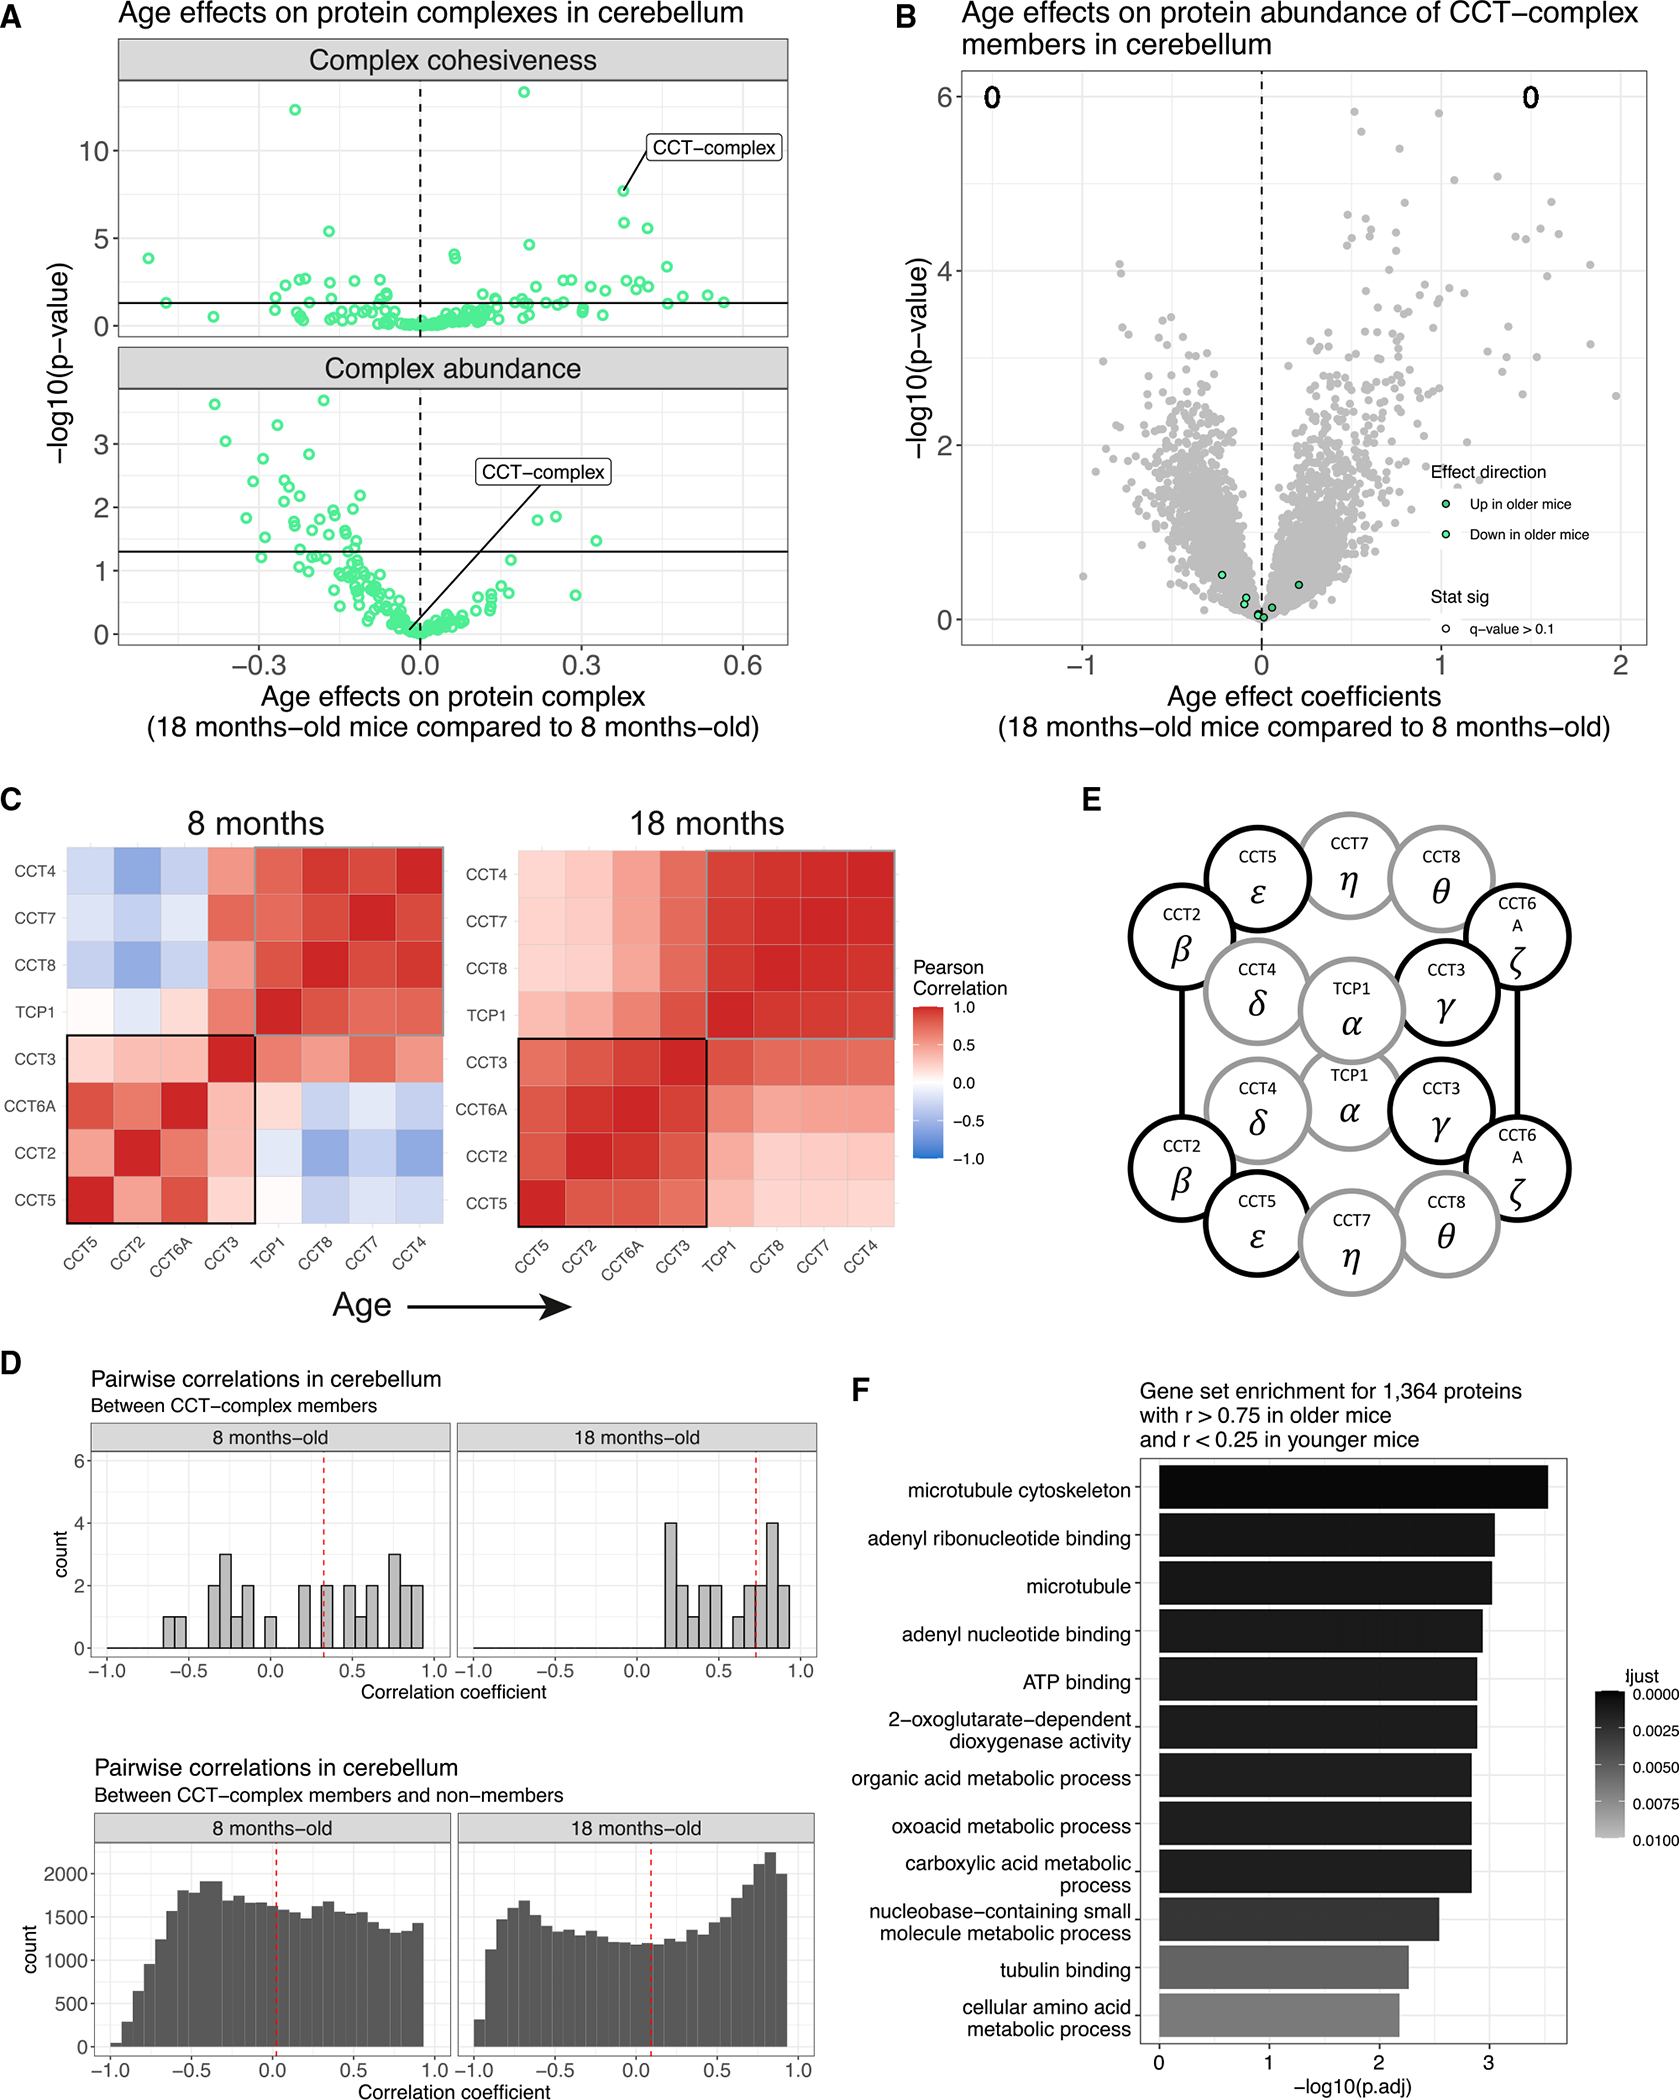
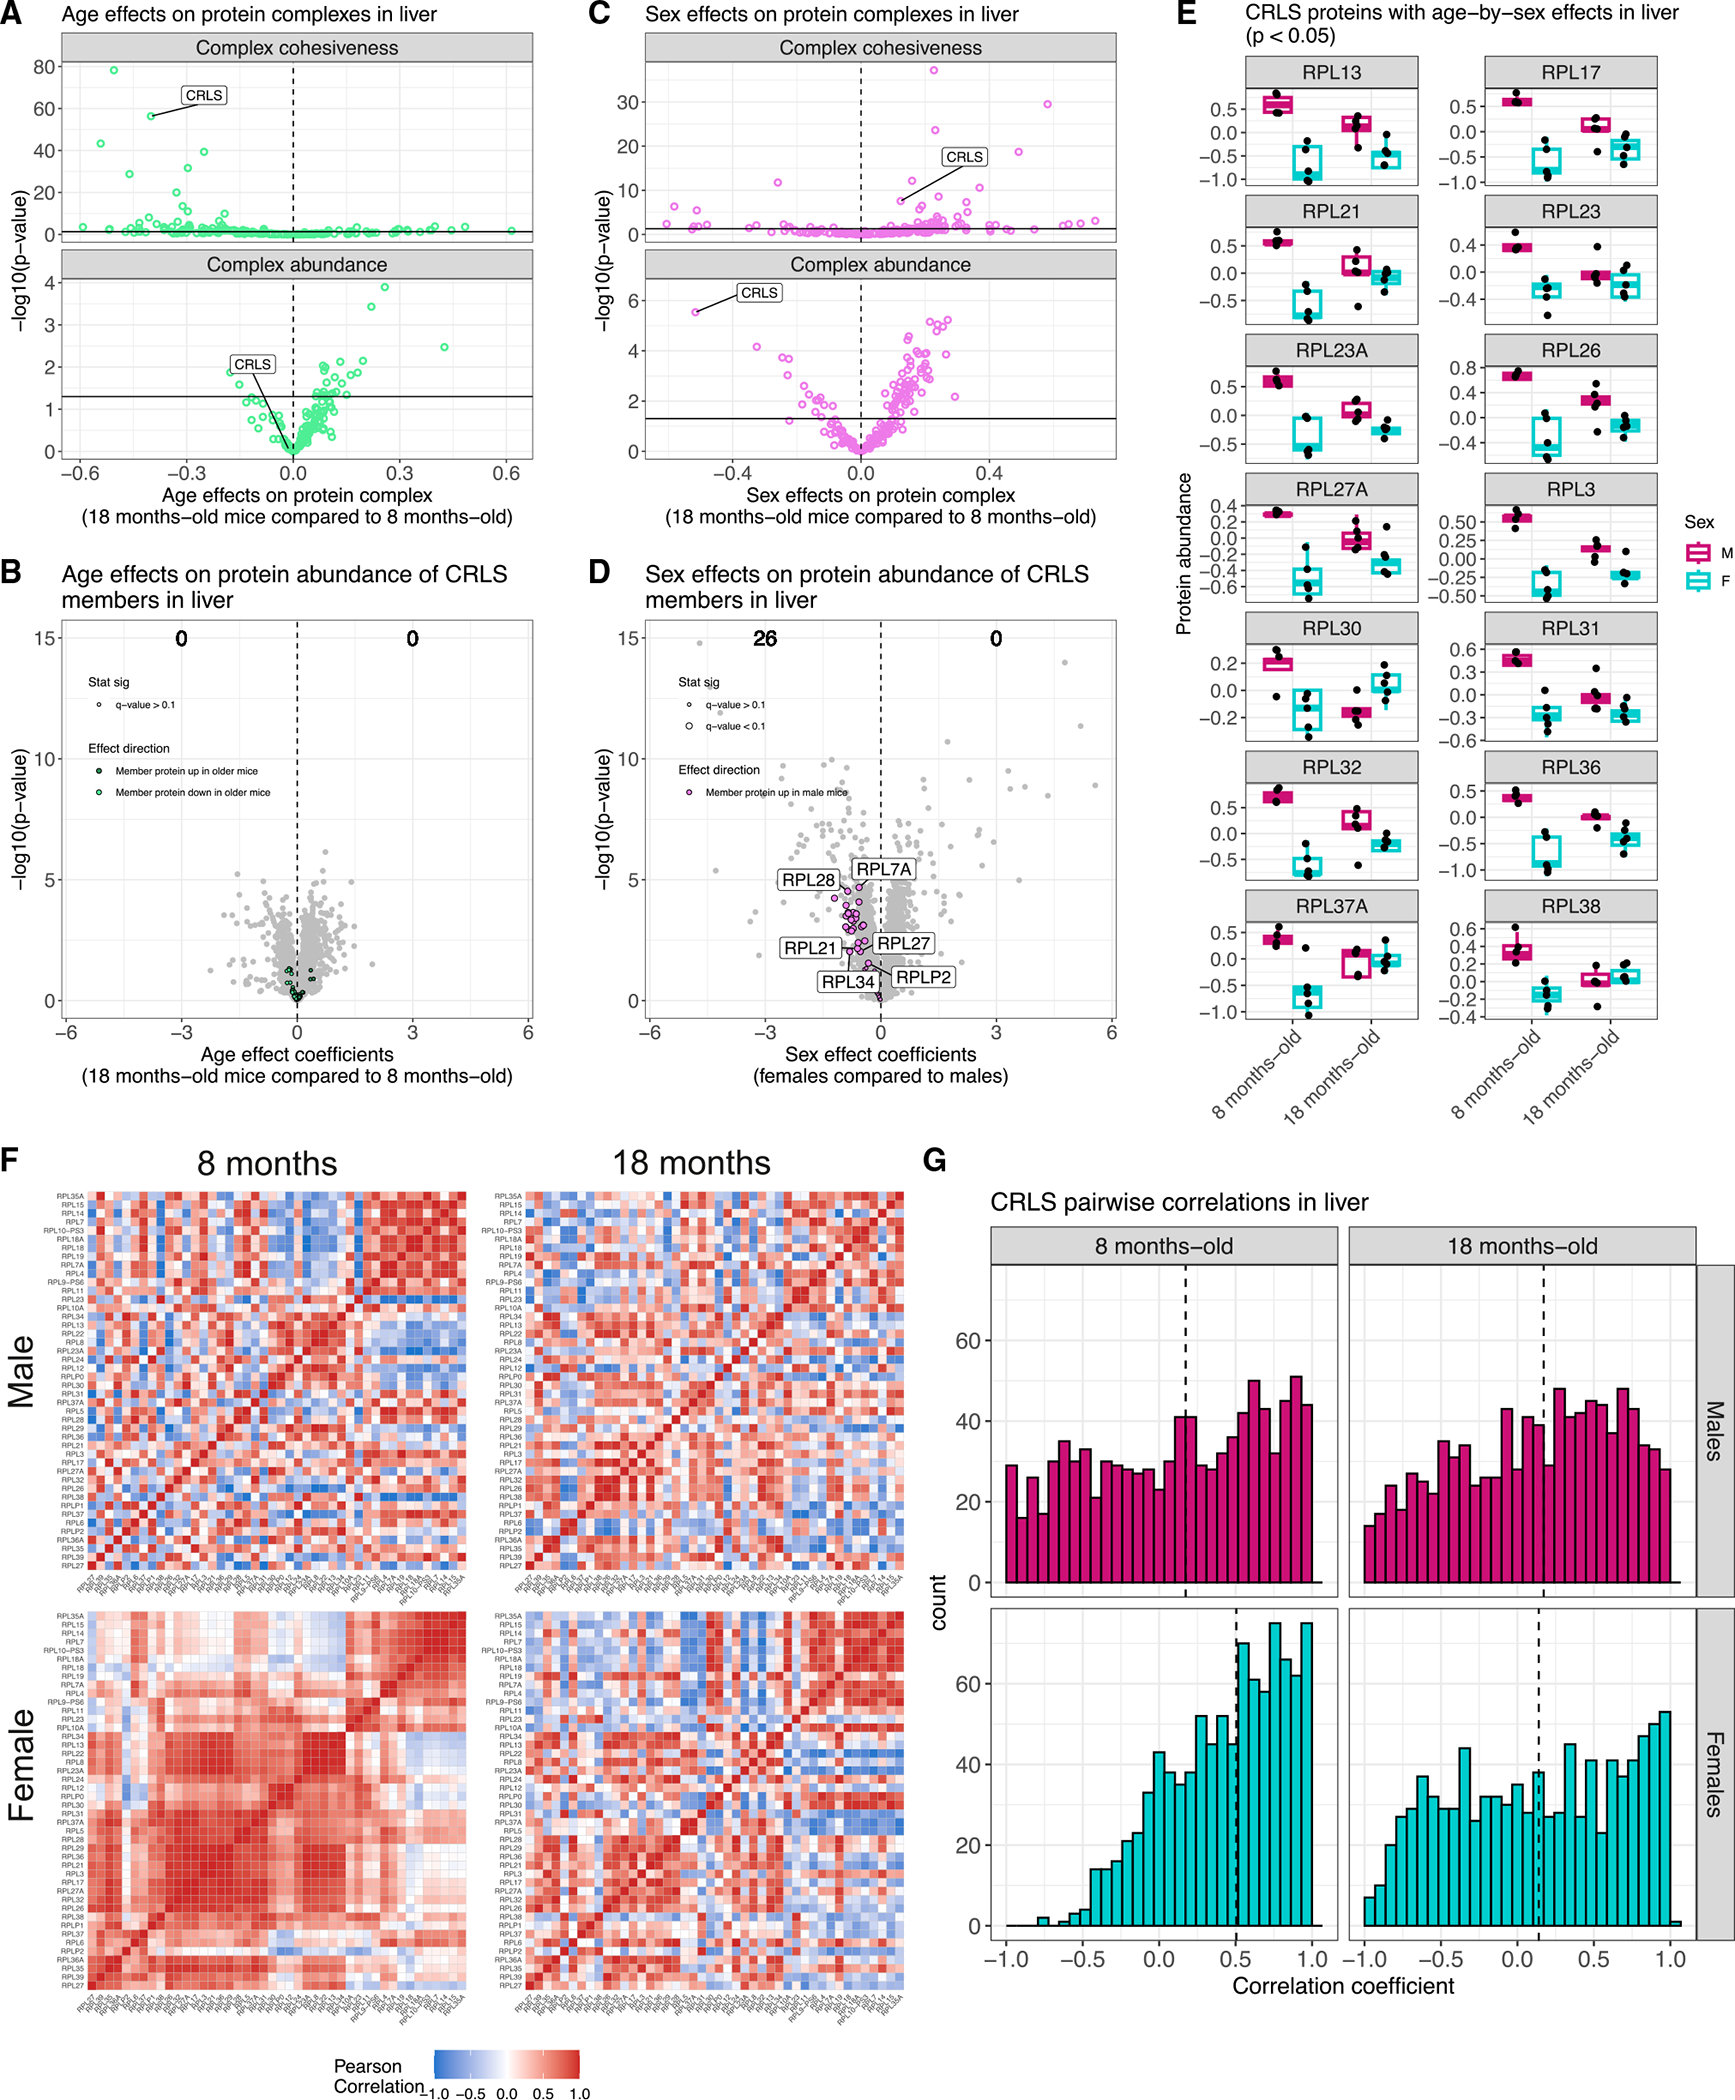
Maintenance of protein homeostasis degrades with age, contributing to aging-related decline and disease. Previous studies have primarily surveyed transcriptional aging changes. To define the effects of age directly at the protein level, we perform discovery-based proteomics in 10 tissues from 20 C57BL/6J mice, representing both sexes at adult and late midlife ages (8 and 18 months). Consistent with previous studies, age-related changes in protein abundance often have no corresponding transcriptional change. Aging results in increases in immune proteins across all tissues, consistent with a global pattern of immune infiltration with age. Our protein-centric data reveal tissue-specific aging changes with functional consequences, including altered endoplasmic reticulum and protein trafficking in the spleen. We further observe changes in the stoichiometry of protein complexes with important roles in protein homeostasis, including the CCT/TriC complex and large ribosomal subunit. These data provide a foundation for understanding how proteins contribute to systemic aging across tissues.

Keywords: B6; C57BL/6J; CP: Genomics; CP: Metabolism; TMT; multitissue; organismal aging; protein complex; protein homeostasis; proteomics; proteostasis; tandem mass tag.


Conflict of interest statement

Declaration of interests G.R.K., R.K., J.-G.Z., and G.A.C. are employees of The Jackson Laboratory. S.P.G. serves on the scientific advisory board for Thermo Fisher Scientific.

Figures

Figure 1.
Figure 1.. Quantitative proteomics study on the effects of age and sex on protein abundance across 10 tissues from B6 mice
(A) Using sample multiplexing, 10 anatomical proteomes (adipose tissue, striatum, hippocampus, cerebellum, kidney, spleen, lung, heart, liver, skeletal muscle) were profiled across age- and sex-matched mice (n = 20). (B) Age (top) and sex (bottom) differences for protein abundance from kidney (left) and heart (right) tissues, depicted as volcano plots. Differences in protein abundance are summarized as regression coefficients (x axis) and corresponding −log10(p value) (y axis). Points are colored based on statistical significance (FDR < 0.1) and direction of effect. Counts of proteins with significantly higher abundance in 18- and 8-month-old mice are included. Dashed vertical lines at 0 included for reference. (C) Examples of proteins in kidney tissue with significant age-by-sex differences (FDR < 0.1). (D) Age differences detected across the 10 tissues (FDR < 0.1), represented as a heatmap. Differences are summarized as regression coefficients.
Figure 2.
Figure 2.. Proteins with age-related differences in abundance across 10 tissues
(A) Proteins with age differences in abundance, represented as volcano plots. Differences in protein abundance are summarized as regression coefficients (x axis) and corresponding −log10(p value) (y axis). Points are colored based on statistical significance (FDR < 0.1) and direction of effect. Counts of proteins with significantly higher abundance in older mice and younger mice are included. Dashed vertical lines at 0 included for reference. Proteins with sex differences in abundance are shown in Figure S2. (B) The immunoglobulin IGKC has consistent increased abundance in older mice across all 10 tissues. (C) Proteins with significant age differences that vary between tissues: BCAT1, CES1D, FBLN1, and STAB1.
Figure 3.
Figure 3.. Age- and sex-related protein differences show varying levels of consistency with previously published transcriptomics and proteomics datasets
(A and B) Comparisons of (A) age- and (B) sex-related differences in proteins with transcripts in kidney. Points are colored based on statistical significance (FDR < 0.1) in proteins and transcripts. Correlation (r) between protein differences and transcript differences and dashed vertical and horizontal lines at 0 included for reference. Counts of genes with significant differences included as bar plots in the bottom right quadrant. (C) Vcam1 significantly increases with age in terms of both transcripts (top) and proteins (bottom). Transcript data represent 10 age groups compared with 2 age groups for proteins. (D) Keg1 expression had significant age and sex differences (top), whereas its protein had a matching sex effect (bottom). The age effect did not meet significance at FDR < 0.1, but the direction is consistent with transcripts. Transcript data represent 10 age groups compared with 2 age groups for proteins. (E and F) Comparisons of (E) age- and (F) sex-related differences in proteins with transcripts in heart. Points are colored based on statistical significance (FDR < 0.1) in proteins and transcripts. Correlation (r) between protein differences and transcript differences and dashed vertical and horizontal lines at 0 included for reference. Counts of genes with significant differences included as bar plots in the bottom right quadrant. (G) Correlations between protein age differences across tissues comparing three mouse sample populations. The number of genes being summarized by the correlation is on the x axis. Circle points represent correlations across all overlapping genes. Triangle points represent correlations across overlapping genes that had a significant age difference (FDR < 0.1) in this study’s B6 mice. Dashed lines connect correlations from the same tissue and study comparison. Horizontal line at 0 included for reference as the upper limit of correlation. Numbers associated with each point indicate the number of proteins associated with each comparison. (H–J) Comparisons of protein age-related differences in kidney between (H) this study’s cohort of B6 mice and genetically diverse mice, (I) this study’s cohort of B6 mice and another smaller cohort of male B6 mice, and (J) targeted and untargeted protein measurements from the smaller cohort of male B6 mice, representing a technical replication. Proteins with consistent strong age effects (same sign in both datasets and absolute Z scores within each population greater than 2) across two studies are outlined in black. Correlation (r) between protein differences and dashed vertical and horizontal lines at 0 included for reference. Black best fit lines also included for reference.
Figure 4.
Figure 4.. Cross-tissue and tissue-unique patterns of aging
(A) Age-related differences detected across the 10 tissues (FDR < 0.1), represented as a heatmap. Differences are summarized as regression coefficients. Hierarchical clustering of the proteins (columns) reveals sets of proteins with age difference patterns across tissues and unique to specific tissues. (B) Proteins with age differences that are shared across tissues are enriched for immune-related GO categories. Additional tissue-unique patterns are highlighted in Figure S3. (C) The proteins with age differences in a specific tissue can be enriched in GO categories, with spleen highlighted here for proteins with higher abundance in older mice. Abundance differences with age for proteins analyzed in spleen are represented as volcano plots. Differences in protein abundance are summarized as regression coefficients (x axis) and corresponding −log10(p value) (y axis). The ERAD pathway (GO: 0036503), EMC, COPI, and COPII proteins are highlighted. Highlighted proteins with significant differences (FDR < 0.1) have larger point size. Proteins with age p < 0.05 are labeled. (D) Comparison of age differences between kidney and heart with highlighted GO categories that are consistent (left) and inconsistent (right) between the tissues. Proteins with a significant age difference (FDR < 0.1) in kidney or heart are shown. Proteins with significant differences (FDR < 0.1) in both tissues have a larger point size.
Figure 5.
Figure 5.. Increased immunoglobulin abundance is a signature of aging detected in all 10 tissues
(A) Proteins with age differences in abundance, represented as volcano plots. Differences in protein abundance are summarized as regression coefficients (x axis) and corresponding −log10(p value) (y axis). Points are colored based on being a member of the adaptive immune response GO category (GO: 0002250) and direction of effect. Highlighted proteins with significant differences (FDR < 0.1) have larger point size. Dashed vertical lines at 0 included for reference. (B) Volcano plots for cerebellum, fat, and spleen, with immunoglobins and immunoproteasomes (PSMB8, PSMB9, and PSMB10) highlighted. (C) Age differences summarized across the immunoproteasomes (y axis) and immunoglobins (x axis) for all 10 tissues. Points represent mean differences and bars represent standard errors. Horizontal and vertical dashed lines at 0 included for reference. (D) Pearson correlations from the proteasome in younger (top) and older (bottom) mouse fat. Rows and columns are ordered to reflect key subcomplexes of the proteasome, which are labeled. The immunoproteasomes and their matching constitutive analogs are highlighted with black squares.
Figure 6.
Figure 6.. CCT complex is more stoichiometrically balanced in older mouse cerebellum
(A) Comparison of age-related differences and p values in complex cohesiveness (top) with complex-wide abundance (bottom) in cerebellum. CCT complex is highlighted. Dashed vertical lines at 0 included for reference. Horizontal line at p = −log10(0.05) included to indicate statistical significance. (B) Volcano plot for age differences in individual protein abundance for cerebellum with CCT-complex members highlighted with color based on direction of effect. Counts of proteins with significantly higher abundance in older mice and younger mice are included (FDR < 0.1). Dashed vertical lines at 0 included for reference. (C) Pearson correlations from the CCT complex in younger (left) and older (right) mouse cerebellum. Black and gray squares highlight patterns in the correlation matrix that mirror the structure of the CCT complex. (D) Histograms of pairwise correlation coefficients between CCT-complex members with each other (top) and other proteins (bottom). Vertical red dashed lines represent median correlations. (E) The CCT complex is composed of two identical octomeric rings. The CCT2 (β) and CCT6A (ζ) from each ring are in physical contact with their twin. Outline of proteins matches correlation structure previously highlighted. (F) GO categories enriched in proteins that are more correlated with CCT-complex members in older mouse cerebellum than in younger. The microtubule GO category (GO: 0005874) is explored further in Figure S6.
Figure 7.
Figure 7.. CRLS in liver shows age-by-sex differences in complex-wide abundance and stoichiometry
(A) Comparison of age-related differences and p values in complex cohesiveness (top) with complex-wide abundance (bottom) in liver. CRLS is highlighted. Dashed vertical lines at 0 included for reference. Horizontal line at p = −log10(0.05) included to indicate statistical significance. (B) Volcano plot for age differences in individual protein abundance for liver with CRLS members highlighted with color based on direction of effect. Counts of proteins with significantly higher abundance in older mice and younger mice are included (FDR < 0.1). (C) Comparison of sex-related differences and p values in complex cohesiveness (top) with complex-wide abundance (bottom) in liver. CRLS is highlighted. Dashed vertical lines at 0 included for reference. Horizontal line at p = −log10(0.05) included to indicate statistical significance. (D) Volcano plot for sex differences in individual protein abundance for liver with CRLS members highlighted with color based on direction of effect. Counts of proteins with significantly higher abundance in females and males are included (FDR < 0.1). (E) CRLS proteins with age-by-sex differences in abundance in liver (age-by-sex p < 0.05). (F) Pearson correlations from the CRLS, stratified by age (left, younger; right, older) and sex (top. male; bottom, female) in mouse liver. (G) Histograms of pairwise correlation coefficients from the CRLS, stratified by age (left, younger; right, older) and sex (top, male; bottom, female) in mouse liver. Vertical dashed lines represent median correlations.

References

    1. López-Otín C, Blasco MA, Partridge L, Serrano M, and Kroemer G (2013). The Hallmarks of Aging. Cell 153, 1194–1217. - PMC - PubMed
    1. Schaum N, Lehallier B, Hahn O, Pálovics R, Hosseinzadeh S, Lee SE, Sit R, Lee DP, Losada PM, Zardeneta ME, et al. (2020). Ageing hallmarks exhibit organ-specific temporal signatures. Nature 583, 596–602. - PMC - PubMed
    1. Tabula Muris Consortium; Almanzar N, Antony J, Baghel AS, Bakerman I, Bansal I, Barres BA, Beachy PA, Berdnik D, Bilen B, et al. (2020). A single-cell transcriptomic atlas characterizes ageing tissues in the mouse. Nature 583, 590–595. - PMC - PubMed
    1. Shokhirev MN, and Johnson AA (2021). Modeling the human aging transcriptome across tissues, health status, and sex. Aging Cell 20, e13280. - PMC - PubMed
    1. Zeng L, Yang J, Peng S, Zhu J, Zhang B, Suh Y, and Tu Z (2020). Transcriptome analysis reveals the difference between “healthy” and “common” aging and their connection with age-related diseases. Aging Cell 19, e13121. - PMC - PubMed

Publication types

LinkOut - more resources