. 2023 Jul 25;42(7):112751.
doi: 10.1016/j.celrep.2023.112751. Epub 2023 Jul 4.

FOXA2 controls the anti-oxidant response in FH-deficient cells

Affiliations

FOXA2 controls the anti-oxidant response in FH-deficient cells

Connor Rogerson et al. Cell Rep. .

Abstract

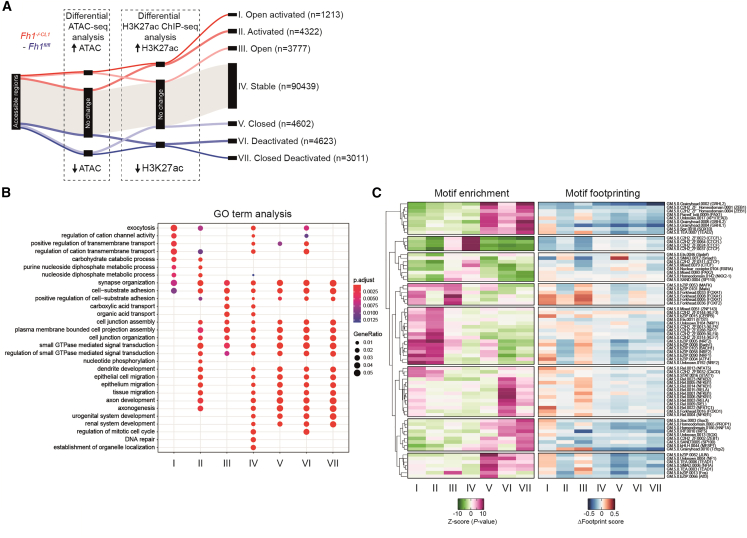
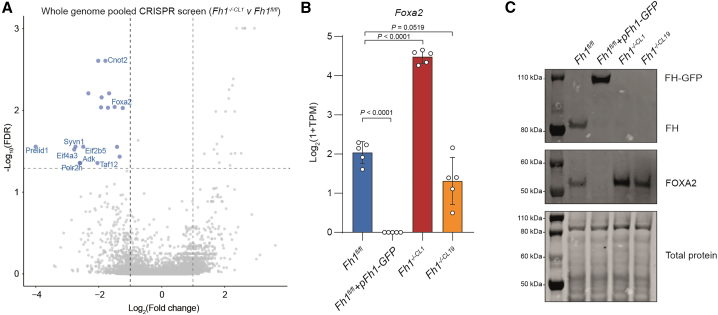
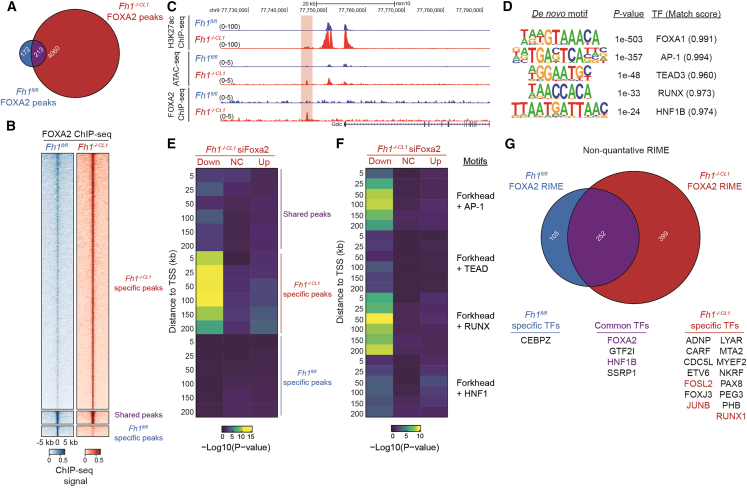
Hereditary leiomyomatosis and renal cell cancer (HLRCC) is a cancer syndrome caused by inactivating germline mutations in fumarate hydratase (FH) and subsequent accumulation of fumarate. Fumarate accumulation leads to profound epigenetic changes and the activation of an anti-oxidant response via nuclear translocation of the transcription factor NRF2. The extent to which chromatin remodeling shapes this anti-oxidant response is currently unknown. Here, we explored the effects of FH loss on the chromatin landscape to identify transcription factor networks involved in the remodeled chromatin landscape of FH-deficient cells. We identify FOXA2 as a key transcription factor that regulates anti-oxidant response genes and subsequent metabolic rewiring cooperating without direct interaction with the anti-oxidant regulator NRF2. The identification of FOXA2 as an anti-oxidant regulator provides additional insights into the molecular mechanisms behind cell responses to fumarate accumulation and potentially provides further avenues for therapeutic intervention for HLRCC.

Keywords: CP: Cancer; CP: Molecular biology; FOXA2; NRF2; anti-oxidant response; fumarate hydratase.


Conflict of interest statement

Declaration of interests The authors declare no competing interests.

Figures

None
Graphical abstract
Figure 1
Figure 1
FH deficiency coincides with chromatin rewiring (A) MA plot of differential ATAC-seq analysis in Fh1−/−CL1 cells compared with Fh1fl/fl cells. Regions with a linear fold change of ±2 and q value of less than 0.05 are highlighted in red. (B) MA plot of differential H3K27ac ChIP-seq analysis in Fh1−/−CL1 cells compared with Fh1fl/fl cells. Regions with a linear fold change of ±2 and q value of less than 0.05 are highlighted in red. (C) H3K27ac ChIP-seq and ATAC-seq genome browser tracks from Fh1fl/fl and Fh1−/−CL1 cells around the Vim locus. (D) Normalized ATAC-seq signal (upper) and H3K27ac ChIP-seq signal (lower) from Fh1fl/fl (blue), Fh1−/−CL1 (red), and Fh1−/−CL1+pFh1-GFP (gray) at significantly increased (left) or decreased (right) regions.
Figure 2
Figure 2
Integrating ATAC-seq and H3K27ac data identifies distinct clusters of regulation (A) Sankey diagram of the process of classifying each accessible region in clusters depending on an increase, decrease, or no change in ATAC-seq signal and an increase, decrease, or no change in H3K27ac ChIP-seq signal. (B) Dot plot of enriched GO terms of genes located near to regions of clusters I–VII. Size of dots represents proportion of DEGs in a given GO term (GeneRatio) and colors represent significance (adjusted p [p.adjust]). (C) Heatmap of enrichment of transcription factor motifs (left) and differential footprinting score (right) within regions I–VII.
Figure 3
Figure 3
Whole-genome CRISPR screen identifies FOXA2 as an important transcription factor (A) Volcano plot of genes enriched in a whole-genome CRISPR screen in Fh1fl/fl and Fh1−/−CL1 cells. The comparison was made between Fh1fl/fl and Fh1−/−CL1 cells to identify lethal genes dependent on FH deficiency. Points highlighted in blue are significantly depleted hits and labeled points are high-confidence hits (defined as enriched compared with control cells taking into account original plasmid). (B) Expression of Foxa2 in Fh1fl/fl (blue), Fh1−/−CL1+pFh1-GFP (gray), Fh1−/−CL1 (red), and Fh1−/−CL19 (orange). n = 5 for all conditions. Error bars are mean ± standard deviation, and p values calculated using Student’s t test with Welch’s correction. (C) Immunoblot of protein lysate from Fh1fl/fl, Fh1−/−CL1+pFh1-GFP, Fh1−/−CL1, and Fh1−/−CL19 cells probed with antibodies against FOXA2 and FH.
Figure 4
Figure 4
FOXA2 controls NRF2 target genes (A) Volcano plots of DEGs in Fh1fl/fl (left), Fh1−/−CL1 (middle), and Fh1−/−CL19 (right) cells treated with siFoxa2 compared with siNT. (B) GO enrichment of DEGs in Fh1−/−CL1 (left) and Fh1−/−CL19 (right) cells. (C) Transcription factor enrichment (ChEA) from publicly available ChIP-seq datasets nearby DEGs in Fh1−/−CL1 cells treated with siFoxa2 compared with siNT. (D) Enrichment of NRF2 target genes (NFE2L2.V2 gene set) among differentially expressed target genes in Fh1−/−CL1 cells treated with siFoxa2 compared with siNT.
Figure 5
Figure 5
FOXA2 binds chromatin in FH-deficient cells independent of NRF2 (A) Venn diagram of FOXA2 ChIP-seq peaks shared between (purple) and specific to Fh1fl/fl (blue) and Fh1−/−CL1 (red) cells. (B) Heatmap of FOXA2 ChIP-seq signal across 10-kb regions centered at FOXA2 peaks in Fh1fl/fl (blue) and Fh1−/−CL1 (red) cells. (C) H3K27ac ChIP-seq, ATAC-seq, and FOXA2 ChIP-seq from Fh1fl/fl (blue) and Fh1−/−CL1 (red) cells at the Gclc locus. Fh1−/−CL1-specific FOXA2 peak upstream of Gclc highlighted in red. (D) Enriched motifs from de novo motif analysis of FOXA2 peaks specific for Fh1−/−CL1 cells with enrichment p values and matched transcription factor names and match scores. (E) Heatmap of enrichment p values (hypergeometric test) of DEGs from siFoxa2 treatment to FOXA2 ChIP-seq peaks at increasing distances from the TSS. (F) Heatmap of enrichment p values (hypergeometric test) of DEGs from siFoxa2 treatment to FOXA2 ChIP-seq peaks with the presence of additional transcription factor motifs at increasing distances from the TSS. (G) Venn diagram comparing proteins identified from FOXA2 RIME in Fh1fl/fl (blue) and Fh1−/−CL1 (red) cells. Proteins from each section that are annotated as a transcription factor are stated and highlighted if their motif was identified from the de novo motif analysis.
Figure 6
Figure 6
FOXA2 regulates NRF2-associated metabolism (A) Immunoblot of protein lysate from Fh1fl/fl, Fh1−/−CL1, and Fh1−/−CL19 cells treated with either siNT or siFoxa2 probed with antibodies against FOXA2. (B) Volcano plots of differentially abundant metabolites in Fh1fl/fl (left), Fh1−/−CL1 (middle), and Fh1−/−CL19 (right) cells treated with siFoxa2 compared with siNT. (C) Metabolite set enrichment analysis of significantly changed metabolites in Fh1−/−CL1 cells treated with siFoxa2 compared with siNT. Color of dots represents enrichment in altered metabolites in Fh1−/−CL19 cells treated with siFoxa2 compared with siNT. (D–E) Normalized abundances of indicated metabolites in Fh1fl/fl, Fh1−/−CL1, and Fh1−/−CL19 cells treated with either siNT or siFoxa2. n = 5 for all conditions. Error bars are mean ± standard deviation, and p values calculated using Student’s t test with Welch’s correction.

References

    1. Tomlinson I.P.M., Alam N.A., Rowan A.J., Barclay E., Jaeger E.E.M., Kelsell D., Leigh I., Gorman P., Lamlum H., Rahman S., et al. Germline mutations in FH predispose to dominantly inherited uterine fibroids, skin leiomyomata and papillary renal cell cancer. Nat. Genet. 2002;30:406–410. doi: 10.1038/ng849. - DOI - PubMed
    1. Grubb R.L., Franks M.E., Toro J., Middelton L., Choyke L., Fowler S., Torres-Cabala C., Glenn G.M., Choyke P., Merino M.J., Zbar B., Pinto P.A., Srinivasan R., Coleman J.A., Linehan W.M. Hereditary Leiomyomatosis and Renal Cell Cancer: A Syndrome Associated With an Aggressive Form of Inherited Renal Cancer. J. Urol. 2007;177:2074–2079. doi: 10.1016/j.juro.2007.01.155. - DOI - PubMed
    1. Menko F.H., Maher E.R., Schmidt L.S., Middelton L.A., Aittomäki K., Tomlinson I., Richard S., Linehan W.M. Hereditary leiomyomatosis and renal cell cancer (HLRCC): renal cancer risk, surveillance and treatment. Fam. Cancer. 2014;13:637–644. doi: 10.1007/s10689-014-9735-2. - DOI - PMC - PubMed
    1. Frezza C., Zheng L., Folger O., Rajagopalan K.N., MacKenzie E.D., Jerby L., Micaroni M., Chaneton B., Adam J., Hedley A., et al. Haem oxygenase is synthetically lethal with the tumour suppressor fumarate hydratase. Nature. 2011;477:225–228. doi: 10.1038/nature10363. - DOI - PubMed
    1. Schmidt C., Sciacovelli M., Frezza C. Fumarate hydratase in cancer: A multifaceted tumour suppressor. Semin. Cell Dev. Biol. 2020;98:15–25. doi: 10.1016/j.semcdb.2019.05.002. - DOI - PMC - PubMed

Publication types

Supplementary concepts