. 2023 Jul 5;19(7):e1011460.
doi: 10.1371/journal.ppat.1011460. eCollection 2023 Jul.

L-selectin-dependent and -independent homing of naïve lymphocytes through the lung draining lymph node support T cell response to pulmonary Mycobacterium tuberculosis infection

Affiliations

L-selectin-dependent and -independent homing of naïve lymphocytes through the lung draining lymph node support T cell response to pulmonary Mycobacterium tuberculosis infection

Lina Daniel et al. PLoS Pathog. .

Abstract

Recruiting large numbers of naïve lymphocytes to lymph nodes is critical for mounting an effective adaptive immune response. While most naïve lymphocytes utilize homing molecule L-selectin to enter lymph nodes, some circulating cells can traffic to the lung-draining mediastinal lymph node (mLN) through lymphatics via the intermediate organ, lung. However, whether this alternative trafficking mechanism operates in infection and contributes to T cell priming are unknown. We report that in pulmonary Mycobacterium tuberculosis-infected mice, homing of circulating lymphocytes to the mLN is significantly less efficient than to non-draining lymph node. CD62L blockade only partially reduced the homing of naïve T lymphocytes, consistent with L-selectin-independent routing of naïve lymphocytes to the site. We further demonstrated that lymphatic vessels in infected mLN expanded significantly and inhibiting lymphangiogenesis with a vascular endothelial growth factor receptor 3 kinase inhibitor reduced the recruitment of intravenously injected naïve lymphocytes to the mLN. Finally, mycobacterium-specific T cells entering via the L-selectin-independent route were readily activated in the mLN. Our study suggests that both L-selectin-dependent and -independent pathways contribute to naïve lymphocyte entry into mLN during M. tuberculosis infection and the latter pathway may represent an important mechanism for orchestrating host defence in the lungs.


Conflict of interest statement

The authors have declared that no competing interests exist.

Figures
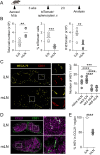
Fig 1
Fig 1. Homing of lymphocytes is impaired in the mLN during M.tb infection.
(A) Experimental design. Splenocytes from tdTomato-expressing mice were injected i.v. into 3wk M.tb-infected WT mice. The iLN and mLN were analyzed 2 h post-transfer. (B) Total cell number of iLN and mLN as well as percentage and number of donor tdTtomato+ lymphocytes (2 h post cell transfer) in iLN and mLN at wk 3 p.i. (C) Representative staining of MECA-79 (yellow) in iLN and mLN at wk3 p.i. Scale bar 100 μm. Enlarged view of the boxed area in the left images are shown in right panels. Enlarged view representing stained HEV with MECA-79 (yellow) and CD31 (red) (Scale bar, 50 μm). Number of HEV/mm2 measured in naïve mLN as well as infected iLN and mLN. (D) Representative staining of CCL21 (magenta) and CD31 (green) in iLN and mLN at wk 3 p.i. (E) Percentage of HEV in CCL21 region in iLN and mLN at wk 3 p.i. Each symbol represents an individual mouse in (B) and sections in (C, D). Data in (B) are pooled from two independent experiments. Data in (C) are from two independent experiments (n = 4–6 mice / group, 1–2 sections / mouse were analyzed). Data in (D-E) are from two independent experiments (n = 3 mice / group, 1–2 sections / mouse were analyzed) Statistical differences between groups in (B, E) were determined using Student’s t test or in (C) using one-way ANOVA with Tukey’s multiple comparison test. ** p < 0.01, ***p < 0.001, **** p < 0.0001.
Fig 2
Fig 2. CD62L blockade only partially reduces the homing of lymphocytes into the mLN.
(A) Experimental design. M.tb-infected mice were injected with an isotype control or anti-CD62L mAb i.p. at wk 3 or 8 p.i. After 72 h iLN and mLN were collected for analysis. Number of endogenous CD4+ and CD8+ T cell and B220+ B cells in (B) mLN week 3 p.i., (C) mLN week 8 p.i., (D) iLN week 3 p.i., and (E) iLN at week 8 p.i. of isotype control and anti-CD62L treated mice. (F) Number of CD69CD44CD4+ and CD8+ T cells in mLN of control and anti-CD62L treated mice at week 3 p.i. and (G) week 8 p.i. (H) Number of CD69CD44CD4+ and CD8+ T cells in iLN at week 3 p.i. and (I) week 8 p.i. Data shown are pooled from two independent experiments (n = 3–4 mice/experiment). Statistical differences between groups were determined using Student’s t test *p < 0.05, ** p < 0.01, ***p < 0.001, **** p < 0.0001.
Fig 3
Fig 3. Intravenously injected naïve lymphocytes can enter the mLN via an L-selectin independent mechanism.
(A) Experimental design. Splenocytes from CD45.1+ mice were injected i.v. with isotype control or anti-CD62L mAb into 3wk M.tb-infected CD45.2+ mice. After 18 h mLN and iLN were collected for analysis. (B) Representative flow cytometry plots showing percentage of donor CD45.1+ cells in iLN and mLN of isotype control and anti-CD62L treated mice. (C) Total number of CD45.1+ CD4+ and CD8+ T cell and B220+ B cells in iLN and mLN of the treated mice. (D) Representative flow cytometry plot showing percentage of CD45.1+ CD69CD44 naïve CD4+ and CD8+ T cells in mLN of anti-CD62L-treated M.tb-infected mice. (E) Total number of CD45.1+ naïve CD4+ and CD8+ T cells in mLN and iLN of anti-CD62L-treated M.tb-infected treated mice. White circles in (C, E) denote mice that received isotype control mAb and grey circles denote mice that received anti-CD62L mAb. Each circle represents an individual mouse. Data in (B-E) representative of two independent experiments with similar results (n = 4–5 mice/group). Statistical differences between groups were determined using (C) Two-way ANOVA with Sidak’s multiple comparison test (E) Student’s t test. ** p < 0.01, ***p < 0.001, **** p < 0.0001.
Fig 4
Fig 4. Intratracheally delivered naïve lymphocytes can home to the mLN.
(A) Experimental design. CTV-labelled lymphocytes were co-injected with isotype control or anti-CD62L mAb i.t. into 8wk M.tb-infected mice. (B) Representative flow cytometry plots showing the percentage of CTV+ donor lymphocytes in the lung, mLN and iLN. (C) Representative flow cytometry plots showing the expression of CD69 and CD44 on CTV+ CD4+ or CD8+ T cells in lung and mLN of 8wk M.tb infected mice is shown. (D) Number of CTV+ lymphocytes in the lung and mLN of control and anti-CD62L mAb treated M.tb-infected mice. (E) Representative immunofluorescence images of Lyve-1 (green) in iLN and mLN. The dashed line delineates the B cell follicles. Scale bar 100 μm. (F) Proportion of Lyve-1+ region across entire area of the iLN and mLN of M.tb infected mice. Each symbol denotes an individual LN section (2 sections/mouse). (G) Expression of vegfc and vegfr3 in iLN and mLN from 8wk M.tb-infected mice determined using quantitative RT-PCR. White symbols in (D) denote mice that received isotype control mAb and grey symbols denote mice that received anti-CD62L mAb. Data shown are the mean fold increase ±SD relative to iLN. Data shown are representative of two independent experiments with similar results (3 mice/group). Statistical differences between groups were determined using (D) Two-way ANOVA with Sidak’s multiple comparison test and (F, G) Student’s t test. *p < 0.05, ** p < 0.01, ***p < 0.001.
Fig 5
Fig 5. Inhibiting lymphangiogenesis reduces T cell recruitment to the mLN.
(A) Experimental design. M.tb-infected mice were treated with MAZ51 i.p daily for 10 days, starting from day 11 post aerosol M.tb infection. TdTomato+ splenocytes were transferred 18 h before harvest. (B) Representative images of Lyve-1+ (green) in MAZ51- and vehicle-treated control mice (scale bar, 150 μm). (C) Proportion of Lyve-1+ region across entire area of MAZ51- and vehicle-treated control mice. Each symbol denotes an individual LN section (4–5 sections/mouse). (D) Total number of tdTomato+CD4+, CD8+ and B220+ lymphocytes in mLN of control and treated mice. (E) Total number of tdTomato+ CD69-CD44low naïve CD4+ and CD8+ T cells in mLN of control and MAZ51-treated mice p.i. (F) Number of total endogenous CD4+, CD8+ and B220+ lymphocytes in mLN of control and MAZ51-treated mice. (G) Number of endogenous ESAT64-17 specific (ESAT64-17:I-Ab) CD4+ T cells in mLN of control and MAZ51 treated mice. Each symbol represents an individual animal. Statistical differences between groups were determined using Student’s t test. *p < 0.05, **** p < 0.0001.
Fig 6
Fig 6. Ag specific CD4+ T cells entering in an L-selectin independent pathway are activated in the mLN.
(A) Experimental design. Splenocytes from C7.GFP.Rag1—/—Tg mice were CTV labelled and injected i.v. into 8wk M.tb-infected WT recipients (∼ 2 x 10⁵ CD4+ transgenic T cell / mouse). The mLN, iLN and spleens were analyzed at 48 h and 72 h post-transfer. (B) Percentage of E6 Tg cells in mLN, iLN and spleen of control and anti-CD62L mAb treated mice at 48 h and 72 h post cell transfer at week 3 p.i. and week 8 p.i. (C) Representative flow cytometry plots showing the percentage of CD69+ as well as CTVhigh and CTVlow E6 Tg cells at 48 h and 72 h post transfer in mLN of control and anti-CD62L treated mice at week8 p.i.. (D) Summary graph of the proportion of divided E6 Tg cells (CTV low) and proportion of activated CD69+ E6 Tg cells in mLN of the treated mice at week 3 and 8 p.i. (E) Representative flow cytometry plots showing the co-expression of T-bet and CTV in E6 Tg cells at 48 h and 72 h post transfer in mLN of the treated mice. Summary graph showing MFI of T-bet in E6 Tg cells at 72 h post-transfer in control and treated mice at week 8 p.i. Data shown are representative of two independent experiments with similar results (n = 4 mice/group). White circles denote mice that received isotype control mAb and grey circles denote mice that received anti-CD62L mAb. Statistical differences between groups were determined by (B, D and E) Two-way ANOVA with Sidak’s multiple comparison test or (F) Student’s t test *p < 0.05, ** p < 0.01.

References

    1. Blattman JN, Antia R, Sourdive DJD, Wang X, Kaech SM, Murali-Krishna K, et al.. Estimating the Precursor Frequency of Naive Antigen-specific CD8 T Cells. J Exp Med. 2002;195(5):657–64. doi: 10.1084/jem.20001021 - DOI - PMC - PubMed
    1. Moon JJ, Chu HH, Pepper M, McSorley SJ, Jameson SC, Kedl RM, et al.. Naive CD4(+) T cell frequency varies for different epitopes and predicts repertoire diversity and response magnitude. Immunity. 2007;27(2):203–13. doi: 10.1016/j.immuni.2007.07.007 - DOI - PMC - PubMed
    1. Grant SM, Lou M, Yao L, Germain RN, Radtke AJ. The lymph node at a glance–how spatial organization optimizes the immune response. J Cell Sci. 2020;133(5):jcs241828. - PMC - PubMed
    1. Girard J-P, Moussion C, Förster R. HEVs, lymphatics and homeostatic immune cell trafficking in lymph nodes. Nature Reviews Immunology. 2012;12(11):762–73. doi: 10.1038/nri3298 - DOI - PubMed
    1. Arbonés ML, Ord DC, Ley K, Ratech H, Maynard-Curry C, Otten G, et al.. Lymphocyte homing and leukocyte rolling and migration are impaired in L-selectin-deficient mice. Immunity. 1994;1(4):247–60. doi: 10.1016/1074-7613(94)90076-0 - DOI - PubMed

Publication types

Substances