. 2023 Jul 5;18(7):e0286596.
doi: 10.1371/journal.pone.0286596. eCollection 2023.

Ethanol and caffeine age-dependently alter brain and retinal neurochemical levels without affecting morphology of juvenile and adult zebrafish (Danio rerio)

Affiliations

Ethanol and caffeine age-dependently alter brain and retinal neurochemical levels without affecting morphology of juvenile and adult zebrafish (Danio rerio)

Carly L Clayman et al. PLoS One. .

Abstract

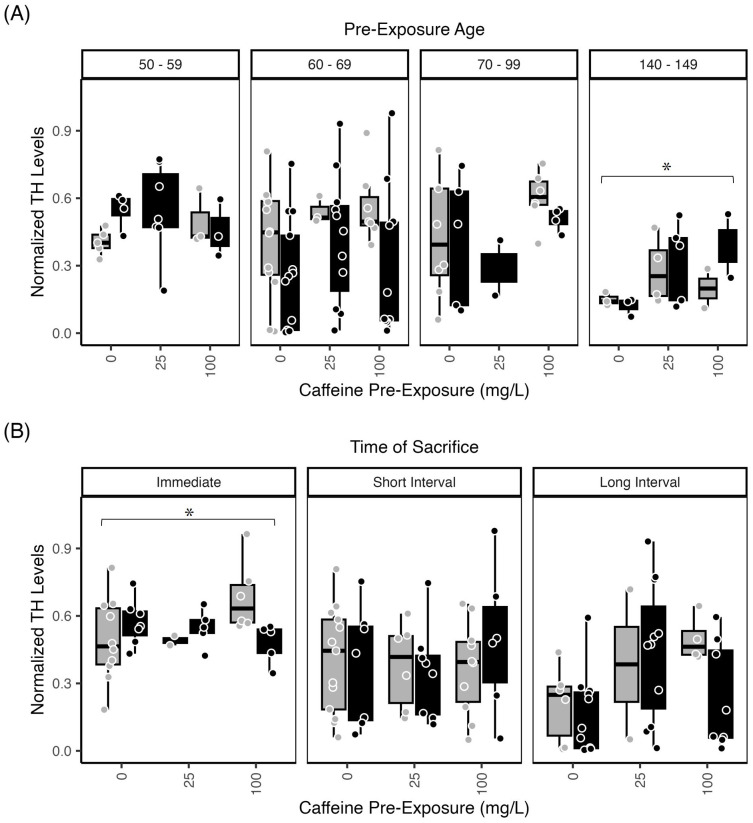
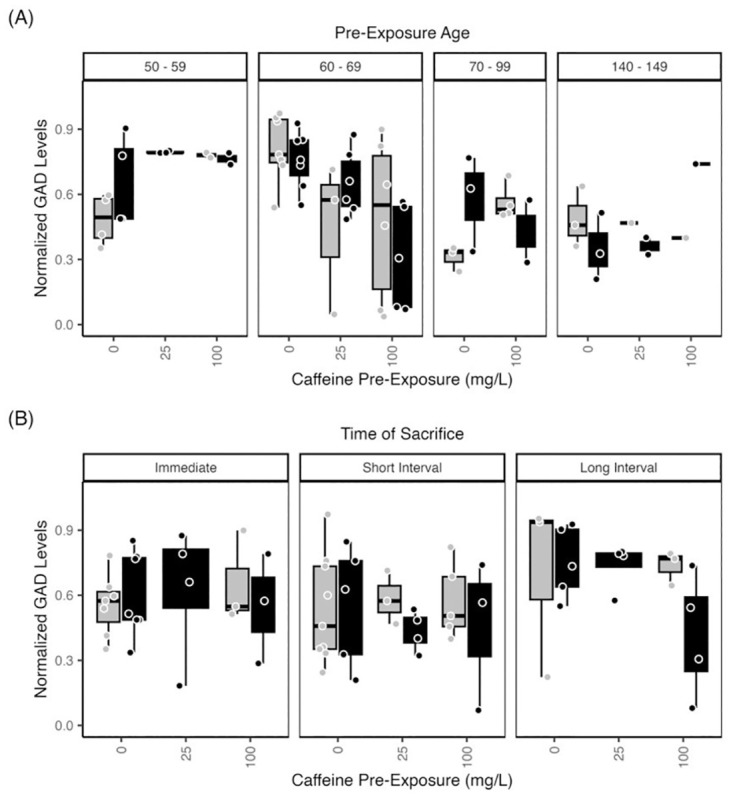
Adolescent alcohol exposure in humans is predictive of adult development of alcoholism. In rodents, caffeine pre-exposure enhances adult responsiveness to ethanol via a pathway targeted by both compounds. Embryonic exposure to either compound adversely affects development, and both compounds can alter zebrafish behaviors. Here, we evaluate whether co-exposure to caffeine and/or alcohol in adolescence exerts neurochemical changes in retina and brain. Zebrafish (Danio rerio) were given daily 20 min treatments to ethanol (1.5% v/v), caffeine (25-100 mg/L), or caffeine + ethanol for 1 week during mid-late adolescence (53-92 days post fertilization (dpf)) or early adulthood (93-142 dpf). Immediately after exposure, anatomical measurements were taken, including weight, heart rate, pigment density, length, girth, gill width, inner and outer eye distance. Brain and retinal tissue were subsequently collected either (1) immediately, (2) after a short interval (2-4d) following exposure, or (3) after a longer interval that included an acute 1.5% ethanol challenge. Chronic ethanol and/or caffeine exposure did not alter anatomical parameters. However, retinal and brain levels of tyrosine hydroxylase were elevated in fish sacrificed after the long interval following exposure. Protein levels of glutamic acid decarboxylase were also increased, with the highest levels observed in 70-79 dpf fish exposed to caffeine. The influence of ethanol and caffeine exposure on neurochemistry demonstrates specificity of their effects during postembryonic development. Using the zebrafish model to assess neurochemistry relevant to reward and anxiety may inform understanding of the mechanisms that reinforce co-addiction to alcohol and stimulants.


Conflict of interest statement

The authors have declared that no competing interests exist.

Figures

Fig 1
Fig 1. Acute 7-day exposure to caffeine and/or ethanol does not alter length or weight.
(A) Wet weight (g), (B) pigment density, (C) dorsal length (mm), and (D) lateral length (mm) measurements of zebrafish co-exposed to caffeine and ethanol. Measurements were taken immediately after the 7-d exposure period. Measurements were pooled to assess the effect of age of sacrifice across these experimental conditions. Exposure ages (dpf) are indicated at the top of the bar graphs. Black bars = 1.5% ethanol; gray bars = control (0% ethanol). Caffeine exposures (0, 25, or 100 mg/L) are given along the x-axis. Data from individual fish were assessed in age bins to facilitate comparisons: 60–79 dpf (juveniles); 80–99 dpf (young adult); 100–119; 120–139; 140–169 dpf (adult). Wet weight was collected from 60–79 dpf, 80–89 dpf, and 160–169 dpf fish only, to identify the largest differences. Neither caffeine nor ethanol exposure affected measurements. However, age-dependent differences were noted (asterisks). The boxplots show the minimum, first quartile, median, third quartile, and maximum values for each measure after outliers were removed. For weight (A), there were 3 independent replicates per treatment condition (each ethanol/caffeine dose) for a total of 18 subjects. For all other parameters (B, C, D) there were 7–9 independent replicates per treatment condition for a total of 51 subjects. ANOVA tables and multiple comparison results for this data can be found in S1 Table, panels (A1, A2) weight; (B) pigment density; (C1, C2) Dorsal Length; (D1-D2) Sagittal (Lateral) Length.
Fig 2
Fig 2. Age, but not ethanol and/or caffeine treatment, significantly affects eye diameter.
As in Fig 1, measurements of (A) inner and (B) outer eye diameter (in mm) were taken immediately after the 7-d exposure period to ethanol and/or caffeine. Measurements were pooled to assess the effect of age of sacrifice across these experimental conditions. Black bars = 1.5% ethanol; gray bars = control (0% ethanol). Caffeine exposures (0, 25, or 100 mg/L) are given along the x-axis. Data from individual fish were assessed in age bins to facilitate comparisons: 80–99 dpf (young adult); 100–119 dpf (adult). Despite age-dependent differences (asterisks), ethanol and/or caffeine exposure did not significantly impact measurements. The boxplots show the minimum, first quartile, median, third quartile, and maximum values for each measure after outliers were removed. Age when sacrificed (dpf) is indicated at the top of the bar graphs. For both measurements, there were 7–9 independent replicates per treatment condition (each ethanol/caffeine dose) for a total of 51 subjects. ANOVA tables and multiple comparison results for this data can be found in S1 Table, panels (E) Inner Eye Distance; (F1, F2) Outer Eye Distance.
Fig 3
Fig 3. Zebrafish Brain TH levels increase with age and ethanol withdrawal.
Normalized TH levels in brain homogenates from zebrafish treated with 1.5% ethanol (black bars) or water (control, gray bars) plotted across caffeine dose (0 mg/L; 25 mg/L, 100 mg/L). (A) TH levels in brain tissue assessed immediately after exposure. Fish exposed at 140–149 dpf had increased TH levels relative to other exposure ages (p<0.0.006; asterisk). (B) TH levels were also compared across time of sacrifice—immediately after exposure, after the short post-exposure interval, or after the long post-exposure interval. Tissue collected immediately had significantly greater TH levels compared to tissue collected after the short interval or long interval (p<0.0037; asterisk). The boxplots show the minimum, first quartile, median, third quartile, and maximum values for each measure after outliers were removed. Exposure ages (dpf) are indicated at the top of the bar graphs. For brain TH levels, there were 4–6 independent replicates per treatment condition (each ethanol/caffeine dose) for a total of 35 subjects. ANOVA tables and multiple comparison results for this data can be found in S1 Table, panels (G1, G2) Brain TH levels across pre-exposure age; (H1, H2) Brain TH levels across time of sacrifice.
Fig 4
Fig 4. Zebrafish Retina TH levels are affected by age and ethanol withdrawal.
Normalized retinal TH levels from zebrafish exposed to 1.5% ethanol (black bars) or water (control, grey bars) with or without caffeine (0 mg/L; 25 mg/L, 100 mg/L). (A) TH levels assessed immediately after exposure. Fish exposed at 50–59 dpf and 70–99 dpf had significantly higher retinal TH levels relative to 140–149 dpf (p<0.008; asterisk). (B) TH levels of retinal homogenates revealed significantly greater TH levels after the immediate post-exposure interval, compared to fish sacrificed after the short or long post-exposure interval (p<0.004; asterisk). The boxplots show the minimum, first quartile, median, third quartile, and maximum values for each measure after outliers were removed. Exposure ages (dpf) are indicated at the top of the bar graphs. For retina TH levels, there were 4–6 independent replicates per treatment condition (each ethanol/caffeine dose) for a total of 35 subjects. ANOVA tables and multiple comparison results for this data can be found in S1 Table, panels (I1, I2) Retinal TH levels across pre-exposure age; (J1, J2) Retinal TH levels across time of sacrifice.
Fig 5
Fig 5. Zebrafish Brain GAD65/67 levels vary with age.
Normalized brain GAD65/67 levels of zebrafish exposed to 1.5% ethanol (black bars) or water (gray bars) ± caffeine (0 mg/L; 25 mg/L, 100 mg/L). (A) There was a significant effect of pre-exposure age on brain GAD levels. GAD65/67 levels in brain tissue collected immediately after exposure showed a trend of increased levels when fish were exposed earlier, from 50–59 dpf, compared to later ages (60–149 dpf). (B) GAD65/67 levels assessed across the post-exposure time points showed a trend of greater GAD65/67 levels in subjects exposed after a long interval compared to those sacrificed immediately. The boxplots show the minimum, first quartile, median, third quartile, and maximum values for each measure after outliers were removed. Exposure ages (dpf) are indicated across the top of the bar graphs. For brain GAD levels, there were 4–6 independent replicates per treatment condition (each ethanol/caffeine dose) for a total of 35 subjects. ANOVA tables and multiple comparison results for this data can be found in S1 Table, panels (L1, L2) Brain GAD levels across pre-exposure age; (M) Brain GAD levels across time of sacrifice.
Fig 6
Fig 6. Zebrafish Retinal GAD65/67 levels were affected by caffeine.
Normalized retinal GAD65/67 levels from zebrafish exposed to 1.5% ethanol (black bars) or water/control (gray bars) ± caffeine (0 mg/L; 25 mg/L, 100 mg/L). (A) GAD65/67 levels in retinal tissue measured immediately after pre-exposure were increased in fish exposed from 140–149 dpf compared to 50–69 dpf (p<0.03). Retinal GAD 65/67 levels were also increased in fish exposed from 70–99 dpf compared to 50–69 dpf (p<0.02; asterisk). (B) Retinal GAD65/67 levels assessed across the post-exposure time points did not identify any differences across groups. The boxplots show the minimum, first quartile, median, third quartile, and maximum values for each measure after outliers were removed. Exposure ages (dpf) are indicated across the top of the bar graphs. For retina GAD levels, there were 4–6 independent replicates per treatment condition (each ethanol/caffeine dose) for a total of 35 subjects. ANOVA tables and multiple comparison results for this data can be found in S1 Table, panels (N1, N2) Retinal GAD levels across pre-exposure age; and (O) Retinal GAD levels across time.

Similar articles

References

    1. Beydoun M, Gamaldo A, Beydoun H, Tanaka T, Tucker K, Talegawkar S, et al.. Caffeine and alohol intakes and overall nutrient adequacy are associated with longitudinal cognitive performance among US adults. J Nutrition. 2014;144:890–901. - PMC - PubMed
    1. Mitchell D. Intake and exposure to caffeine. In: Pray L, Yaktine A, Pankevich D, editors. Caffeine in food and dietary supplements Examining safety Workshop Summary. Washington DC: National Academies Press; 2014. p. 11–30. - PubMed
    1. NIAAA. Underage Drinking 2020 [https://www.niaaa.nih.gov/publications/brochures-and-fact-sheets/underag....
    1. Gulick D, Gould T. Effects of ethanol and caffeine on behavior on C57BL/6 mice in the plus-maxe discriminative avoidance task. Behav Neurosci. 2009;123:1271–8. - PMC - PubMed
    1. Egan R, Bergner C, Hart P. Understanding behavioral and physiological phenotypes of stress and anxiety in zebrafish. Behav Brain Res. 2009;205:38–44. doi: 10.1016/j.bbr.2009.06.022 - DOI - PMC - PubMed

Publication types

LinkOut - more resources