

Construction and validation of a novel cuproptosis-mitochondrion prognostic model related with tumor immunity in osteosarcoma
- PMID: 37405988
- PMCID: PMC10321638
- DOI: 10.1371/journal.pone.0288180
Construction and validation of a novel cuproptosis-mitochondrion prognostic model related with tumor immunity in osteosarcoma
Abstract
Background: The purpose of this study was to develop a new prognostic model for osteosarcoma based on cuproptosis-mitochondrion genes.
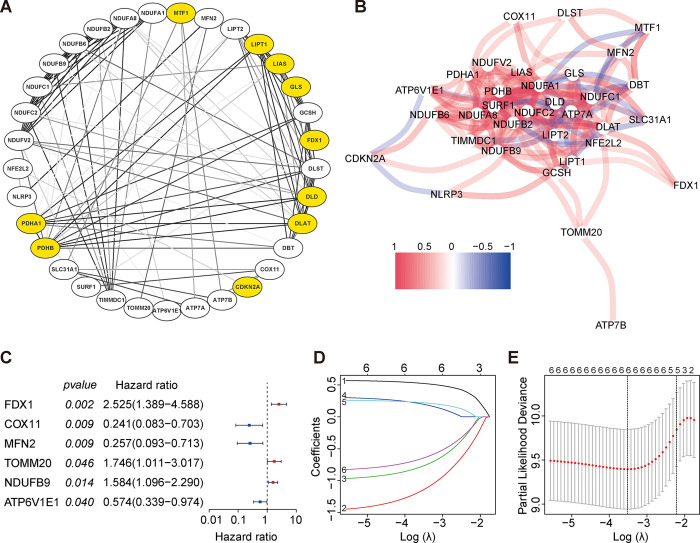
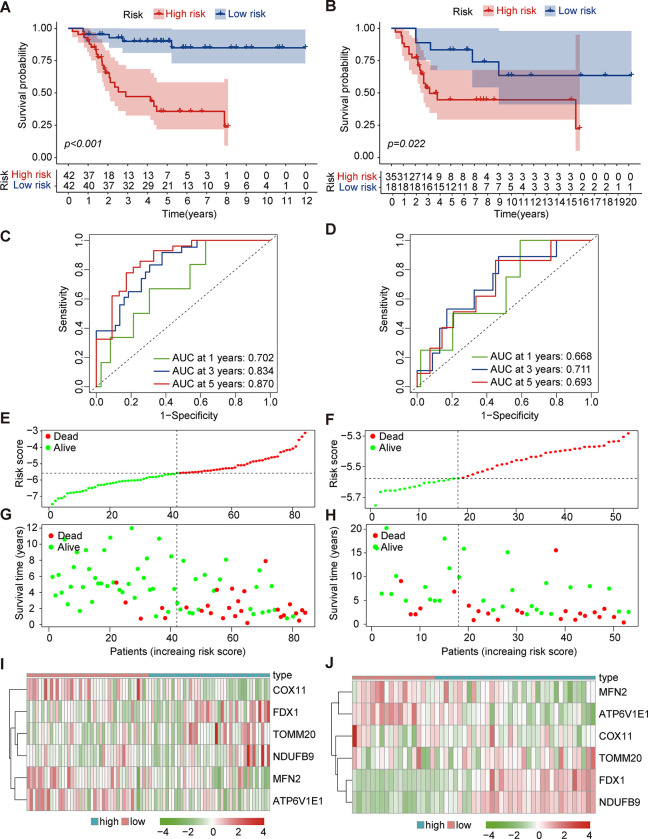
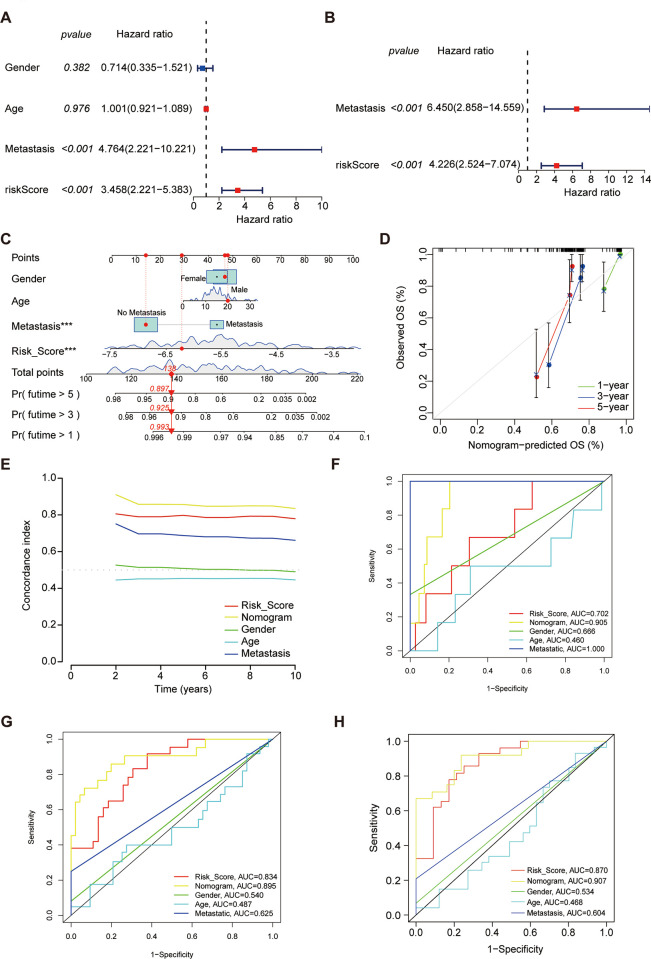
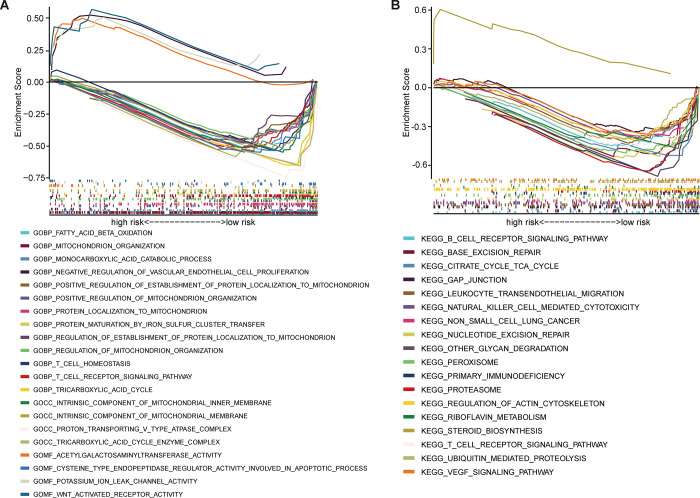
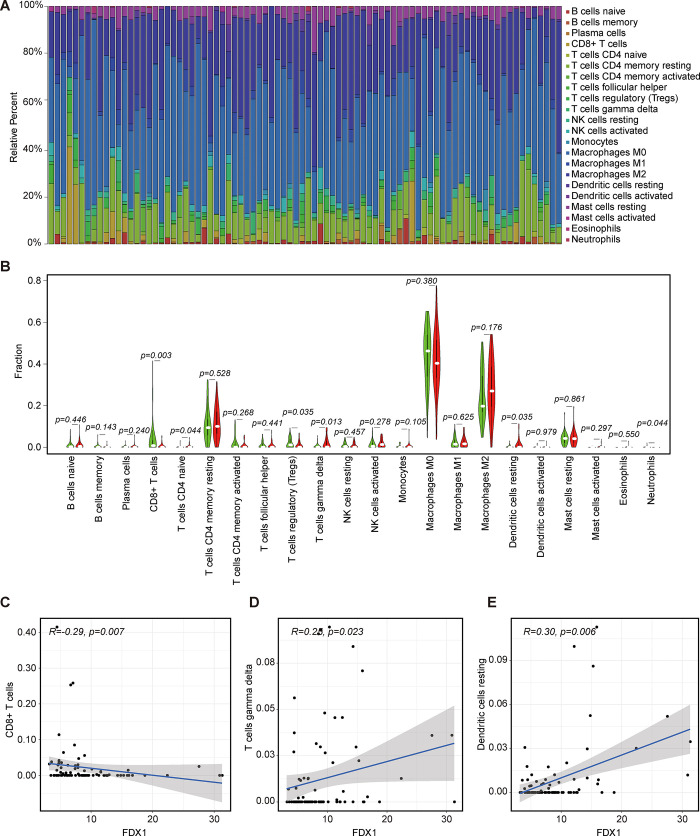
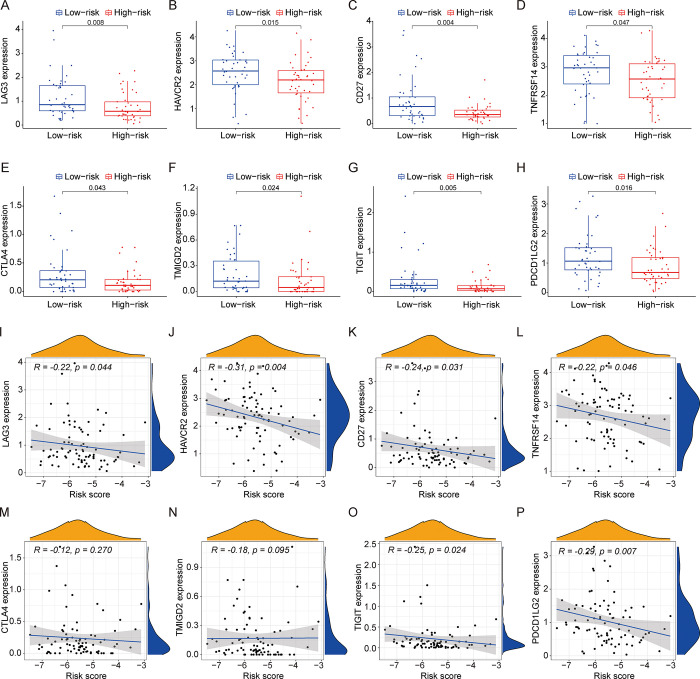
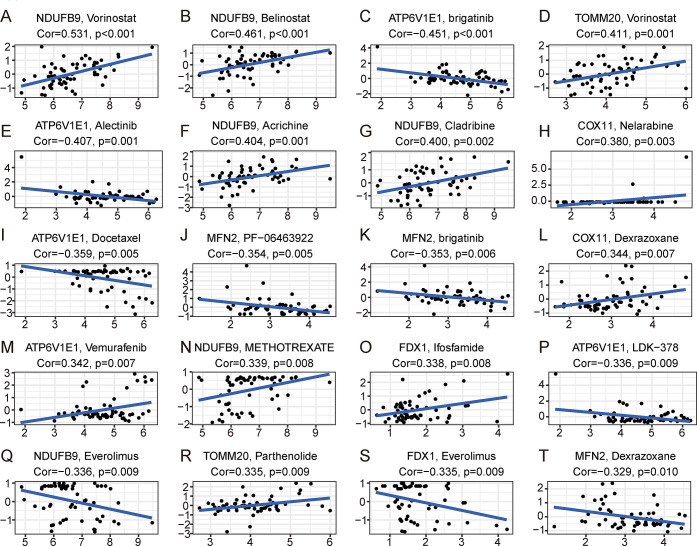
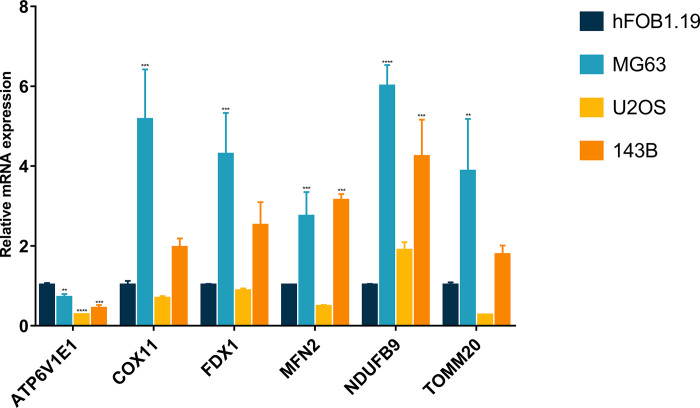
Materials and methods: The data of osteosarcoma were obtained from TARGET database. By using Cox regression and LASSO regression analysis, a novel risk score was constructed based on cuproptosis-mitochondrion genes. Kaplan-Meier, ROC curve and independent prognostic analyses were performed to validate the risk score in GSE21257 dataset. Then, a predictive nomogram was constructed and further validated by calibration plot, C-index and ROC curve. Based on the risk score, all patients were divided into high-risk and low-risk group. GO and KEGG enrichment, immune correlation and drug sensitivity analyses were performed between groups. Real-time quantitative PCR verified the expression of cuproptosis-mitochondrion prognostic model genes in osteosarcoma. And we explored the function of FDX1 in osteosarcoma by western blotting, CCK8, colony formation assay, wound healing assay and transwell assays.
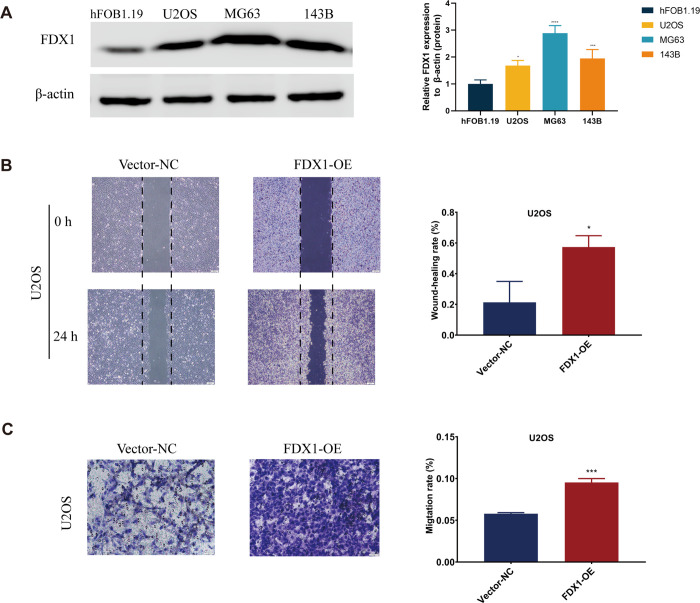
Results: A total of six cuproptosis-mitochondrion genes (FDX1, COX11, MFN2, TOMM20, NDUFB9 and ATP6V1E1) were identified. A novel risk score and associated prognostic nomogram were constructed with high clinical application value. Strong differences in function enrichment and tumor immune microenvironment were shown between groups. Besides, the correlation of cuproptosis-mitochondrion genes and drug sensitivity were revealed to search for potential therapeutic target. The expression of FDX1, COX11, MFN2, TOMM20 and NDUFB9 at mRNA level was elevated in osteosarcoma cells compared with normal osteoblast hFOB1.19. The mRNA expression level of ATP6V1E1 was decreased in osteosarcoma. Compared with hFOB1.19, western blotting revealed that the expression of FDX1 was significantly elevated in osteosarcoma cells. Functional experiments indicated that FDX1 mainly promoted the migration of osteosarcoma rather than proliferation.
Conclusions: We developed a novel prognostic model of osteosarcoma based on cuproptosis-mitochondrion genes, which provided great guidance in survival prediction and individualized treatment decision making for patients with osteosarcoma.
Copyright: © 2023 Feng et al. This is an open access article distributed under the terms of the Creative Commons Attribution License, which permits unrestricted use, distribution, and reproduction in any medium, provided the original author and source are credited.
Conflict of interest statement
The authors have declared that no competing interests exist.
Figures
Similar articles
-
A novel signature to guide osteosarcoma prognosis and immune microenvironment: Cuproptosis-related lncRNA.Front Immunol. 2022 Jul 29;13:919231. doi: 10.3389/fimmu.2022.919231. eCollection 2022. Front Immunol. 2022. PMID: 35967366 Free PMC article.
-
Identification of cuproptosis-related subtypes, construction of a prognosis model, and tumor microenvironment landscape in gastric cancer.Front Immunol. 2022 Nov 21;13:1056932. doi: 10.3389/fimmu.2022.1056932. eCollection 2022. Front Immunol. 2022. PMID: 36479114 Free PMC article.
-
Identification of cuproptosis-related lncRNA prognostic signature for osteosarcoma.Front Endocrinol (Lausanne). 2022 Oct 13;13:987942. doi: 10.3389/fendo.2022.987942. eCollection 2022. Front Endocrinol (Lausanne). 2022. PMID: 36313774 Free PMC article.
-
Identification of a novel cuproptosis-related gene signature and integrative analyses in patients with lower-grade gliomas.Front Immunol. 2022 Aug 15;13:933973. doi: 10.3389/fimmu.2022.933973. eCollection 2022. Front Immunol. 2022. PMID: 36045691 Free PMC article. Review.
-
The effect of lipid metabolism on cuproptosis-inducing cancer therapy.Biomed Pharmacother. 2024 Mar;172:116247. doi: 10.1016/j.biopha.2024.116247. Epub 2024 Feb 7. Biomed Pharmacother. 2024. PMID: 38330710 Review.
Cited by
-
Prognostic and immunological characterization of osteosarcoma patients evaluated by liquid-liquid phase separation related genes.Discov Oncol. 2025 May 30;16(1):958. doi: 10.1007/s12672-025-02769-9. Discov Oncol. 2025. PMID: 40445434 Free PMC article.
-
The role of programmed cell death in osteosarcoma: From pathogenesis to therapy.Cancer Med. 2024 May;13(10):e7303. doi: 10.1002/cam4.7303. Cancer Med. 2024. PMID: 38800967 Free PMC article. Review.
-
Copper in the colorectal cancer microenvironment: pioneering a new era of cuproptosis-based therapy.Front Oncol. 2025 Jan 9;14:1522919. doi: 10.3389/fonc.2024.1522919. eCollection 2024. Front Oncol. 2025. PMID: 39850821 Free PMC article. Review.
-
Cuproptosis and its potential role in musculoskeletal disease.Front Cell Dev Biol. 2025 Apr 11;13:1570131. doi: 10.3389/fcell.2025.1570131. eCollection 2025. Front Cell Dev Biol. 2025. PMID: 40292330 Free PMC article. Review.
References
-
- Bielack SS, Kempf-Bielack B, Delling G, Exner GU, Flege S, Helmke K, et al.. Prognostic factors in high-grade osteosarcoma of the extremities or trunk: an analysis of 1,702 patients treated on neoadjuvant cooperative osteosarcoma study group protocols. J Clin Oncol. 2002;20(3):776–90. Epub 2002/02/01. doi: 10.1200/JCO.2002.20.3.776 . - DOI - PubMed
Publication types
MeSH terms
Substances
LinkOut - more resources
Full Text Sources
Medical
