. 2023 Jul 5;17(7):e0011089.
doi: 10.1371/journal.pntd.0011089. eCollection 2023 Jul.

Schistosoma mansoni infection alters the host pre-vaccination environment resulting in blunted Hepatitis B vaccination immune responses

Affiliations

Schistosoma mansoni infection alters the host pre-vaccination environment resulting in blunted Hepatitis B vaccination immune responses

Roshell Muir et al. PLoS Negl Trop Dis. .

Abstract

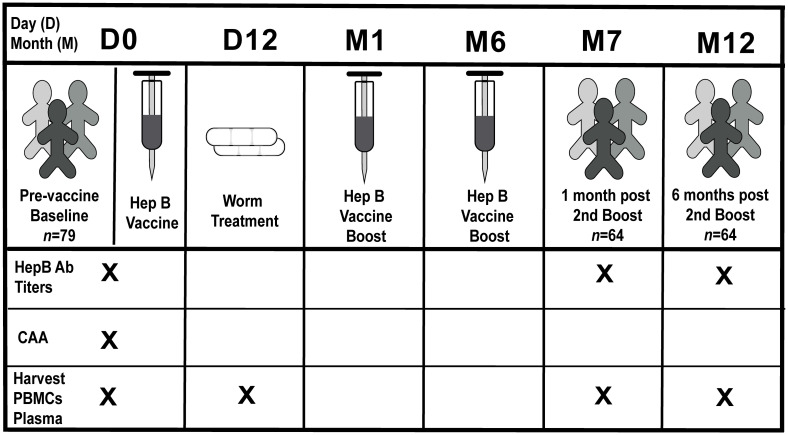
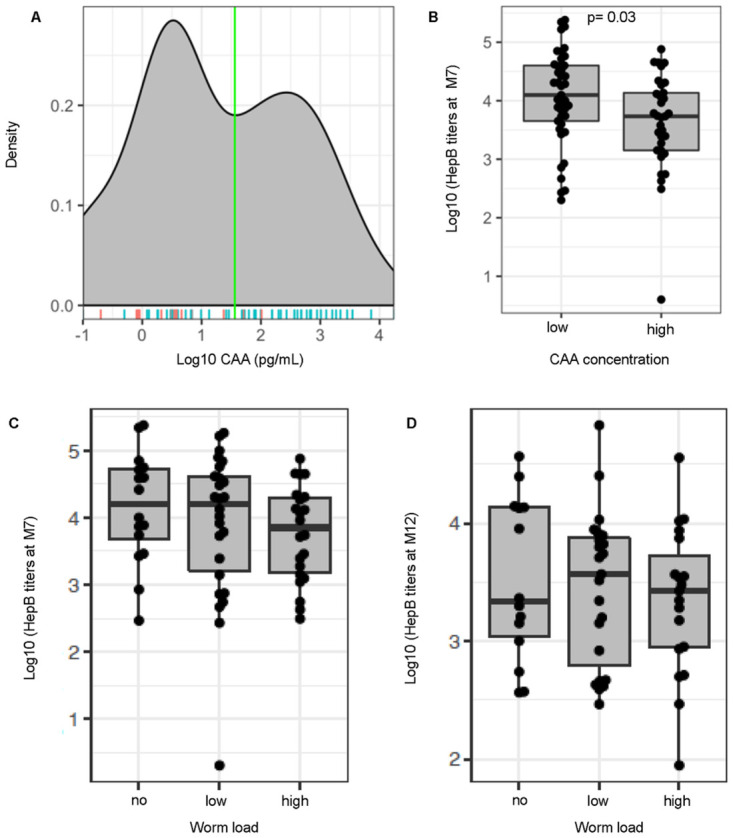
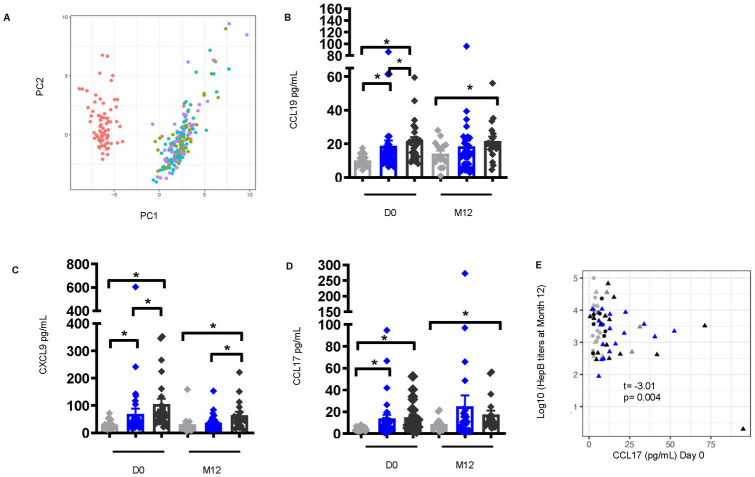
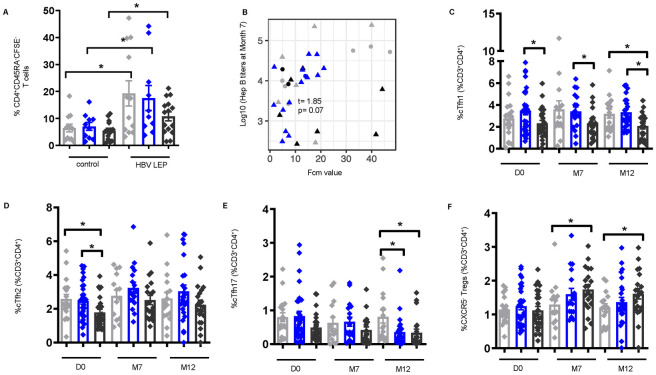
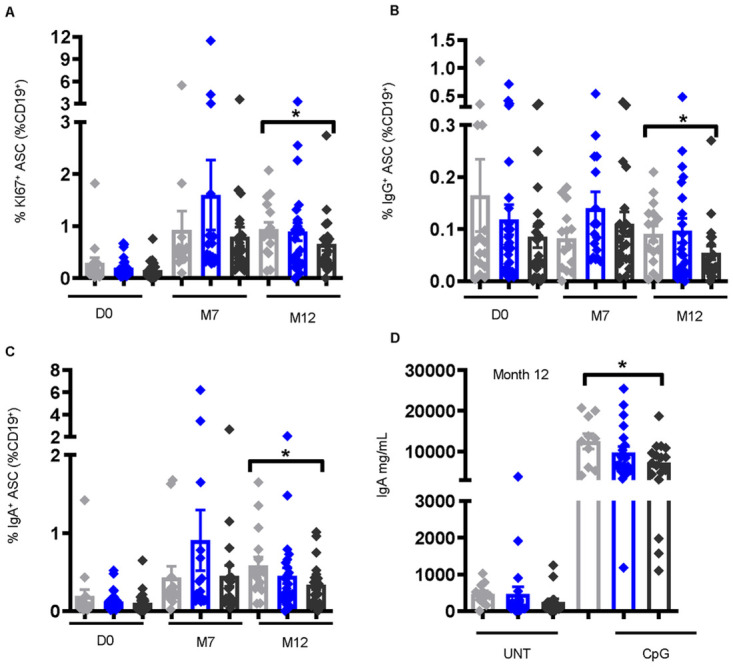
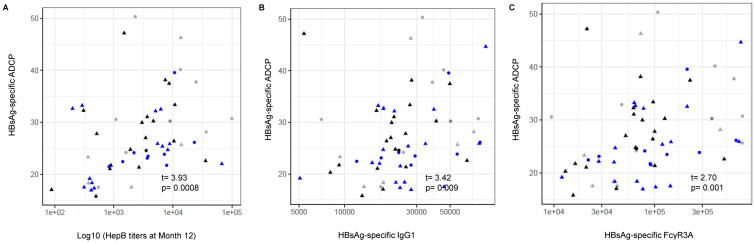
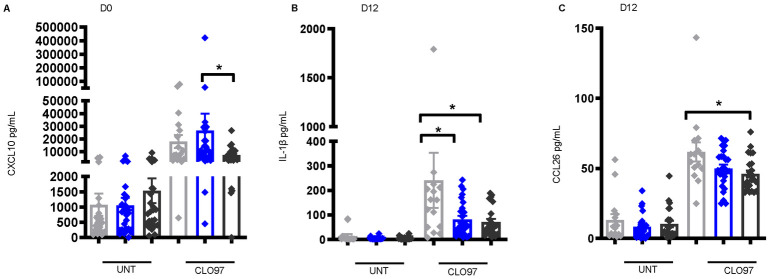
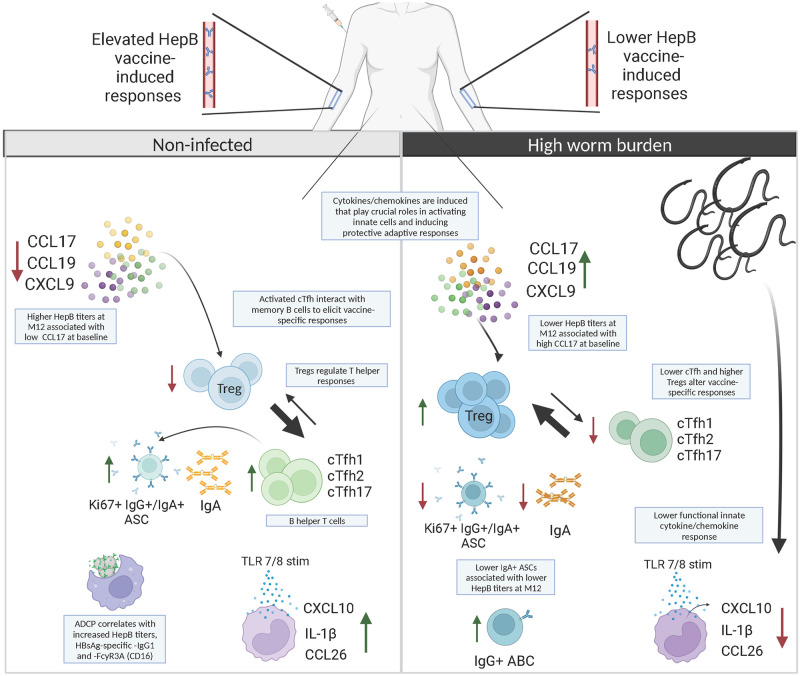
Schistosomiasis is a disease caused by parasitic flatworms of the Schistosoma spp., and is increasingly recognized to alter the immune system, and the potential to respond to vaccines. The impact of endemic infections on protective immunity is critical to inform vaccination strategies globally. We assessed the influence of Schistosoma mansoni worm burden on multiple host vaccine-related immune parameters in a Ugandan fishing cohort (n = 75) given three doses of a Hepatitis B (HepB) vaccine at baseline and multiple timepoints post-vaccination. We observed distinct differences in immune responses in instances of higher worm burden, compared to low worm burden or non-infected. Concentrations of pre-vaccination serum schistosome-specific circulating anodic antigen (CAA), linked to worm burden, showed a significant bimodal distribution associated with HepB titers, which was lower in individuals with higher CAA values at month 7 post-vaccination (M7). Comparative chemokine/cytokine responses revealed significant upregulation of CCL19, CXCL9 and CCL17 known to be involved in T cell activation and recruitment, in higher CAA individuals, and CCL17 correlated negatively with HepB titers at month 12 post-vaccination. We show that HepB-specific CD4+ T cell memory responses correlated positively with HepB titers at M7. We further established that those participants with high CAA had significantly lower frequencies of circulating T follicular helper (cTfh) subpopulations pre- and post-vaccination, but higher regulatory T cells (Tregs) post-vaccination, suggesting changes in the immune microenvironment in high CAA could favor Treg recruitment and activation. Additionally, we found that changes in the levels of innate-related cytokines/chemokines CXCL10, IL-1β, and CCL26, involved in driving T helper responses, were associated with increasing CAA concentration. This study provides further insight on pre-vaccination host responses to Schistosoma worm burden which will support our understanding of vaccine responses altered by pathogenic host immune mechanisms and memory function and explain abrogated vaccine responses in communities with endemic infections.


Conflict of interest statement

The authors have declared that no competing interests exist.

Figures

Fig 1
Fig 1. Clinical study design.
Participants enrolled in the clinical study (n = 79, four donor samples were unavailable for analysis in this study) were vaccinated at baseline [(pre-vaccination) day 0 (D0)] and received two boosters at month 1 (M1) and month 6 (M6). Sera samples were collected at D0, month 7 post-vaccination (M7) (one month post-booster 2) and month 12 post-vaccination (M12) (six months post-booster 2), and PMBCs and plasma were collected at D0, D12, M7 and M12 for subsequent analysis. Stool samples were collected at D0, D3 or D7 for egg count analysis. Egg positive individuals were treated at day 12 post-vaccination (D12) with Praziquantel (PZQ). X denotes corresponding samples collected at that timepoint.
Fig 2
Fig 2. Higher CAA concentration pre-vaccination is associated with a reduction in Hepatitis B vaccine titers.
(A) Density of Schistosome-specific antigen values (CAA [pg/ml]) analyzed in serum samples from participants pre-vaccination (D0). A binomial distribution was fitted to the CAA values and a maximum-likelihood was used to identify the optimum cutoff separating the two modes of the CAA values. Two groups of participants were then identified based on CAA values [low CAA (<36pg/mL CAA), n = 41; high CAA (≥36pg/mL CAA), n = 33]. Male (blue line), n = 53; Female (red line), n = 21 (B) Hepatitis B (HepB) titers (log pg/mL) determined by commercial immunoassays for individuals at M7 post-vaccination plotted to compare low and high CAA. Participants were further defined based on CAA concentration values using methodology from the CAA assay that allowed detection of samples as low as 3pg/mL [non-infected [no] (<3pg/mL CAA), low CAA [low] (3–100 pg/mL CAA), and high CAA [high] (>100pg/mL CAA)]. HepB titers for individuals at (C) Month 7 post-vaccination [non-infected n = 16, low CAA, n = 26 and high CAA, n = 22] and (D) Month 12 post-vaccination [non-infected, n = 14, low CAA, n = 23, high CAA, n = 19] plotted to compare CAA. Boxplots show median values (horizontal line), interquartile range (box) and 95% confidence interval (whiskers).
Fig 3
Fig 3. Elevated levels of plasma cytokines/chemokines involved in lymphocyte cell migration and activation pre-vaccination in individuals with S. mansoni infection persist at month 12 post-vaccination.
(A) Principal component analysis of plasma cytokines/chemokines pre-vaccination and after Hepatitis B vaccination was conducted and the first (PC1) and second (PC2) principal components were used to plot samples based on their plasma cytokines/chemokines profiles. Each dot corresponds to a sample and colors denote the timepoint the sample was collected. [D0- red, D3- green, D7- blue, and M12- purple]. Plasma levels of (B) CCL19, (C) CXCL9, and (D) CCL17 [non-infected pre-vaccination (D0), n = 19, low CAA, n = 32, and high CAA, n = 24; M12 post-vaccination, n = 15, low CAA, n = 29, and high CAA, n = 19]. Data shown as ± SEM. * P ≤ 0.05. Wilcoxon rank-sum test performed on non-infected vs. low CAA, or non-infected vs. high CAA, or low CAA vs. high CAA within each time point D0 or M12. Non-infected- light grey, low CAA—blue, and high CAA—dark grey. (E) Scatter plot of Hepatitis B titers at M12 as a function of plasma CCL17 cytokine levels at D0 [non-infected, n = 19, low CAA, n = 32, high CAA, n = 24]. Linear regressions were fit between Hepatitis B titers and the cytokines adjusted for sex and student t-tests were used to evaluate for the significance of the association. t (t-statistic). P ≤ 0.05 was considered significant. (Shape: circle-females, triangle-males; color: grey- non-infected, black-low CAA, blue- high CAA).
Fig 4
Fig 4. Frequencies of circulating follicular helper (cTfh) cells are lower pre- and post-vaccination in S. mansoni infection with concurrent higher frequencies of regulatory T cells (Tregs) in individuals with high CAA concentration.
(A) Frequencies of CFSE- CD4+CD45RA- memory T (CD4+ mem) cells identified by flow cytometry of PBMCs at M7 post vaccination [non-infected, n = 12, low CAA, n = 10, and high CAA, n = 15] stimulated for 6 days with hepatitis B long envelope protein peptide (HBV LEP) or DMSO control (control). Non-infected- light grey, low CAA—blue, and high CAA—dark grey. Wilcoxon matched-pairs signed rank test performed on control vs. HBV LEP for each non-infected, or low CAA, or high CAA. Data shown as ± SEM. *P ≤ 0.05. (B) Linear regressions fit between Hepatitis B titers and CFSE- CD4+ mem T cells, adjusted for sex, and student t-tests evaluated for the significance of the association. t (t-statistic). P ≤ 0.05 was considered significant. (Shape: triangle-Male, circle-Female; color: grey- non-infected, black- low CAA, blue- high CAA). Frequencies of CD3+CD4+CD45RA-CD25-CXCR5+ populations: (C) cTfh1 [CXCR3+], (D) cTfh2 [CXCR3-CCR6-], (E) cTfh17 [CXCR3-CCR6+], and (F) CXCR5-Tregs [CD3+CD4+CD45RA-CD127-CD25+Foxp3+CXCR5-] identified by flow cytometry of PBMCs pre-vaccination (D0) [non-infected, n = 19, low CAA, n = 31, high CAA, n = 25], M7 post-vaccination [non-infected, n = 14, low CAA, n = 17, high CAA, n = 20], and M12 post-vaccination [non-infected, n = 16, low CAA, n = 24, high CAA, n = 20]. Data shown as ± SEM. *P ≤ 0.05. Wilcoxon rank-sum test performed on non-infected vs. low CAA, or non-infected vs. high CAA, or low CAA vs. high CAA for each time point separately D0, M7, or M12. Non-infected- light grey, low CAA—blue, and high CAA—dark grey.
Fig 5
Fig 5. Frequencies of antibody secreting cells (ASCs) are lower at month 12 post-vaccination in individuals with high CAA concentration.
Frequencies of (A) KI67+ ASCs [CD19+CD10-IgD-CD71+CD38+CD20-], (B) IgG+ ASCs, and (C) IgA+ ASCs, identified by flow cytometry of PBMCs pre-vaccination (D0) [non-infected, n = 16, low CAA, n = 29, high CAA, n = 24], M7 post-vaccination [non-infected, n = 14, low CAA, n = 17, high CAA, n = 20], and M12 post-vaccination [non-infected, n = 16, low CAA, n = 23, high CAA, n = 21]. Data shown as ± SEM. * P ≤ 0.05. Wilcoxon rank-sum test performed on non-infected vs. low CAA, or non-infected vs. high CAA, or low CAA vs. high CAA for each time point separately D0, M7, or M12. (D) IgA levels at M12 post-vaccination in the culture supernatant of PBMCs stimulated for 7 days with CpG (CpG-ODN [TLR9]) or UNT (untreated) [D0 non-infected, n = 14, low CAA, n = 27, high CAA, n = 21; M12 post-vaccination non-infected, n = 10, low CAA, n = 20, and high CAA, n = 17]. Data shown as ± SEM. * P ≤ 0.05. Wilcoxon matched-pairs signed rank test performed on UNT vs. CpG for each non-infected, or low CAA, or high CAA, and within the CpG-treated group a Wilcoxon rank-sum test on non-infected vs. low CAA, or non-infected vs. high CAA, or low CAA vs. high CAA. Non-infected- light grey, low CAA—blue, and high CAA—dark grey.
Fig 6
Fig 6. Monocyte function is important in and significantly correlate with Hepatitis B vaccine responses.
Antibody-dependent cellular phagocytosis (ADCP) assays conducted with serum [pre-vaccination- non-infected, n = 14, low CAA, n = 20, high CAA, n = 18] and cells from the monocyte cell line THP-1. Scatter plots show HBsAg-specific ADCP associations with (A) Hepatitis B titers at M12, and with (B) HBsAg-specific IgG1, and (C) HbsAg-specific antibody binding to FcγR3A (CD16) expression determined by antibody subclass and Fc receptor binding assays. Spearman correlation and t-test were used to evaluate for the significance of the correlation. coef (regression coefficient). t (t-statistic). P ≤ 0.05 was considered significant. (Shape: triangle-Male, circle-Female; color: grey- non-infected, black- low CAA, blue- high CAA).
Fig 7
Fig 7. Lower levels of cytokines/chemokines important in innate immune cell function in S. mansoni-infected individuals pre-vaccination and day 12 post-vaccination.
(A) CXCL10 levels pre-vaccination (D0) [non-infected, n = 19, low CAA, n = 31, and high CAA, n = 25], and (B) IL-1β, and (C) CCL26levels at D12 post vaccination [non-infected, n = 15, low CAA, n = 26, high CAA, n = 23] in the culture supernatant of PBMCs stimulated for 18 hours with CLO97 (TLR7/8 agonist) or untreated (UNT). Data shown as ± SEM. * P ≤ 0.05 Wilcoxon matched-pairs signed rank test performed on UNT vs. CLO97 or each non-infected, or low CAA, or high CAA, and within the CLO97-treated group a Wilcoxon rank-sum test on non-infected vs. low CAA, or non-infected vs. high CAA, or low CAA vs. high CAA. Non-infected- light grey, low CAA—blue, and high CAA—dark grey.
Fig 8
Fig 8. Immunological alterations in high worm burden Hepatitis B-vaccinated hosts with Schistosoma mansoni infection.
In instances of high schistosome-specific circulating anodic antigen (CAA) concentration pre-vaccination (higher worm burden) we observe an association with altered HepB vaccine responses. High worm burden pre-vaccination is associated with higher levels of CCL17 and higher frequencies of Tregs post-vaccination. Concurrently, high worm burden is also associated with lower frequencies of the B-helper T cells, cTfh, lower proliferating and multi-isotype ASCs post-vaccination, and alterations in the early innate cytokine/chemokine microenvironment. These findings suggest that the level of Schistosoma worm burden in infected individuals can create a pre-vaccination microenvironment that cooperates to modulate optimal host immune responses to HepB vaccination thereby increasing the risk for endemic communities of infection against vaccine-preventable diseases. Created with Biorender.com.

Update of

References

    1. Pollard AJ, Bijker EM. A guide to vaccinology: from basic principles to new developments. Nat Rev Immunol. 2021;21(2):83–100. doi: 10.1038/s41577-020-00479-7 - DOI - PMC - PubMed
    1. Zimmermann P, Curtis N. Factors That Influence the Immune Response to Vaccination. Clin Microbiol Rev. 2019;32(2). doi: 10.1128/CMR.00084-18 - DOI - PMC - PubMed
    1. Driciru E, Koopman JPR, Cose S, Siddiqui AA, Yazdanbakhsh M, Elliott AM, et al.. Immunological Considerations for Schistosoma Vaccine Development: Transitioning to Endemic Settings. Front Immunol. 2021;12:635985. doi: 10.3389/fimmu.2021.635985 - DOI - PMC - PubMed
    1. Nono JK, Kamdem SD, Musaigwa F, Nnaji CA, Brombacher F. Influence of schistosomiasis on host vaccine responses. Trends Parasitol. 2022;38(1):67–79. doi: 10.1016/j.pt.2021.07.009 - DOI - PubMed
    1. Ssali A, Pickering L, Nalwadda E, Mujumbusi L, Seeley J, Lamberton PHL. Schistosomiasis messaging in endemic communities: Lessons and implications for interventions from rural Uganda, a rapid ethnographic assessment study. PLoS Negl Trop Dis. 2021;15(10):e0009893. doi: 10.1371/journal.pntd.0009893 - DOI - PMC - PubMed

Publication types

Substances