. 2022 Feb 8;34(3):1259-1268.
doi: 10.1021/acs.chemmater.1c03871. Epub 2022 Jan 18.

Peptidic Sulfhydryl for Interfacing Nanocrystals and Subsequent Sensing of SARS-CoV-2 Protease

Affiliations

Peptidic Sulfhydryl for Interfacing Nanocrystals and Subsequent Sensing of SARS-CoV-2 Protease

Zhicheng Jin et al. Chem Mater. .

Abstract

There is a need for surveillance of COVID-19 to identify individuals infected with SARS-CoV-2 coronavirus. Although specific, nucleic acid testing has limitations in terms of point-of-care testing. One potential alternative is the nonstructural protease (nsp5, also known as Mpro/3CLpro) implicated in SARS-CoV-2 viral replication but not incorporated into virions. Here, we report a divalent substrate with a novel design, (Cys)2-(AA)x-(Asp)3, to interface gold colloids in the specific presence of Mpro leading to a rapid and colorimetric readout. Citrate- and tris(2-carboxyethyl)phosphine (TCEP)-AuNPs were identified as the best reporter out of the 17 ligated nanoparticles. Furthermore, we empirically determined the effects of varying cysteine valence and biological media on the sensor specificity and sensitivity. The divalent peptide was specific to Mpro, that is, there was no response when tested with other proteins or enzymes. Furthermore, the Mpro detection limits in Tris buffer and exhaled breath matrices are 12.2 and 18.9 nM, respectively, which are comparable to other reported methods (i.e., at low nanomolar concentrations) yet with a rapid and visual readout. These results from our work would provide informative rationales to design a practical and noninvasive alternative for COVID-19 diagnostic testing-the presence of viral proteases in biofluids is validated.


Figures

Figure 1.
Figure 1.
Modular peptide design for colorimetric sensing of SARS-CoV-2 Mpro. (a) Conventional flanking design modifies the peptide head and tail with a cysteine (top). The novel peptide contains three modules, i.e., the surface anchor, the cleavage site, and the hydrophilic segment (bottom). (b) Ligand-like divalent peptide stabilizes nanoparticles (top), while the proteolytic fragments favor interparticle bridging (bottom). The green cartoon denotes the protease; Au1 and Au2 represent two different AuNPs. Transmission electron microscopy (TEM) images of the monodispersed 13 nm AuNPs mixed with the ligand-like divalent peptide (c) and the proteolytic fragments (d). The aggregation is induced via dithiol bridging. (e) Synthetic peptides with increasing number of cysteines, including CYS0, CYS1, CYS2, CYS4, and cys2. Here, the number after CYS implies the number of Cys residues and the lowercase cys is the scramble control. The AAs on the recognition site and functional motifs are color coded. SARS-CoV-2 main protease (Mpro) cleaves the peptide at Gln↓Ser (or Q↓S at the P1 and P1’ site). HPLC (f) and ESI-MS (g) data confirm the cleavage of CYS2 by Mpro. The peak with // is DMSO solvent with one CYS2 fragment, and the peak with * is the target of interest.
Figure 2.
Figure 2.
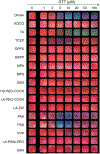
Dithiothreitol (DTT) test. AuNPs (13 nm, ~3.4 nM) coated with different ligands (n = 17) and incubated with increasing concentrations of DTT (i.e., from 0 to 100 μM, with 10 mM NaCl) 10 min after addition., Citrate-, TA-, TCEP-, PAA-, and PSS-capped AuNPs show color changes via a dithiol bridging mechanism. The red color represents dispersed nanoparticles while violet-blue indicates colloidal aggregates. Characterizations of these particles are given in Figures S2 and S3 and Table S2.
Figure 3.
Figure 3.
Characterization of peptide-capped AuNPs. (a) Absorption spectra collected from AuNP dispersion, as-grown (red) and after ligation with the synthetic peptides. (b) DLS profiles of citrate-AuNPs (DH = 18.2 nm, red) and other peptide-AuNPs. The DH for AuNPs ligated with CYS0, CYS1, CYS2, and CYS4 peptides is 64.3, 24.3, 24.4, and 28.2 nm, respectively. (c) Profiles for the aggregation factor vs time extracted from various dispersions of peptide-AuNPs (1 nM) in the presence of 20 mM DTT and 400 mM NaCl. PEGylated AuNPs were used as a reference. (d) Time-dependent progression of the SPR peak at 520 nm, extracted from a series of mixtures of peptide-AuNPs (1 nM) with 0.5 mM NaCN. (e–g) Absorption spectra collected from CYS1 (monovalent)-, CYS2 (divalent)-, and CYS4 (tetravalent)-AuNPs, following the reaction with 500 equiv of maleimide-TAMRA dye (structure in panel g). Inset schematics show that AuNPs with mono-/dithiol peptides cannot conjugate with the dye (7–25 dye/NP). In comparison, conjugates prepared starting with tetracysteine peptide-AuNPs yield an increasing conjugate of ~229, implying uncoordinated thiol groups on the Au surfaces for maleimide activation. The orange circle and purple and blue blocks in the ligand cartoon represent the peptide domain of the anchor, the cleavage site, and the solubilizing group. A close look on panel g is given in (h), where the spectrum of the deconvoluted dye resembles that of the dye alone (bottom, dash line).
Figure 4.
Figure 4.
Mpro-induced particle aggregation using the modular peptide. (a) Concentration-dependent optical absorption of citrate-AuNPs (2.8 nM, 120 μL), when incubated with intact CYS2 peptides (left) and the products of Mpro breakdown (c = 0–90 μM, right). Arrows designate sizable peak changes at 520 and 600 nm. (b) Time progression of ratiometric absorbance (Abs600/Abs520), where citrate-AuNPs (2.8 nM, 120 μL) are incubated with increasing concentrations of the CYS2 parent or its proteolytic fragments (0–90 μM). Tris buffer (5 mM, pH 8.0) was used and the time interval is 1 min. Error bar = standard deviation (n = 3). (c) Ratio of Abs600/Abs520 at 10 min collected from citrate-AuNPs (2.8 nM, 120 μL) incubated with various amounts of the CYS2 parent (red) and fragments (blue). The best working window is >30 μM. See also color evolution of citrate-AuNPs (2.8 nM, 120 μL) in the presence of the CYS2 parent (d) and fragments (e). These are cropped images where purple represents more aggregation (see color bar). (f) Fractional RGB (=VB/VR+G+B) extracted from panels (d, e) at 10 min. DLS profiles (g) and zeta potential (h) of citrate-AuNPs (2.8 nM, 120 μL) incubated with increasing concentrations of the CYS2 parent (blue) and its fragments (red). Error bars represent triplicate measurements for one sample. Ratiometric absorbance at 10 min collected from citrate-AuNPs (2.8 nM, 120 μL) incubated with various amounts of the CYS0 peptide (i), CYS1 peptide (j), CYS4 peptide (k), and their corresponding proteolytic fragments. The inset illustrates the decreased absorbance without the SPR shift. (l) View of MANTA size measurements shows that citrate-AuNPs scatter more blue light (small-sized, left) whereas the CYS2 fragment-induced colloidal aggregates scatter more red light (large-sized, right).
Figure 5.
Figure 5.
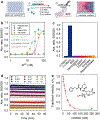
Determination of sensitivity and specificity. (a) Scheme of stepwise Mpro assay using a divalent peptide, including peptide/protease incubation in different media and subsequent use of AuNPs as the color/absorbance readout. (b) Ratiometric absorbance as a function of Mpro concentration. The CYS2 substrate (100 μM) and the 10 min readout time are applied. The linear region used to calculate LoDs can be found in Figure S5. Error bar = standard deviation (n = 2). (c) Sensor responsiveness by other mammalian proteins (50 nM), including bovine serum albumin (BSA), hemoglobin, trypsin, thrombin, α-amylase (50 U/mL), and neuraminidase (5 U/mL). Samples with and without Mpro were the positive and negative control. (d) Time progression of the ratiometric signal in inhibitor (i.e., GC376 chemical) assays. The molar ratio of [GC376]/[Mpro] varied from 0:1 to 5:1. (e) Typical inhibition titration curve with a guideline collected by using GC376 chemical. The inset shows the structure of GC376. Error bar = standard deviation (n = 2).

References

    1. Heuer-Jungemann A; Feliu N; Bakaimi I; Hamaly M; Alkilany A; Chakraborty I; Masood A; Casula MF; Kostopoulou A; Oh E; Susumu K; Stewart MH; Medintz IL; Stratakis E; Parak WJ; Kanaras AG The Role of Ligands in the Chemical Synthesis and Applications of Inorganic Nanoparticles. Chem. Rev 2019, 119, 4819–4880. - PubMed
    1. Almeida G; Infante I; Manna L Resurfacing halide perovskite nanocrystals. Science 2019, 364, 833–834. - PubMed
    1. Boles MA; Engel M; Talapin DV Self-Assembly of Colloidal Nanocrystals: From Intricate Structures to Functional Materials. Chem. Rev 2016, 116, 11220–11289. - PubMed
    1. Grzelczak M; Liz-Marzán LM; Klajn R Stimuli-responsive self-assembly of nanoparticles. Chem. Soc. Rev 2019, 48, 1342–1361. - PubMed
    1. Chen AN; McClain SM; House SD; Yang JC; Skrabalak SE Mechanistic Study of Galvanic Replacement of Chemically Heterogeneous Templates. Chem. Mater 2019, 31, 1344–1351.

LinkOut - more resources