. 2023 Sep 1;29(17):3438-3456.
doi: 10.1158/1078-0432.CCR-22-2854.

Combined CDK4/6 and ERK1/2 Inhibition Enhances Antitumor Activity in NF1-Associated Plexiform Neurofibroma

Affiliations

Combined CDK4/6 and ERK1/2 Inhibition Enhances Antitumor Activity in NF1-Associated Plexiform Neurofibroma

Alyssa C Flint et al. Clin Cancer Res. .

Erratum in

Abstract

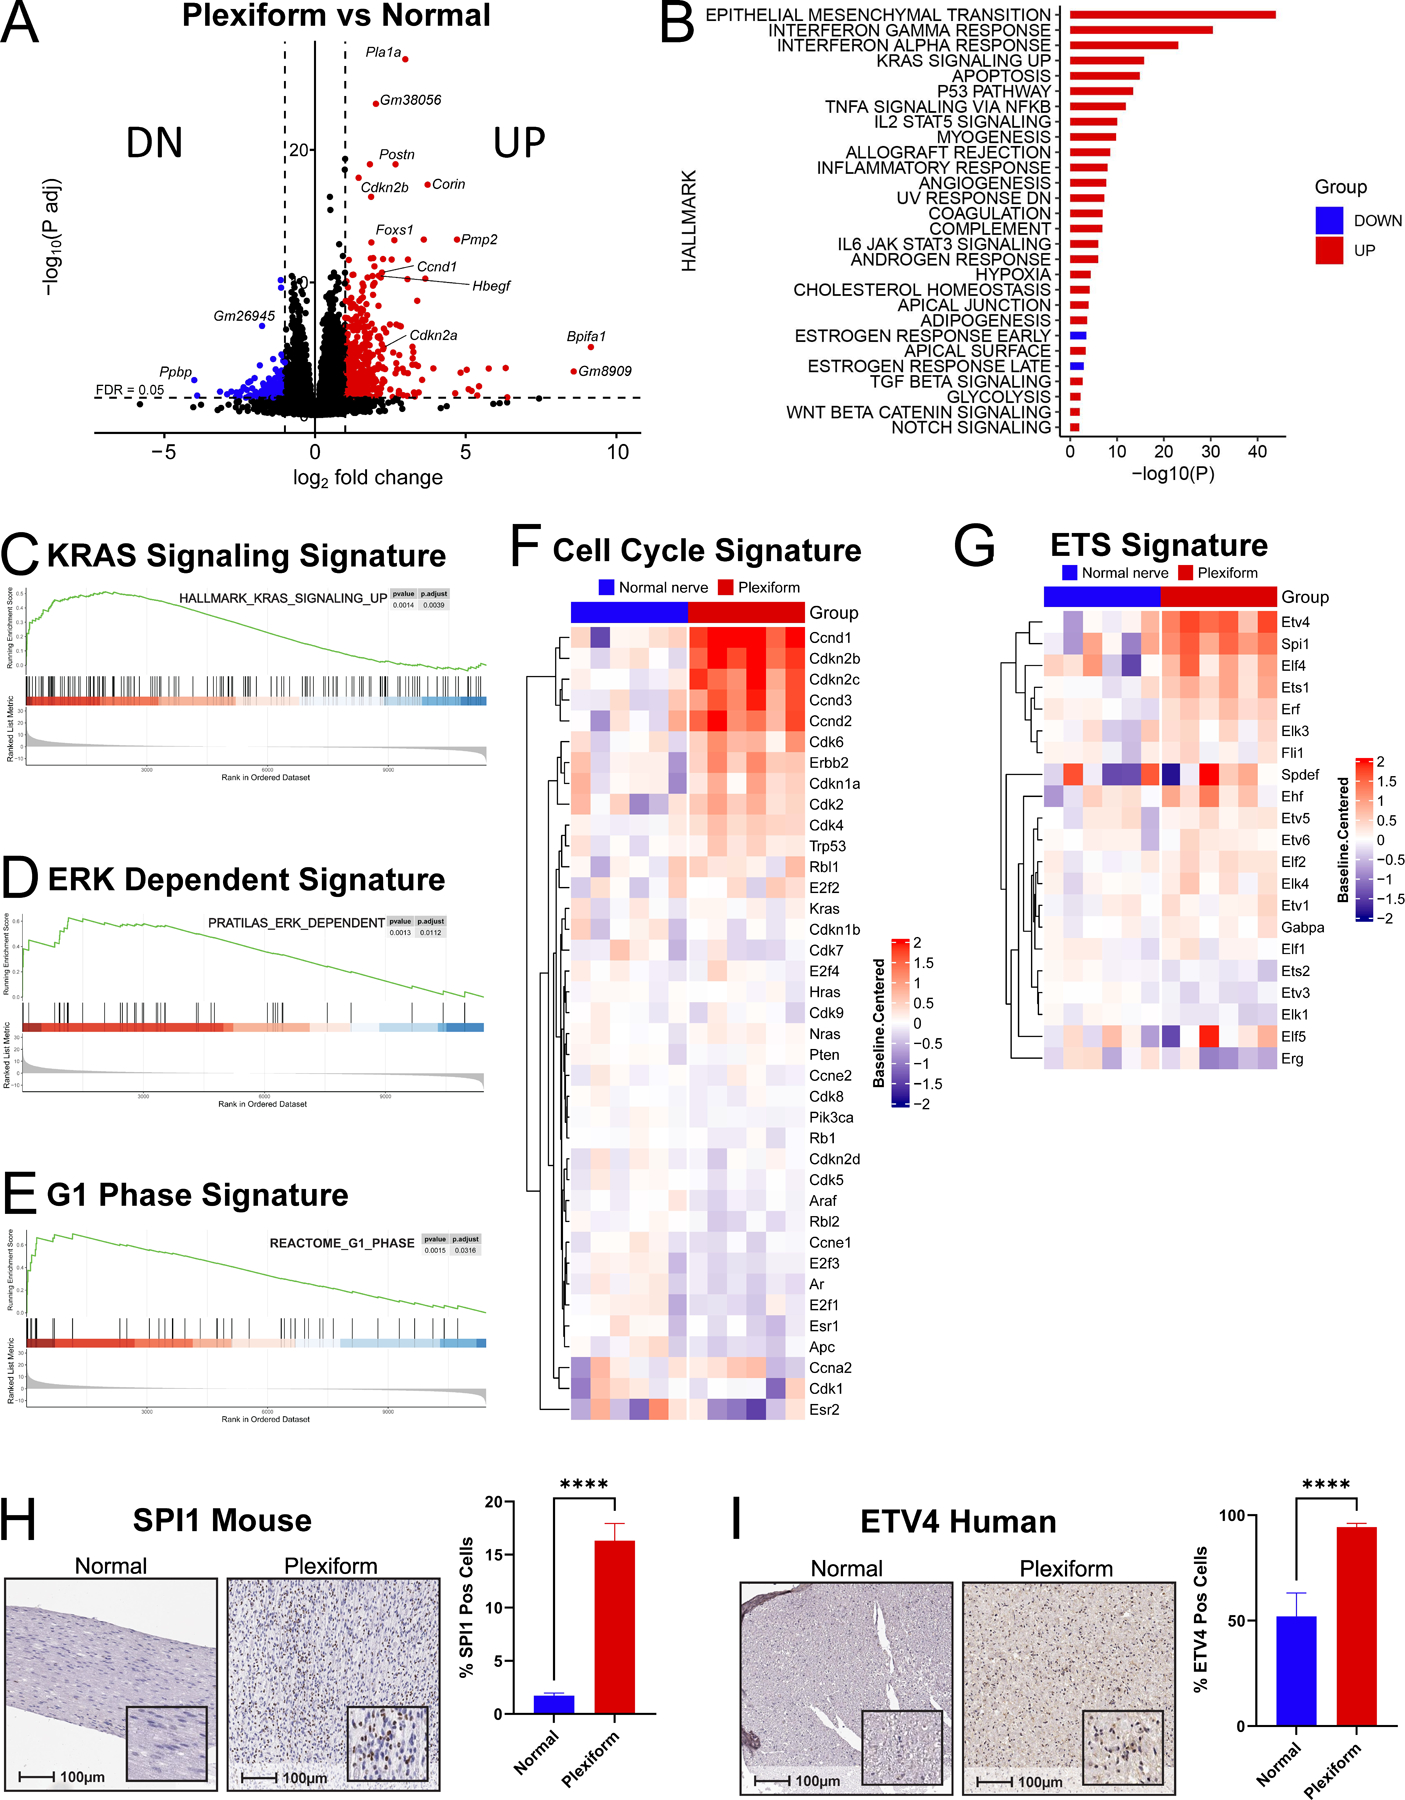
Purpose: Plexiform neurofibromas (PNF) are peripheral nerve sheath tumors that cause significant morbidity in persons with neurofibromatosis type 1 (NF1), yet treatment options remain limited. To identify novel therapeutic targets for PNF, we applied an integrated multi-omic approach to quantitatively profile kinome enrichment in a mouse model that has predicted therapeutic responses in clinical trials for NF1-associated PNF with high fidelity.

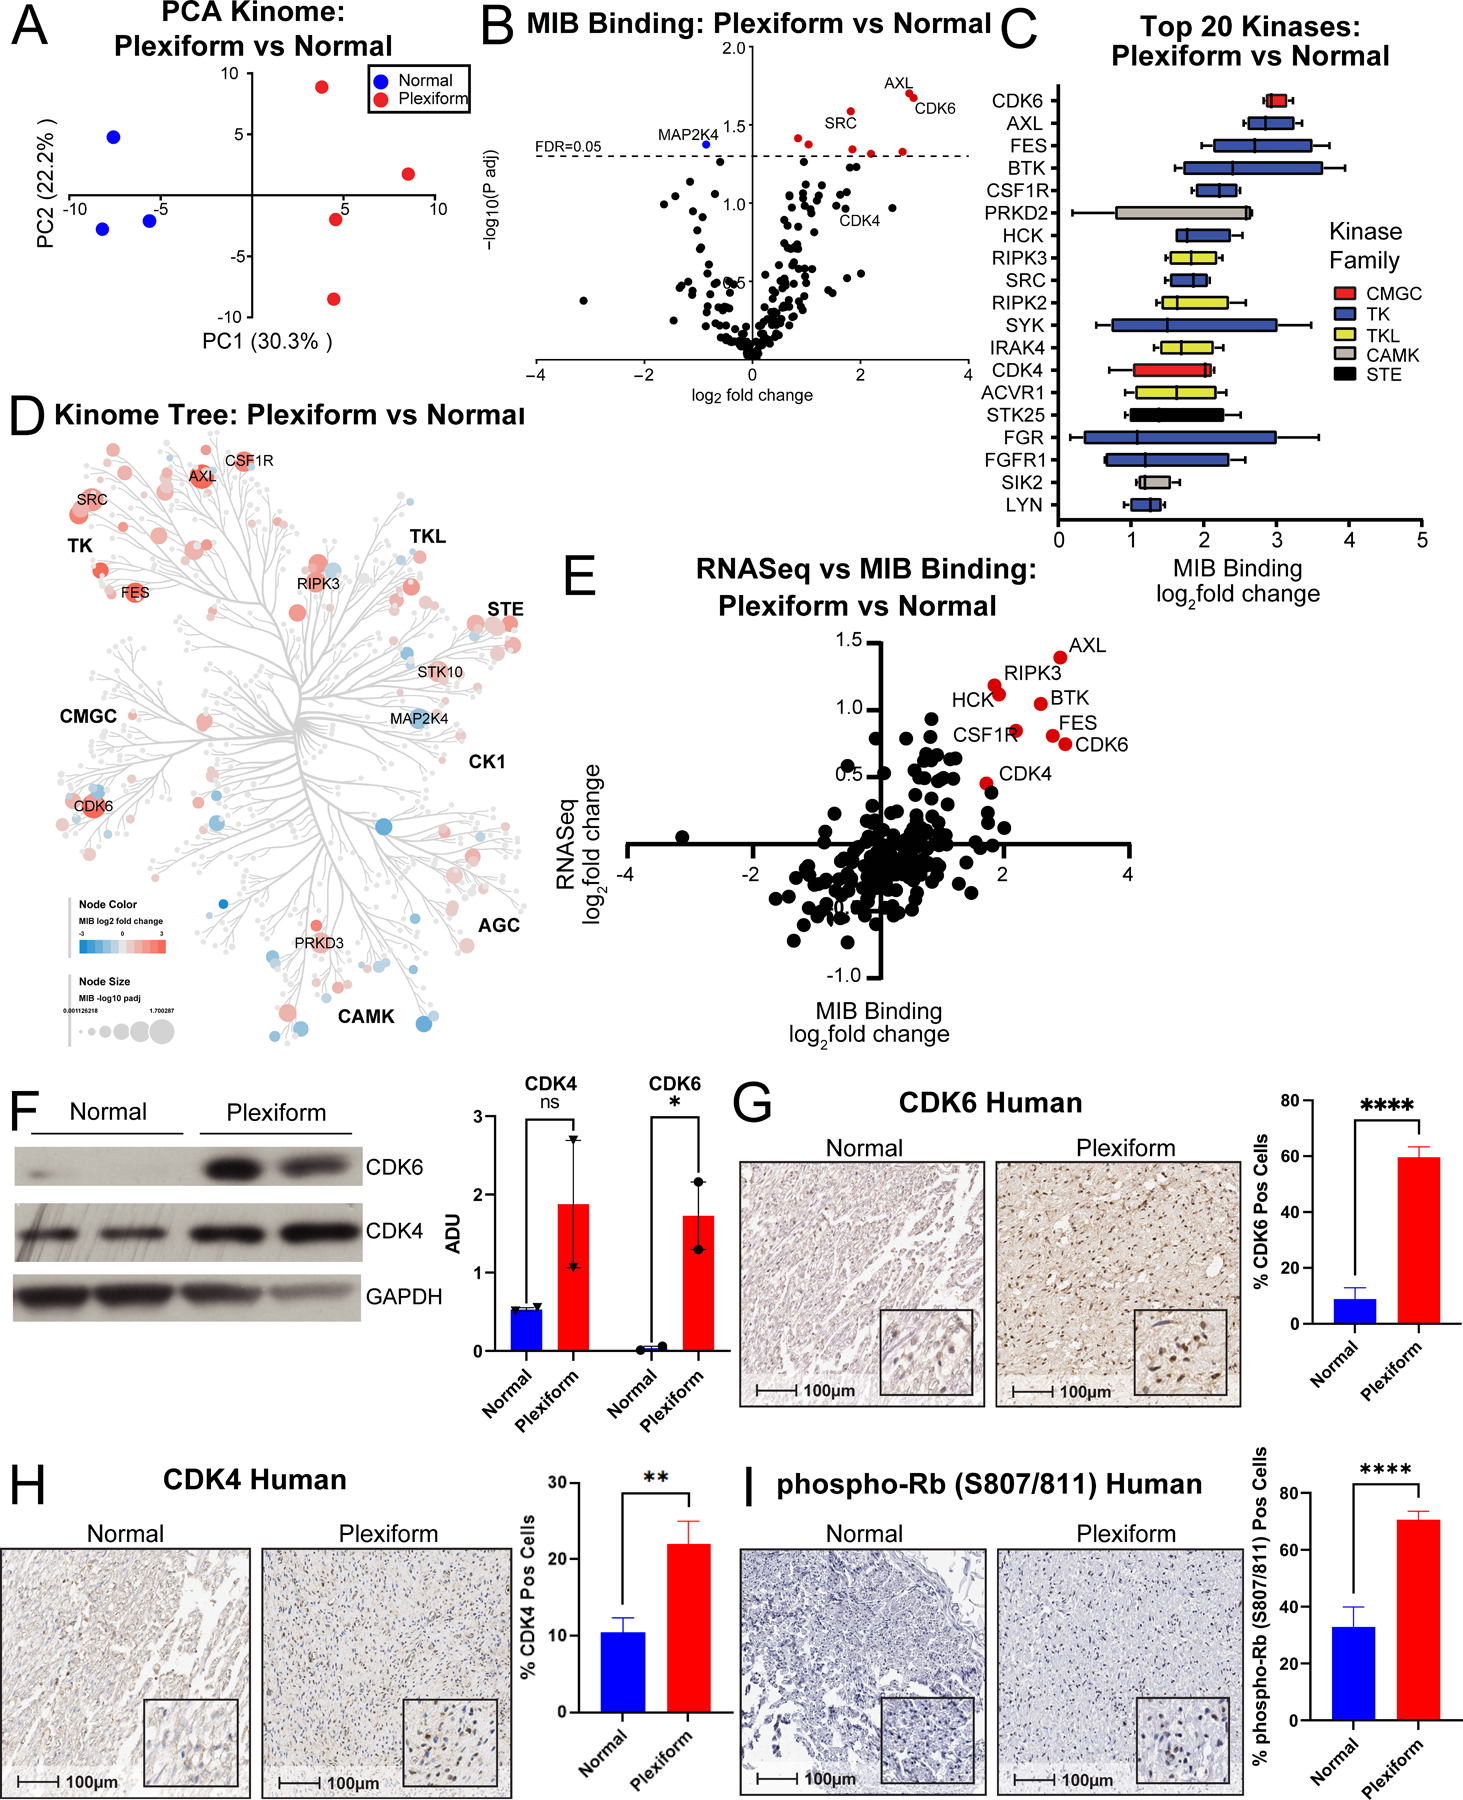
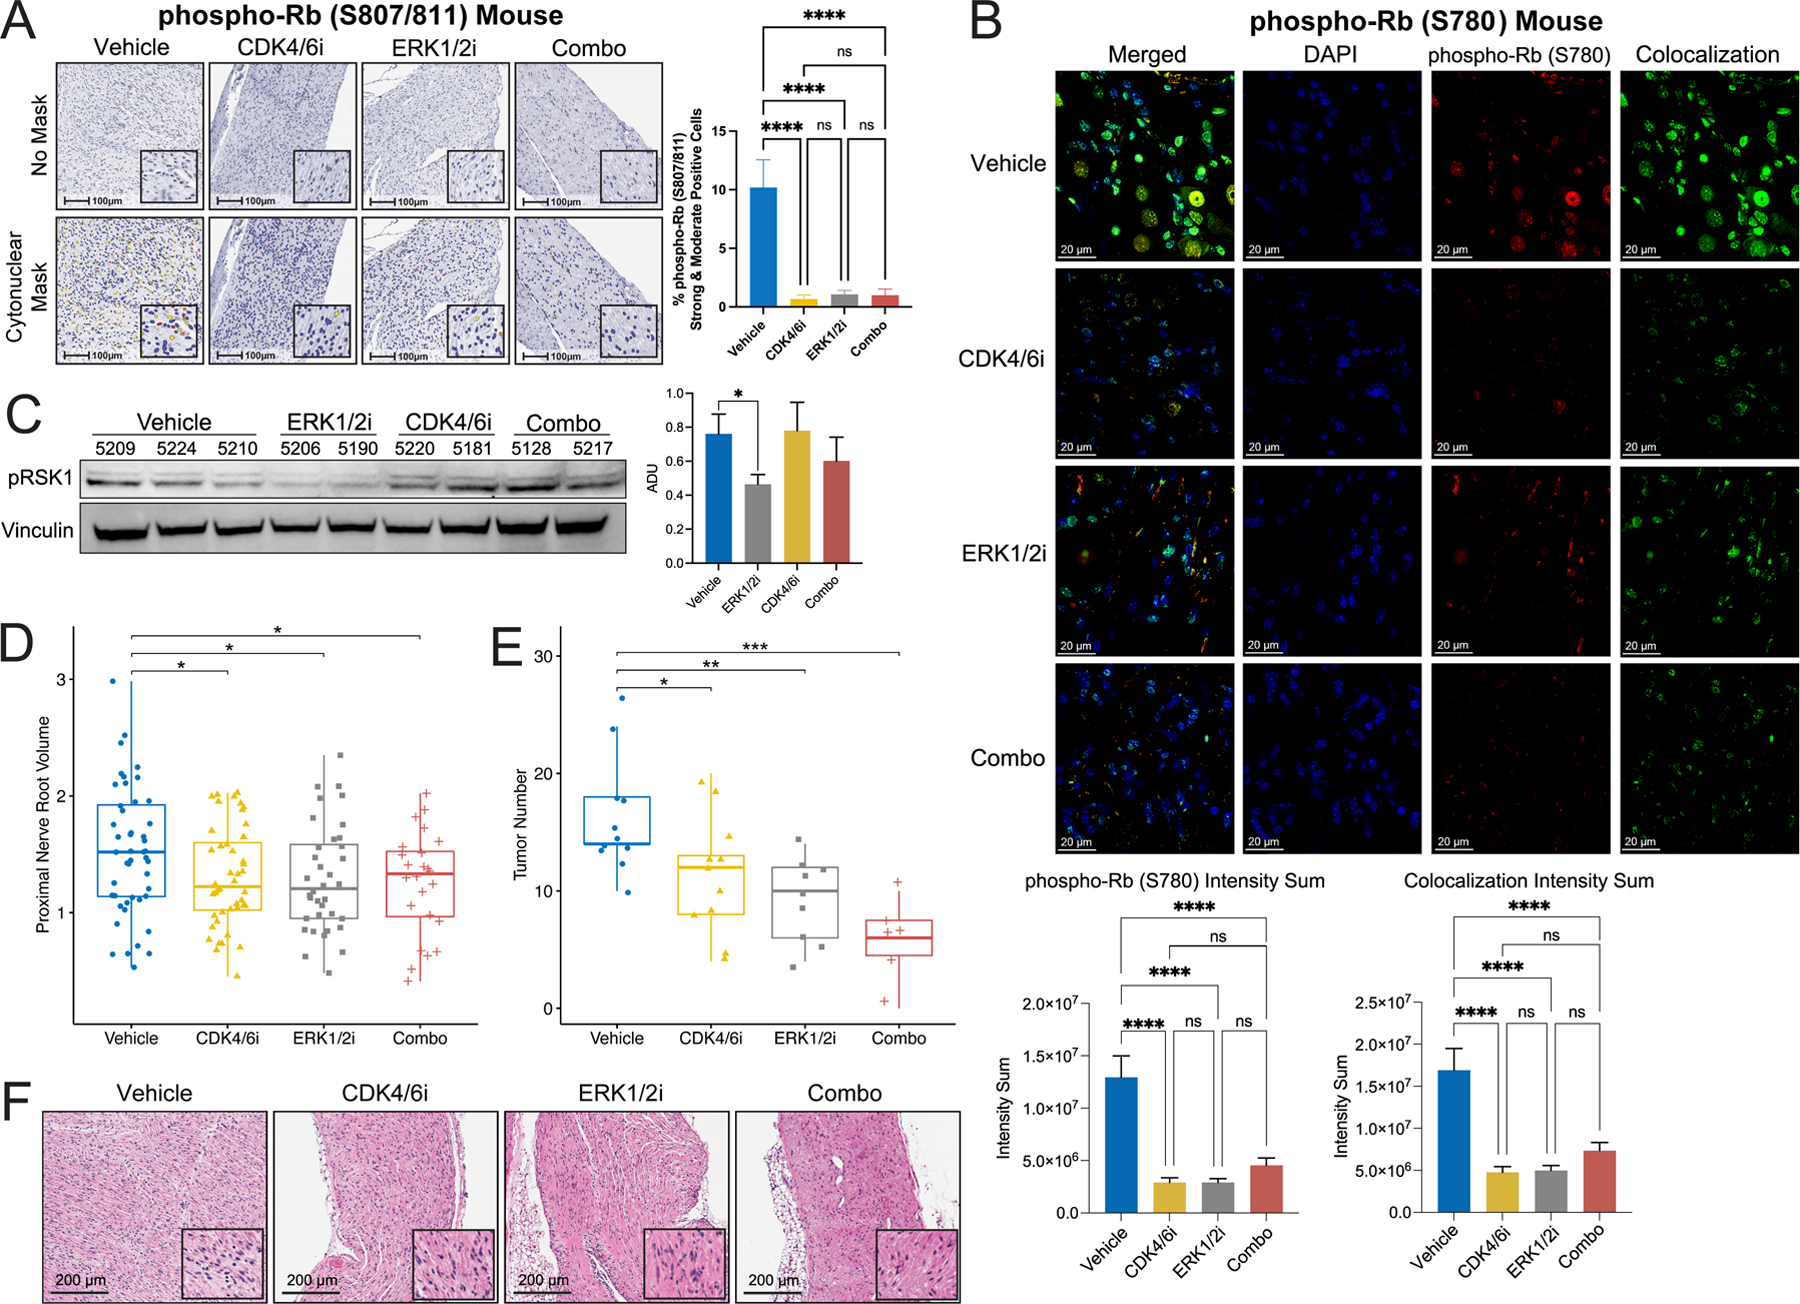
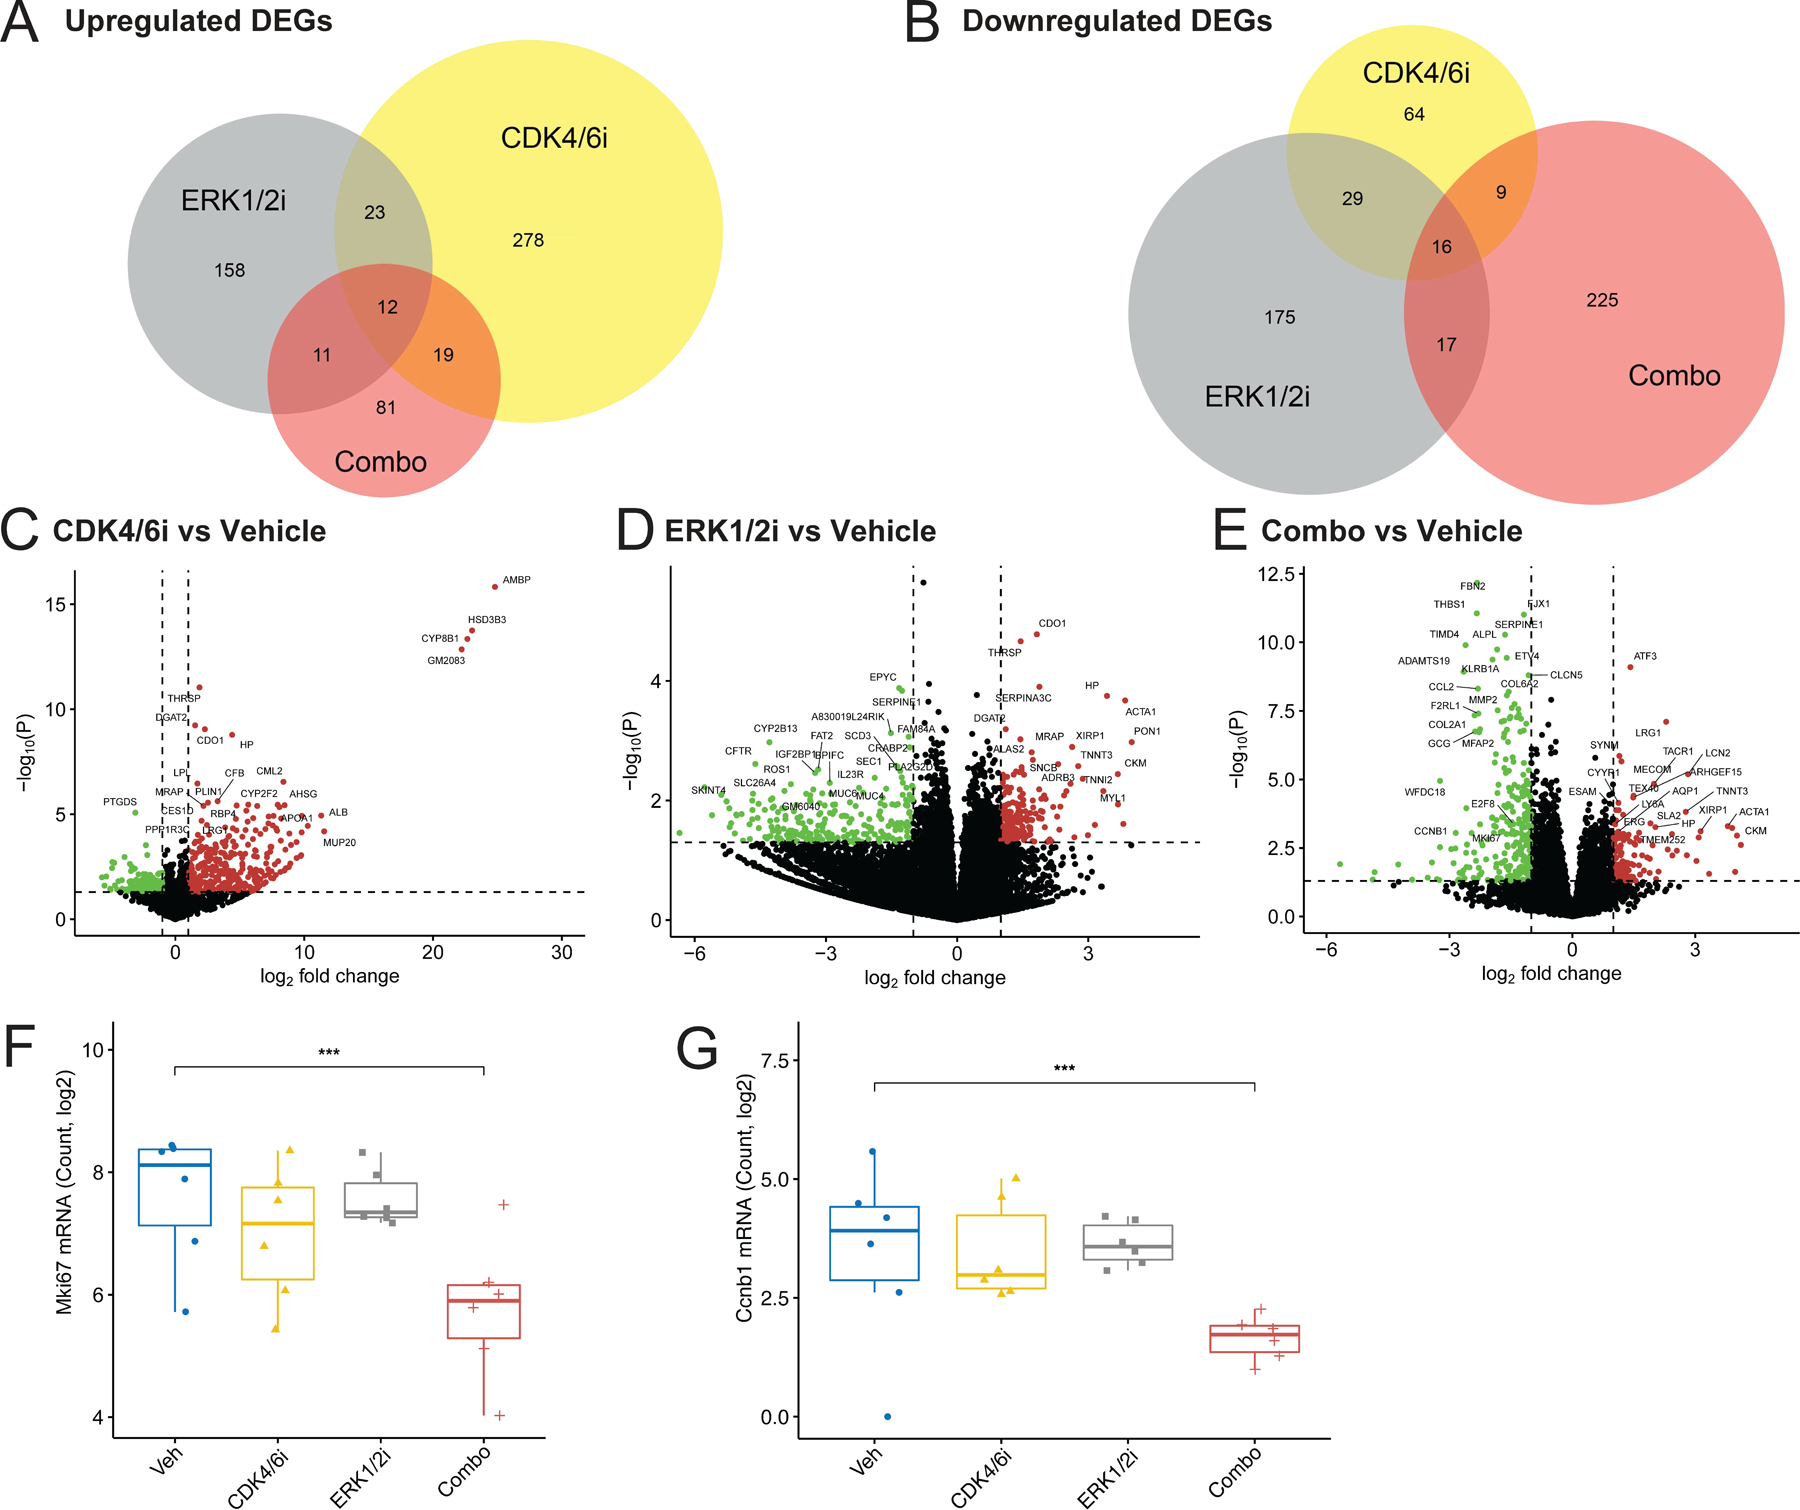
Experimental design: Utilizing RNA sequencing combined with chemical proteomic profiling of the functionally enriched kinome using multiplexed inhibitor beads coupled with mass spectrometry, we identified molecular signatures predictive of response to CDK4/6 and RAS/MAPK pathway inhibition in PNF. Informed by these results, we evaluated the efficacy of the CDK4/6 inhibitor, abemaciclib, and the ERK1/2 inhibitor, LY3214996, alone and in combination in reducing PNF tumor burden in Nf1flox/flox;PostnCre mice.

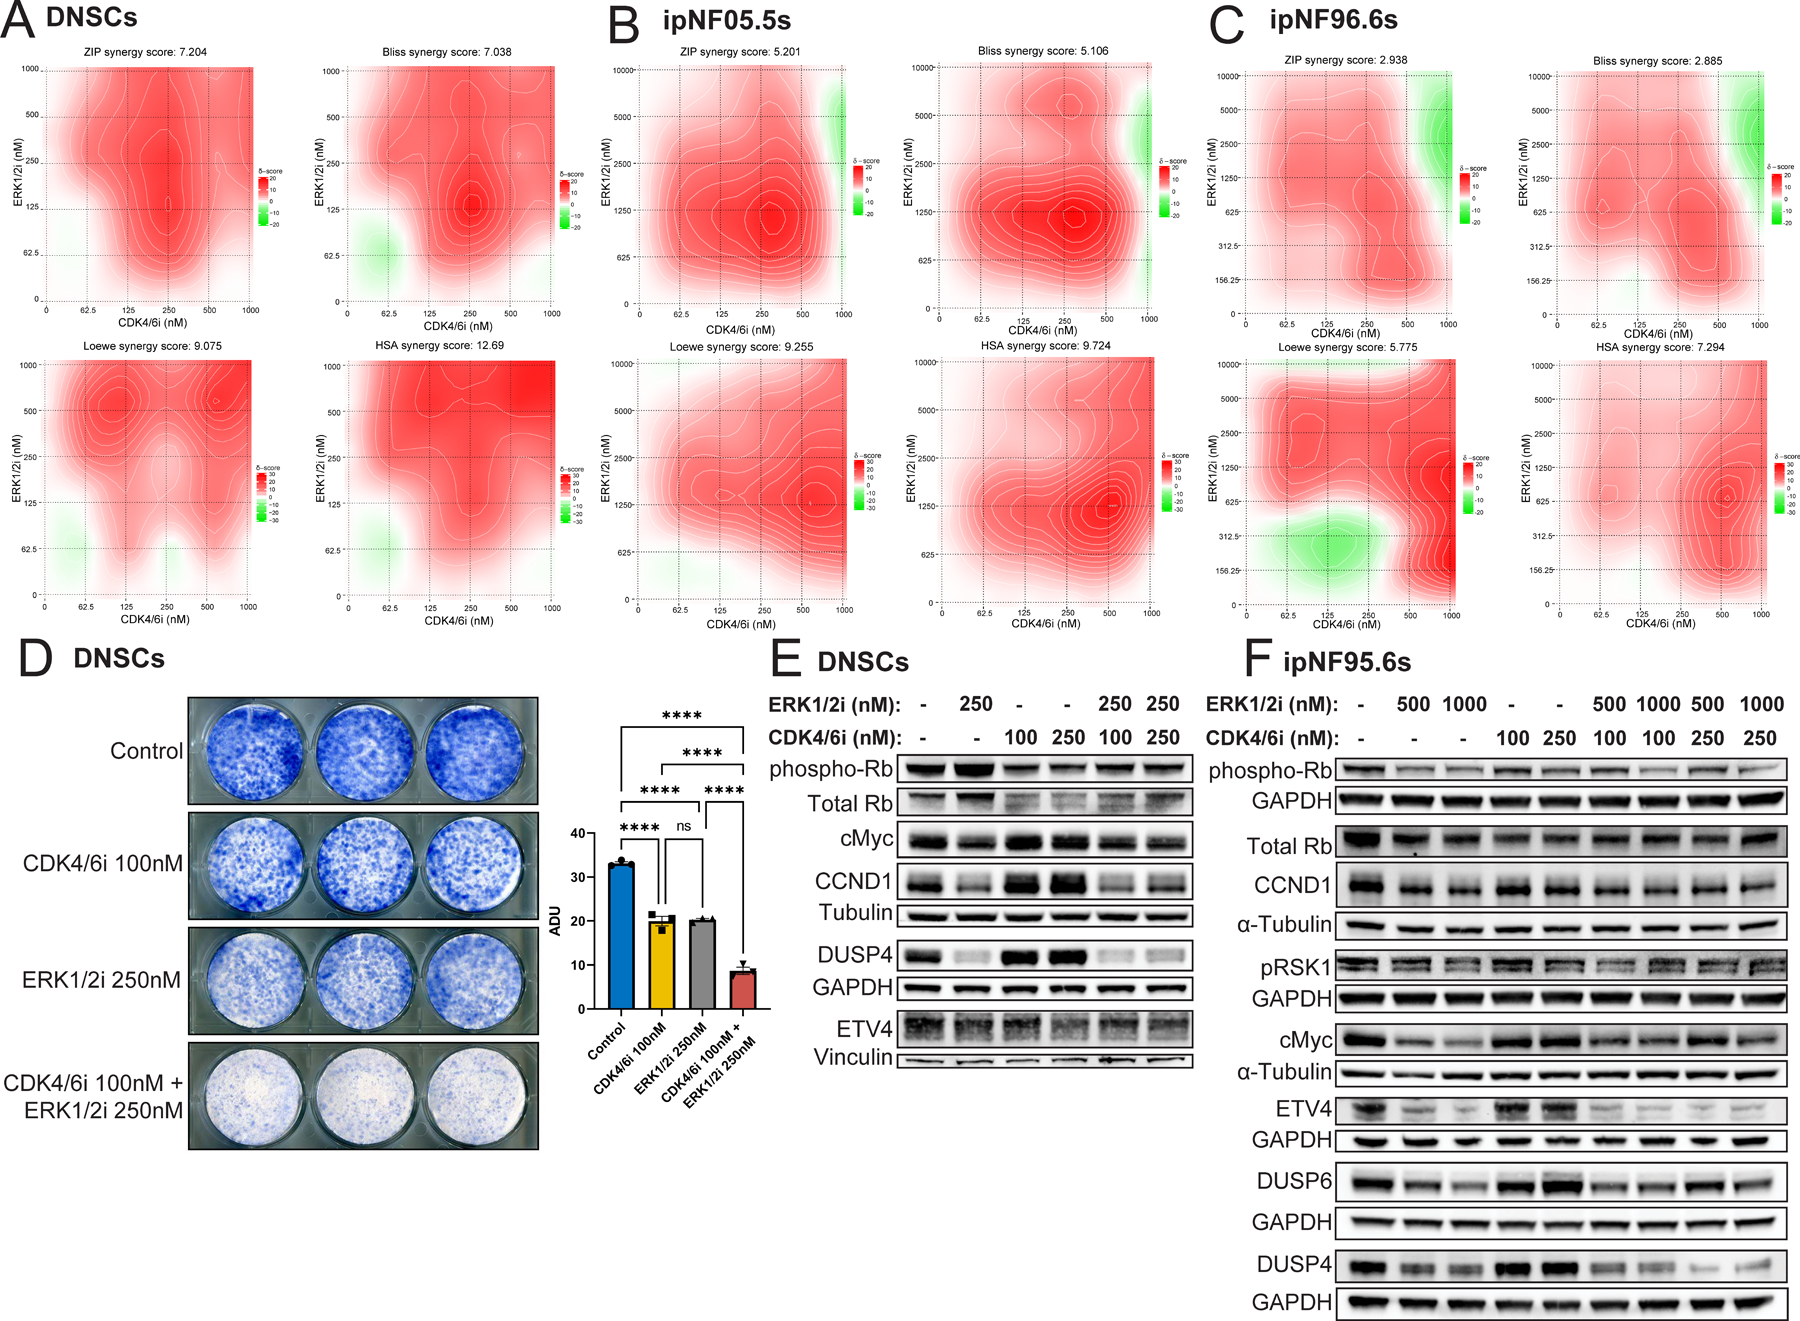
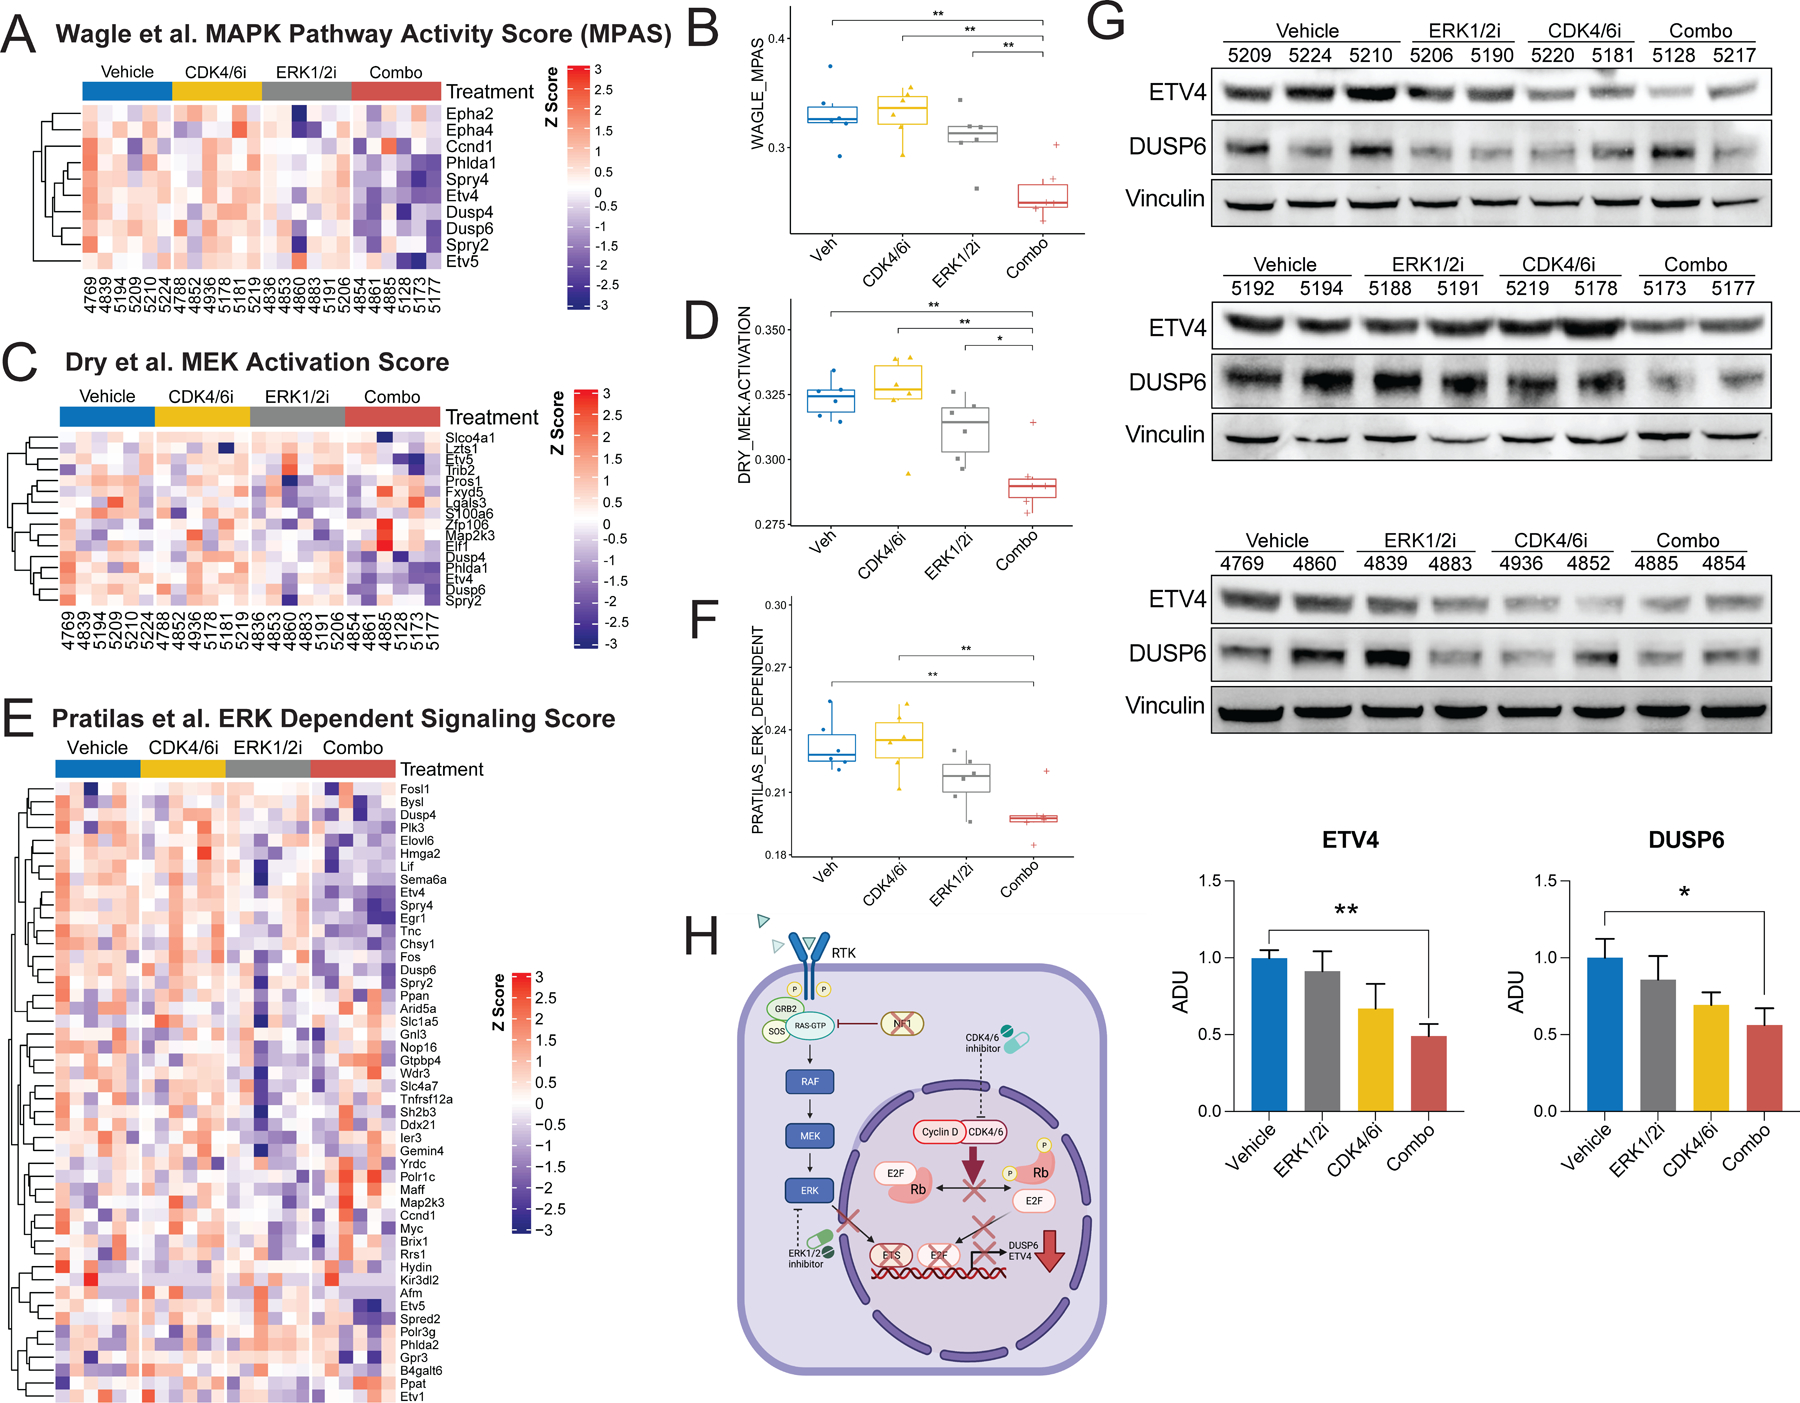
Results: Converging signatures of CDK4/6 and RAS/MAPK pathway activation were identified within the transcriptome and kinome that were conserved in both murine and human PNF. We observed robust additivity of the CDK4/6 inhibitor, abemaciclib, in combination with the ERK1/2 inhibitor, LY3214996, in murine and human NF1(Nf1) mutant Schwann cells. Consistent with these findings, the combination of abemaciclib (CDK4/6i) and LY3214996 (ERK1/2i) synergized to suppress molecular signatures of MAPK activation and exhibited enhanced antitumor activity in Nf1flox/flox;PostnCre mice in vivo.

Conclusions: These findings provide rationale for the clinical translation of CDK4/6 inhibitors alone and in combination with therapies targeting the RAS/MAPK pathway for the treatment of PNF and other peripheral nerve sheath tumors in persons with NF1.


Conflict of interest statement

Conflict of Interest Statement

W. Shen is an employee and stockholder at Loxo@Lilly | Eli Lilly and Company. J. Liu is an employee and stockholder at Loxo@Lilly | Eli Lilly and Company. A. Aggarwal was an employee and stockholder at Loxo@Lilly | Eli Lilly and Company while these studies were conducted. A. Aggarwal is currently an employee and stockholder of Daiichi Sankyo. G.P. Donoho is an employee and stockholder at Loxo@Lilly | Eli Lilly and Company. M.D. Willard is an employee and stockholder at Loxo@Lilly | Eli Lilly and Company. S.V. Bhagwat was an employee and stockholder at Loxo@Lilly | Eli Lilly and Company while these studies were conducted and has an ownership interest (including patents) in Eli Lilly and Company.

Abemaciclib and LY3214996 were provided by Loxo@Lilly | Eli Lilly and Company.

Figures

Figure 1.
Figure 1.. Transcriptional signatures of murine PNF.
(A) Volcano plot depicting whole-transcriptome differentially expressed genes (DEGs) by RNAseq between PNF bearing trigeminal nerve tissue from Nf1flox/flox;PostnCre mice (Plexiform; n=6) vs wild-type (WT) control (Normal; n=6). The dashed horizontal line denotes a false discovery rate (FDR) of 0.05. The dashed vertical lines denote log2 fold-changes of −1 and 1. 510 upregulated genes with log2 fold-change of ≥ 1 and a -log10 adjusted p-value above the FDR threshold are denoted in red. 140 downregulated genes with log2 fold-change ≤ −1 and a -log10 adjusted p-value above the FDR threshold are denoted in green. (B) Hallmark gene signatures significantly up- or downregulated by overrepresentation analysis (ORA) of RNAseq data in PNF bearing trigeminal nerve tissue from Nf1flox/flox;PostnCre mice (Plexiform; n=6) vs WT control (Normal; n=6) (FDR ≤ 0.05). (C) Enrichment plot showing significantly upregulated Hallmark KRAS-signaling transcripts by Gene Set Enrichment Analysis (GSEA) in PNF bearing trigeminal nerve tissue from Nf1flox/flox;PostnCre mice (n=6) vs WT control (n=6). P-adj = 0.0039. (D) Enrichment plot showing significant upregulation of a MEK/ERK dependent gene signature described in Pratilas et al. PNAS, 2009 in PNF bearing trigeminal nerve tissue from Nf1flox/flox;PostnCre mice (n=6) vs WT control (n=6). P-adj = 0.0013. (E) Enrichment plot depicting significant upregulation of Reactome G1 phase signature genes by GSEA in PNF bearing trigeminal nerve tissue from Nf1flox/flox;PostnCre mice (n=6) vs WT control (n=6). P-adj =0.0316. (F) Hierarchically-clustered heatmap of cell cycle signature genes in WT trigeminal nerve tissue (Normal nerve; n=6) and PNF bearing trigeminal nerve tissue from Nf1flox/flox;PostnCre mice (Plexiform; n=6). 1-Pearson correlation was used to obtain a distance matrix with complete clustering. Gene expression values (rows) were Z-score normalized. (G) Hierarchically-clustered heatmap of ETS signature genes in WT trigeminal nerve tissue (Normal nerve; n=6) and PNF bearing trigeminal nerve tissue from Nf1flox/flox;PostnCre mice (Plexiform; n=6). 1-Pearson correlation was used to obtain a distance matrix with complete clustering. Gene expression values (rows) were Z-score normalized. (H) Representative photomicrographs of immunohistochemical (IHC) staining of SPI1 in WT (Normal) and PNF nerve tissue (Plexiform) sections from Nf1flox/flox;PostnCre mice. Corresponding 100μm scale bars denote the magnification with inset high-power magnification showing nuclear localization. Bar graph shows the percentage of SPI1 positive cells quantified by the HALO Cytonuclear analysis algorithm (Indica Labs). n=5 Normal and n=5 Plexiform samples were analyzed with n=49 and n=32 fields respectively. Error bars reflect standard error of the mean (SEM). Asterisks indicate statistical significance according to an unpaired, two-sided t-test (**** = P ≤ 0.0001). (I) Representative photomicrographs of ETV4 IHC-stained sections of normal nerve (Normal) from unaffected controls and PNF from human NF1 patients (Plexiform). Corresponding 100μm scale bars denote the magnification with inset high-power magnification showing nuclear localization. Bar graph shows the percentage of ETV4 positive cells quantified by the HALO Cytonuclear analysis algorithm (Indica Labs). n=6 Normal and n=6 Plexiform samples were analyzed with n=13 and n=24 fields respectively. Error bars reflect standard error of the mean (SEM). Asterisks indicate statistical significance according to an unpaired, two-sided t-test (**** = P ≤ 0.0001).
Figure 2.
Figure 2.. Kinome profiling of murine PNF reveals increased CDK4/6 signaling.
(A) Principal component analysis (PCA) identifies variation in the functional kinome of PNF bearing sciatic nerve tissue from Nf1flox/flox;PostnCre mice (Plexiform; n=4) vs WT control (Normal; n=3). (B) Volcano plot showing the mean log2 fold-change in MIB binding (LFQ intensity) for kinases in PNF bearing sciatic nerve tissue from Nf1flox/flox;PostnCre mice (Plexiform; n=4) vs WT control (Normal; n=3) plotted against the -log10 Benjamini-Hochberg adjusted p-value. The horizontal dashed line denotes a false discovery rate (FDR) of 0.05. Kinases with significantly increased MIB binding (log2 fold-change ≥1 and -log10 adjusted p-value above the FDR threshold) are denoted in red. Kinases with significantly decreased MIB binding (log2 fold-change ≤ −1 and -log10 adjusted p-value above the FDR threshold) are denoted in green. Several of the top kinases with significantly increased or decreased binding in tumor tissue relative to the control are annotated on the plot. (C) Box and whisker plots demonstrating the mean log2 fold-change in MIB binding (LFQ intensity) of the top 20 kinases with increased binding in PNF bearing sciatic nerve tissue from Nf1flox/flox;PostnCre mice (Plexiform; n=4) vs WT control (Normal; n=3). The box color indicates the family to which each kinase belongs as depicted in the legend. (D) “Tree” plot comparing the functionally enriched kinome of PNF bearing sciatic nerve tissue from Nf1flox/flox;PostnCre mice (Plexiform; n=4) vs WT control (Normal; n=3). The log2 fold change in MIB binding is encoded by node color with red denoting kinases that are increased in abundance and blue denoting kinases that are decreased in abundance. The size of each node is proportional to the –log10 Benjamini-Hochberg adjusted p-value as denoted in the figure legend. Kinases with significantly increased or decreased MIB binding in PNF relative to the WT control are annotated alongside their respective kinase families in bold font. (E) Scatter plot showing log2 fold-change in gene expression of kinases (by RNAseq) vs log2 fold-change MIB binding (LFQ intensity) for PNF bearing nerve tissue in Nf1flox/flox;PostnCre mice (Plexiform; n=4 for MIB binding, n=6 for RNAseq) vs WT control nerve tissue (Normal; n=3 for MIB binding, n=6 for RNAseq). Top kinases with increase in MIB binding and RNAseq expression are highlighted in red and labeled. (F) CDK6, CDK4, and GAPDH (loading control) were detected independently by western blot in PNF bearing nerve tissue from Nf1flox/flox;PostnCre mice (Plexiform; n=2) and WT control nerve tissue (Normal; n=2). Bar graph shows arbitrary densitometry units (ADUs) calculated using KwikQuant Image Analyzer for each band normalized to the loading control. Error bars reflect standard error of the mean (SEM). Asterisks indicate statistical significance according to an unpaired, one-sided t-test (* = P ≤ 0.05). (G) Representative photomicrographs of CDK6 immunohistochemistry-stained sections of normal nerve and human NF1-associated PNF. Corresponding 100μm scale bars denote the magnification with inset high-power magnification showing cellular localization. Bar graph shows the percentage of CDK6 positive cells quantified by the HALO Cytonuclear analysis algorithm (Indica Labs). n=11 Normal and n=6 Plexiform samples were analyzed with n=11 and n=24 fields respectively. Error bars reflect standard error of the mean (SEM). Asterisks indicate statistical significance according to an unpaired, two-sided t-test (**** = P ≤ 0.0001). (H) Representative photomicrographs of CDK4 IHC stained sections of normal nerve and human NF1-associated PNF. Corresponding 100μm scale bars denote the magnification with inset high-power magnification showing cellular localization. Bar graph shows the percentage of CDK4 positive cells quantified by manual counting. n=8 Normal and n=6 Plexiform samples were analyzed with n=24 and n=36 fields respectively. Error bars reflect standard error of the mean (SEM). Asterisks indicate statistical significance according to an unpaired, two-sided t-test (** = P ≤ 0.01) (I) Representative photomicrographs of phospho-Rb (S807/811) IHC stained sections of normal nerve and human NF1-associated PNF. Corresponding 100μm scale bars denote the magnification with inset high-power magnification showing nuclear localization. Bar graph shows percentage of phospho-Rb (S807/811) positive nuclei quantified by the HALO Cytonuclear analysis algorithm (Indica Labs). n=14 Normal and n=5 Plexiform samples were analyzed with n=14 and n=30 fields respectively. Error bars reflect standard error of the mean (SEM). Asterisks indicate statistical significance according to an unpaired, two-sided t-test (**** = P ≤ 0.0001).
Figure 3.
Figure 3.. Additive inhibitory activity of abemaciclib (CDK4/6i) and LY3214996 (ERK1/2i) in primary murine Nf1−/− dorsal root ganglia (DRG) neurosphere cells (DNSCs) and human immortalized NF1−/− Schwann cells (ipNF05.5 and ipNF95.6) in vitro.
(A) Primary murine Nf1−/− dorsal root ganglia (DRG) neurosphere cell (DNSC) viability was evaluated at 48 hours by CellTiter-Glo® following exposure to escalating concentrations of LY3214996 and abemaciclib in a 2D dose response matrix. Data represent the mean of 2 replicates for each condition. Percent viability was calculated as drug condition Relative Light Units (RLU) divided by average vehicle RLU * 100. Synergy graphs and ZIP, Bliss, Loewe, and HSA synergy scores were computed using SynergyFinder. The experiment was repeated three times independently with similar results. (B) Human immortalized NF1−/− Schwann cell (ipNF05.5) viability was evaluated at 48 hours using CellTiter-Glo® following exposure to escalating concentrations of LY3214996 and abemaciclib in a 2D dose response matrix. Data represent the mean of 2 replicates for each condition. Percent viability was calculated as drug condition RLU divided by average vehicle RLU * 100. Synergy graphs and ZIP, Bliss, Loewe, and HSA synergy scores were computed using SynergyFinder. The experiment was repeated three times independently with similar results. (C) Human immortalized NF1−/− Schwann cell (ipNF95.6) viability was evaluated at 48 hours using CellTiter-Glo® following exposure to escalating concentrations of LY3214996 and abemaciclib in a 2D dose matrix. Percent viability was calculated as drug condition RLU divided by average vehicle RLU * 100. Synergy graphs and ZIP, Bliss, Loewe, and HSA synergy scores were computed using SynergyFinder. The experiment was repeated three times independently with similar results. (D) Colony formation assays were conducted in primary murine Nf1−/− DNSCs in the presence of DMSO, 250nM LY3214996, 100nM abemaciclib, and the combination. Colonies were stained with methylene blue after 7 days. Bar graph shows quantification of colony formation in arbitrary densitometry units (ADUs) measured in ImageJ for each well. Error bars reflect standard error of the mean (SEM). Asterisks indicate statistical significance for the comparison according to Tukey’s multiple comparisons tests (**** = P ≤ 0.0001).(E) Phospho-Rb (S807/811), total Rb, cMyc, CCND1, DUSP4, ETV4, Tubulin (loading control), Vinculin (loading control), and GAPDH (loading control) were detected by western blot in primary murine Nf1−/− DNSCs treated with DMSO, 250nM LY3214996, 100nM or 250nM abemaciclib, or a combination for 24 hours. The experiment was repeated twice with similar results. (F) Phospho-Rb (S807/811), total Rb, pRSK1, cMyc, CCND1, DUSP4, DUSP6, ETV4, α-Tubulin (loading control), Vinculin (loading control), and GAPDH (loading control) were detected by western blot in human immortalized NF1−/− Schwann cell (ipNF95.6) treated with DMSO, 500nM or 1µM LY3214996, 100nM or 250nM abemaciclib, or a combination for 24 hours. The experiment was repeated twice with similar results.
Figure 4.
Figure 4.. In vivo pharmacodynamic and anti-tumor activity of abemaciclib (CDK4/6i) and LY3214996 (ERK1/2i) single agent and combination therapy in plexiform neurofibroma bearing Nf1flox/flox;PostnCre mice.
(A) Representative photomicrographs of phospho-Rb (S807/811) IHC staining of nerve tissue sections from Nf1flox/flox;PostnCre mice treated with vehicle, abemaciclib, LY3214996, and combination (Combo). Corresponding 100μm scale bars denote the magnification with inset high-power magnification showing nuclear localization. Bar graph shows the percentage of phospho-Rb (S807/811) positive cells quantified by the HALO Cytonuclear analysis algorithm (Indica Labs). n=6 Vehicle, n=5 abemaciclib, n=6 LY3214996, and n=6 combination (Combo) samples were analyzed with n=41, n=43, n=49, and n=47 fields respectively. Error bars reflect standard error of the mean (SEM). Asterisks indicate statistical significance according to Tukey’s multiple comparisons tests (**** = P ≤ 0.0001). (B) Representative images of immunofluorescent staining for phospho-Rb (S780) (Red) in nerve tissue sections from Nf1flox/flox;PostnCre mice treated with vehicle, abemaciclib, LY3214996 and combination (Combo). Colocalization channel (Green) generated with ImarisColoc demonstrates the degree of colocalization between DAPI (Blue) and phospho-Rb (S780) (Red). Bar graphs show quantification of the intensity sum of phospho-Rb (S780) (left) and colocalization channel (right) obtained from colocalization surfaces generated using ImarisSurfaces. Vehicle: n= 6, fields=11, surfaces= 511; abemaciclib: n= 5, fields= 9, surfaces= 227; LY3214996: n= 4, fields= 6, surfaces= 419; and Combo: n= 4, fields=7, surfaces=556. Asterisks indicate statistical significance according to Tukey’s multiple comparisons tests (**** = P ≤ 0.0001) and error bars reflect standard error of the mean (SEM). Corresponding 20 μm scale bars denote the magnification. (C) Representative western blot showing phospho-RSK1 (pRSK1) (S380) and Vinculin (loading control) expression in PNF bearing trigeminal nerve tissue from Nf1flox/flox;PostnCre mice treated with vehicle (n=7), abemaciclib (n=6), LY3214996 (n=6), or the combination (n=7) for 7 days. Bar graph showing quantification of arbitrary densitometry units (ADUs) obtained with ImageJ and normalized to loading control. Data reflects analysis of samples pooled from three independent experiments with additional blots shown in Supplemental Figure S10C. Asterisks indicate statistical significance for the comparison according to an unpaired, two-sided t-test with Welch’s correction (* = P ≤ 0.05) and error bars reflect standard error of the mean (SEM). (D) Proximal nerve root volume (mm3) was measured in mice treated with vehicle vs LY3214996 or abemaciclib monotherapy, vs the combination (Combo) for 12 weeks. The number of proximal spinal nerve roots evaluated per treatment group were as follows: vehicle (n=48), LY3214996 (n=36), abemaciclib (n=44), and the combination (n=24). Whiskers extend from the minima to maxima. The center line represents the median. The box spans the 25th to 75th percentiles. Outliers were identified by Grubbs test (alpha = 0.05) and excluded (vehicle, n=1 excluded). Asterisks indicate statistical significance of treatment vs vehicle according to an unpaired, two-sided t-test (* = P ≤ 0.05). (E) Microdissected nerve tissues were examined for histopathological evidence of plexiform neurofibroma. The mean number of plexiform neurofibroma tumors per mouse in each treatment group is shown in the plot. The number of independent animals evaluated per treatment group are as follows: vehicle (n=11 mice), LY3214996 (n=9), abemaciclib (n=11), and the combination (n=6). Whiskers extend from the minima to maxima. The center line represents the median. The box spans the 25th to 75th percentiles. Asterisks indicate statistical significance of treatment vs vehicle according to an unpaired, two-sided t-test (* = P ≤ 0.05, ** = P ≤ 0.01, *** = P ≤ 0.001). (F) Representative photomicrographs of H&E-stained sections of Nf1flox/flox;PostnCre mice tumor nerve tissue in each group after 12 weeks of vehicle, LY3214996, abemaciclib, or combination (Combo) treatment. Corresponding 200μm scale bars denote the magnification with inset high-power magnification highlighting tissue architecture.
Figure 5.
Figure 5.. Transcriptional responses to single agent and combined CDK4/6 and ERK1/2 inhibition in murine PNF in vivo
(A) Venn diagram depicting numbers of significantly upregulated differentially expressed genes (DEGs) common between abemaciclib (CDK4/6i), LY3214996 (ERK1/2i), and the combination (Combo) treatment groups compared to the vehicle (Veh) control. The thresholds for the DEGs were defined as log2 fold change ≥ 1 and p-value ≤ 0.05. (B) Venn diagram depicting numbers of significantly downregulated differentially expressed genes (DEGs) common between the abemaciclib, LY3214996, and combination (Combo) treatment groups compared to the vehicle (Veh) control. The thresholds for the DEGs were defined as log2 fold change ≤ −1 and p-value ≤ 0.05. (C) Volcano plot showing log2 fold-change in gene expression for PNF from Nf1flox/flox;PostnCre mice treated with abemaciclib (n=6) vs Vehicle (n=6) plotted against the -log10 p-value (-log10(P)). The dashed horizontal line denotes -log10(P=0.05). The dashed vertical lines denote log2 fold-changes of −1 and 1. Significantly upregulated genes above these thresholds are denoted in red, while significantly downregulated genes are denoted in green. (D) Volcano plot showing log2 fold-change in gene expression for PNF from Nf1flox/flox;PostnCre mice treated with LY3214996 (n=6) vs Vehicle (n=6) plotted against the -log10 p-value (-log10(P)). The dashed horizontal line denotes -log10(P=0.05). The dashed vertical lines denote log2 fold-changes of −1 and 1. Significantly upregulated genes above these thresholds are denoted in red, while significantly downregulated genes are denoted in green. (E) Volcano plot showing log2 fold-change in gene expression for PNF from Nf1flox/flox;PostnCre mice treated with LY3214996 plus abemaciclib combination (n=6) vs Vehicle (n=6) plotted against the -log10 p-value (-log10(P)). The dashed horizontal line denotes -log10(P=0.05). The dashed vertical lines denote log2 fold-changes of −1 and 1. Significantly upregulated genes above these thresholds are denoted in red, while significantly downregulated genes are denoted in green. (F) Box and whisker plots showing Mki67 mRNA log2 counts in PNF from Nf1flox/flox;PostnCre mice treated with vehicle (n=6), abemaciclib (n=6), LY3214996 (n=6), and combination therapy (Combo; n=6). Whiskers extend from the minima to maxima. The center line represents the median. The box spans the 25th to 75th percentiles. Asterisks indicate statistical significance of treatment vs vehicle according to the Wald test performed by DESeq2 (*** = P ≤ 0.001). Non-significant comparisons are not shown. (G) Box and whisker plots showing Ccnb1 mRNA log2 counts in PNF from Nf1flox/flox;PostnCre mice treated with vehicle (n=6), abemaciclib (n=6), LY3214996 (n=6), and combination therapy (n=6). Whiskers extend from the minima to maxima. The center line represents the median. The box spans the 25th to 75th percentiles. Asterisks indicate statistical significance of treatment vs vehicle according to the Wald test performed by DESeq2 (*** = P ≤ 0.001). Non-significant comparisons are not shown.
Figure 6.
Figure 6.. LY3214996 (ERK1/2i) and abemaciclib (CDK4/6i) synergize to repress MAPK-dependent activation of ETV4 and DUSP6 in PNF in vivo.
(A) Hierarchically-clustered heatmap of MAPK Pathway Activity Score (MPAS) signature genes, curated by Wagle et al., in PNF from Nf1flox/flox;PostnCre mice treated with vehicle (n=6), abemaciclib (n=6), LY3214996 (n=6), or combination therapy (Combo; n=6). 1-Pearson correlation was used to obtain a distance matrix with complete clustering. Gene expression values (rows) were Z-score normalized. (B) Box and whisker plots showing the Wagle et al. MAPK Pathway Activity Score (MPAS) in PNF from Nf1flox/flox;PostnCre mice treated with vehicle (n=6), abemaciclib (n=6), LY3214996 (n=6), or combination therapy (Combo; n=6). Whiskers extend from the minima to maxima. The center line represents the median. The box spans the 25th to 75th percentiles. Asterisks indicate statistical significance according to the Wilcoxon test (** = P ≤ 0.01). Non-significant comparisons are not shown. (C) Hierarchically-clustered heatmap of MEK activation score signature genes, curated by Dry et al., in PNF from Nf1flox/flox;PostnCre mice treated with vehicle (n=6), abemacicilb (n=6), LY3214996 (n=6), or combination therapy (Combo; n=6). 1-Pearson correlation was used to obtain a distance matrix with complete clustering. Gene expression values (rows) were Z-score normalized. (D) Box and whisker plots showing the Dry et al. MEK activation score in PNF from Nf1flox/flox;PostnCre mice treated with vehicle (n=6), abemaciclib (n=6), LY3214996 (n=6), or combination therapy (n=6). Whiskers extend from the minima to maxima. The center line represents the median. The box spans the 25th to 75th percentiles. Asterisks indicate statistical significance according to the Wilcoxon test (* = P ≤ 0.05; ** = P ≤ 0.01). Non-significant comparisons are not shown. (E) Hierarchically-clustered heatmap of ERK dependent signature genes, curated by Pratilas et al., in PNF from Nf1flox/flox;PostnCre mice treated with vehicle (n=6), abemacicilb (n=6), LY3214996 (n=6), or combination therapy (n=6). 1-Pearson correlation was used to obtain a distance matrix with complete clustering. Gene expression values (rows) were Z-score normalized. (F) Box and whisker plots showing the Pratilas et al. ERK dependent signature score in PNF from Nf1flox/flox;PostnCre mice treated with vehicle (n=6), abemaciclib (n=6), LY3214996 (n=6), or combination therapy (n=6). Whiskers extend from the minima to maxima. The center line represents the median. The box spans the 25th to 75th percentiles. Asterisks indicate statistical significance according to the Wilcoxon test (** = P ≤ 0.01). Non-significant comparisons are not shown. (G) ETV4, DUSP6, and Vinculin (loading control) were detected by Western blot in PNF bearing trigeminal nerve tissue from Nf1flox/flox;PostnCre mice treated with vehicle (n=7), abemaciclib (n=6), LY3214996 (n=6), or the combination (n=6) for 7 days. Bar graphs show quantification of arbitrary densitometry units (ADUs) calculated using ImageJ and normalized to loading control and average of vehicle. Analysis includes data generated from two independent animal experiments with western blots performed in triplicate. An additional blot shown in Supplemental Figure S10D demonstrates ETV4 and DUSP6 expression in the sciatic nerve of animals represented in Figure 6G. Asterisks indicate statistical significance for the comparisons according to Dunnett’s multiple comparisons test (* = P ≤ 0.05; ** = P ≤ 0.01) and error bars reflect standard error of the mean (SEM). (H) Schematic depicting molecular synergism of combined ERK1/2 and CDK4/6 pathway inhibition to reduce RAS/MAPK dependent DUSP6 and ETV4 transcriptional output in PNF.

References

    1. Friedman JM. Epidemiology of neurofibromatosis type 1. Am J Med Genet 1999;89(1):1–6. - PubMed
    1. Ballester R, Marchuk D, Boguski M, Saulino A, Letcher R, Wigler M, et al. The NF1 locus encodes a protein functionally related to mammalian GAP and yeast IRA proteins. Cell 1990;63(4):851–9 doi 10.1016/0092-8674(90)90151-4. - DOI - PubMed
    1. Viskochil D, Buchberg AM, Xu G, Cawthon RM, Stevens J, Wolff RK, et al. Deletions and a translocation interrupt a cloned gene at the neurofibromatosis type 1 locus. Cell 1990;62(1):187–92 doi 10.1016/0092-8674(90)90252-a. - DOI - PubMed
    1. Wallace MR, Marchuk DA, Andersen LB, Letcher R, Odeh HM, Saulino AM, et al. Type 1 neurofibromatosis gene: identification of a large transcript disrupted in three NF1 patients. Science 1990;249(4965):181–6 doi 10.1126/science.2134734. - DOI - PubMed
    1. Ferner RE, Gutmann DH. Neurofibromatosis type 1 (NF1): diagnosis and management. Handb Clin Neurol 2013;115:939–55 doi 10.1016/B978-0-444-52902-2.00053-9. - DOI - PubMed

Publication types

MeSH terms