. 2023 Jul 11;120(28):e2220276120.
doi: 10.1073/pnas.2220276120. Epub 2023 Jul 5.

EMT activates exocytotic Rabs to coordinate invasion and immunosuppression in lung cancer

Affiliations

EMT activates exocytotic Rabs to coordinate invasion and immunosuppression in lung cancer

Guan-Yu Xiao et al. Proc Natl Acad Sci U S A. .

Abstract

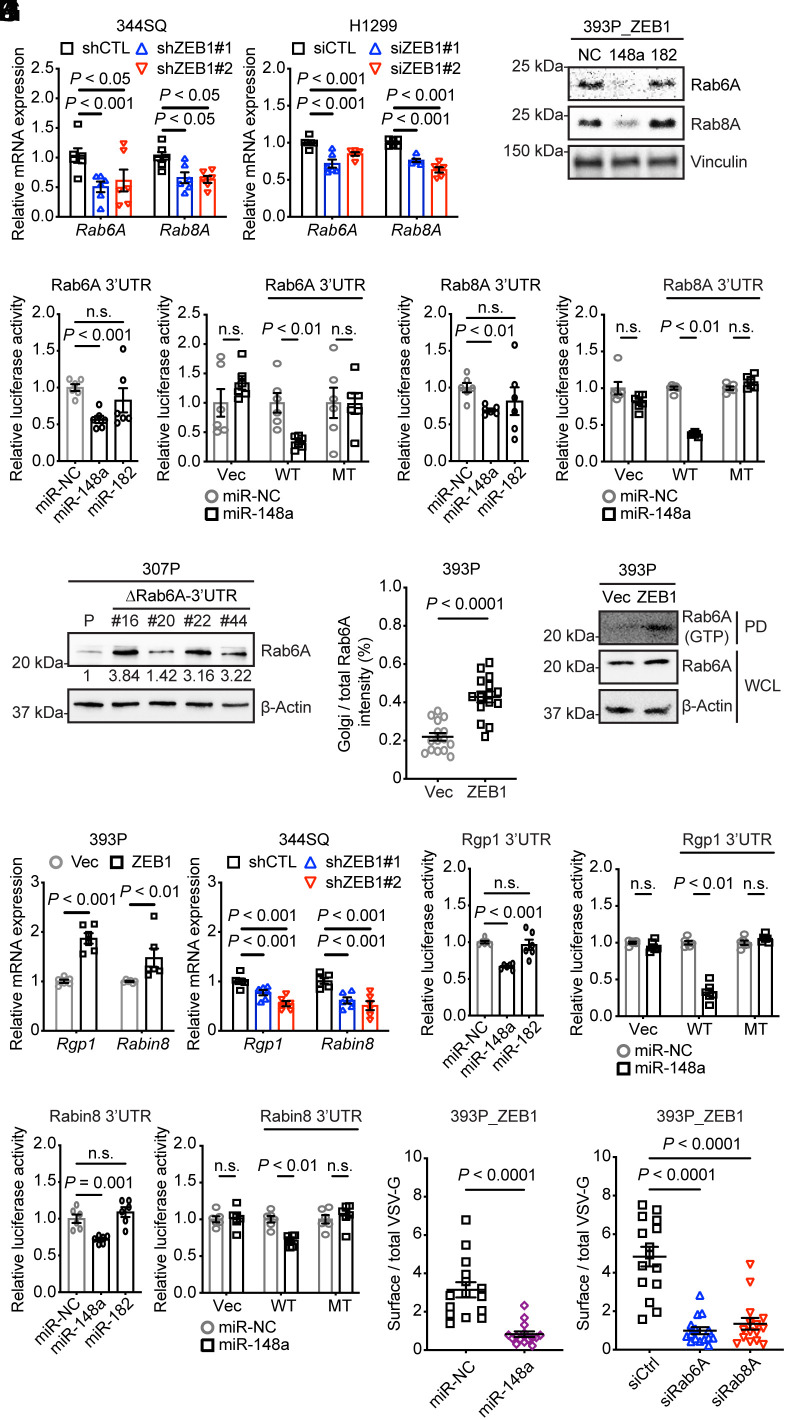
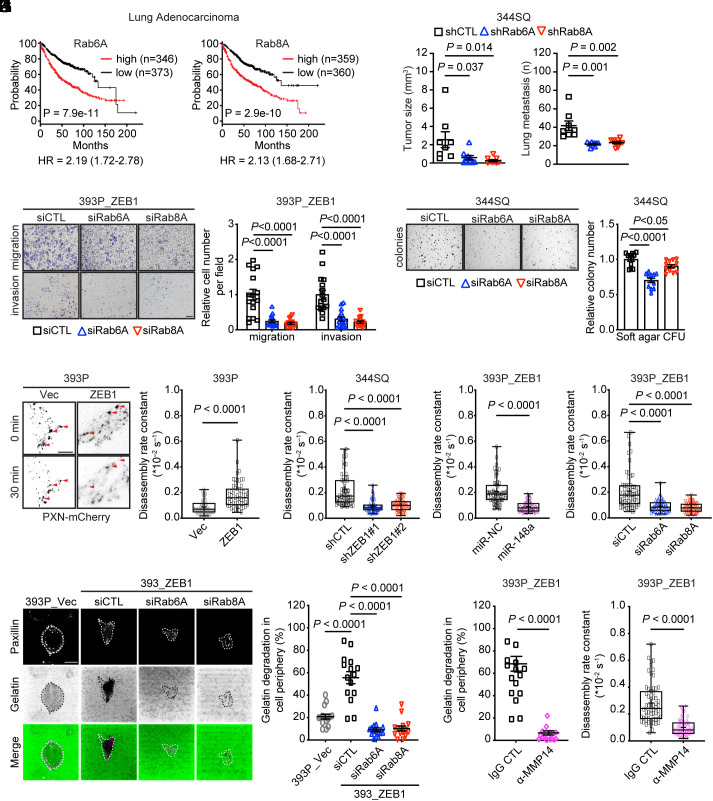
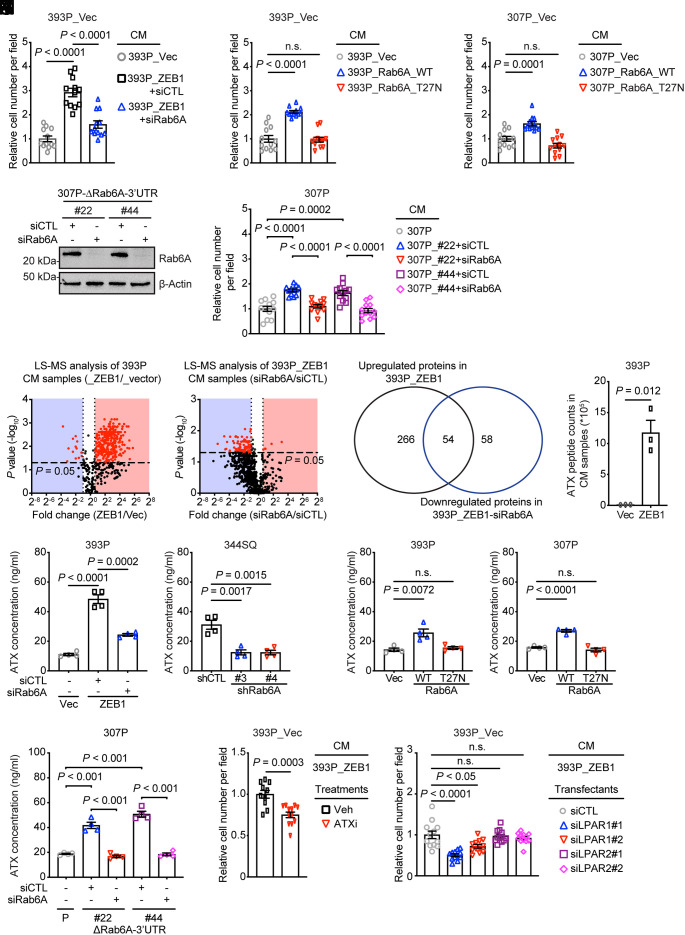
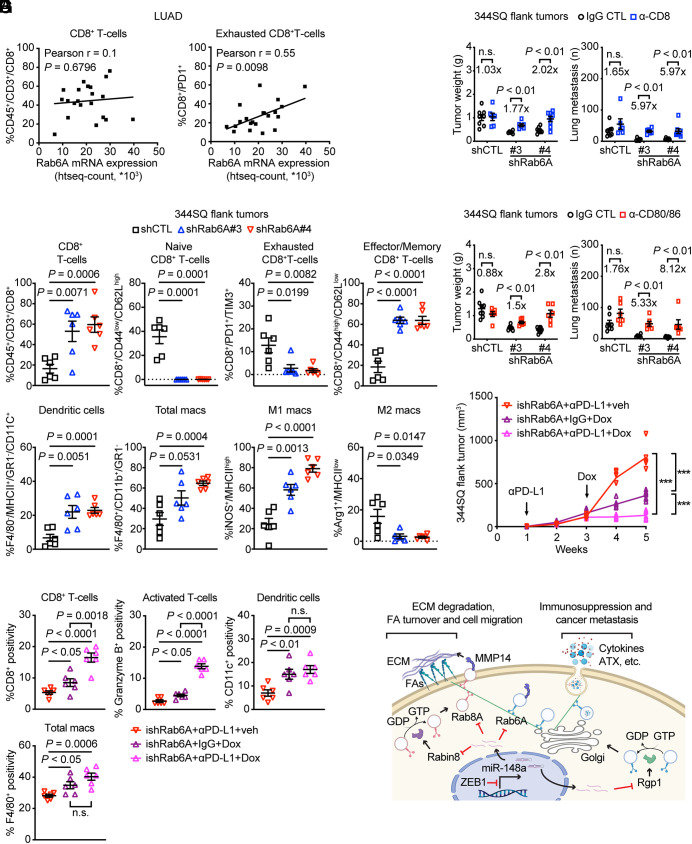
Epithelial-to-mesenchymal transition (EMT) underlies immunosuppression, drug resistance, and metastasis in epithelial malignancies. However, the way in which EMT orchestrates disparate biological processes remains unclear. Here, we identify an EMT-activated vesicular trafficking network that coordinates promigratory focal adhesion dynamics with an immunosuppressive secretory program in lung adenocarcinoma (LUAD). The EMT-activating transcription factor ZEB1 drives exocytotic vesicular trafficking by relieving Rab6A, Rab8A, and guanine nucleotide exchange factors from miR-148a-dependent silencing, thereby facilitating MMP14-dependent focal adhesion turnover in LUAD cells and autotaxin-mediated CD8+ T cell exhaustion, indicating that cell-intrinsic and extrinsic processes are linked through a microRNA that coordinates vesicular trafficking networks. Blockade of ZEB1-dependent secretion reactivates antitumor immunity and negates resistance to PD-L1 immune checkpoint blockade, an important clinical problem in LUAD. Thus, EMT activates exocytotic Rabs to drive a secretory program that promotes invasion and immunosuppression in LUAD.

Keywords: epithelial-mesenchymal transition (EMT); lung cancer; membrane trafficking.


Conflict of interest statement

J.M.K. has received consulting fees from Halozyme.

Figures

Fig. 1.
Fig. 1.
ZEB1 activates exocytotic Rabs by silencing miR-148a. (A) Q-PCR analysis of Rab6A and Rab8A mRNA expression levels in ZEB1 shRNA (shZEB1)- or siRNA (siZEB1)-transfected cells (n = 6 replicates per condition). Control shRNA or siRNA sequences (CTL). (B) WB analysis of Rab6A and Rab8A expressions in cells transfected with miR-148a mimics, miR-182 mimics, or noncoding control (NC). (C and D) Mouse Rab6A (C) and mouse Rab8A (D) 3′-UTR reporter assays. Luciferase activities in 344SQ cells transiently cotransfected with pre-miRs and mouse Rab6A 3′UTR (C) or mouse Rab8A 3′UTR (D) reporters containing wild-type (WT) or mutant 3′-UTRs lacking predicted miR-binding sites (MT). Empty reporters (Vec). Results represent means ± SEM (n = 6 replicates per condition). (E) WB analysis of Rab6A levels in parental 307P cells (P) and mutant 307P cells bearing a deletion in the miR-148a-binding site in the Rab6A 3′-UTR (ΔRab6A-3′-UTR). Mutant clones (#16, #20, #22, #44). P values were determined using two-tailed Student’s t test. (F) The dot plot quantifies Golgi-localized Rab6A per cell (dot) based on % of total Rab6A that colocalizes with Golgi (GM130 channel) (n = 15 cells per group). (G) GTP-bound Rab6A assay. WB analysis of Rab6A associated with BICD2, a Rab6A effector, in BICD2 pull-down samples (PD) or in whole-cell lysates (WCL). (H) Q-PCR analysis of Rgp1 and Rabin8 mRNA levels (n = 6 replicates per condition). (I and J) Mouse Rgp1 (I) and mouse Rabin8 (J) 3′-UTR reporter assays. Luciferase activities in 344SQ cells transiently cotransfected with pre-miRs and mouse Rgp1 3′UTR (I) or mouse Rabin8 3′UTR (J) reporters containing wild-type (WT) or mutant 3′-UTRs lacking predicted miR-binding sites. Empty reporter (Vec). (n = 6 replicates per condition). (K and L) The scatter plots represent the ratio of surface VSV-G to total VSV-G in each cell (dots, n = 15 cells per group) for each condition. P values were determined using two-tailed Student’s t-test.
Fig. 2.
Fig. 2.
Rab6A and Rab8A drive LUAD progression. (A) Kaplan–Meier survival analysis of LUAD patients on the basis of Rab6A and Rab8A mRNA levels above (high) or below (low) the median value. (B) Orthotopic lung tumor size (left dot plot) and numbers of metastases to contralateral lung and mediastinal lymph nodes (right dot plot). Syngeneic, immunocompetent mice were injected with shRNA-transfected 344SQ cells. Control shRNA (shCTL). (C) Bright-field micrographs of crystal violet-stained, siRNA-transfected cells that migrated through Matrigel-coated (invasion) or noncoated (migration) filters in Boyden chambers. (Scale bar, 200 μm.) Replicates (16 fields from four replicates) quantified 16 h after seeding and normalized to siCTL. (D) Colonies formed in soft agarose by siRNA-transfected 344SQ cells were imaged and quantified. (Scale bar, 2 mm.) Replicates (12 fields from four replicates) quantified and normalized to siCTL. (EH) Representative TIRF micrographs of KP cells subjected to ectopic ZEB1 expression (E, Left). Disassembling FAs in the indicated cells detected by paxillin–mCherry (arrowheads). (Scale bars, 10 μm.) FA disassembly rate constants (dot plots) quantified over the entire 60 min time-lapse sequences in the indicated transfectants (EH). Each dot represents a single FA (n = 60 FAs per group). P values were determined using two-tailed Student’s t-test. (I) Confocal micrographs of paxillin-CFP-transfected cells seeded on Oregon Green-488–gelatin and imaged 90 min later. Cells outlined (dotted lines, paxillin channel). The absence of green in the merged channel indicates degraded matrix. (Scale bar, 10 μm.) Gelatin degradation per cell (dot) quantified based on the percentage of cell periphery lacking gelatin (dot plot). (J and K) Gelatin degradation (J) and disassembling FAs (K) in the KP cells treated for 16 h with IgG or anti-MMP14 neutralizing antibody.
Fig. 3.
Fig. 3.
ZEB1 activates a proinvasive autocrine loop. (AC) Quantification of cells that invaded through Matrigel-coated filters in Boyden chambers. Upper chambers loaded with indicated CM samples. Wild-type (WT) or enzymatically dead mutant (T27N) Rab6A. Replicates (12 fields from four replicates) were averaged (bar graph). (D) WB analysis of Rab6A levels in siRNA-transfected 307P cells. CRISPR/Cas-9 mutagenesis carried out to generate a deletion in the miR-148a-binding site in the Rab6A 3′-UTR (ΔRab6A-3′-UTR). (E) Quantification of invasive cells in Matrigel-coated Boyden chambers. Upper chambers contained CM from the indicated cells. Replicates (12 fields from four replicates) were averaged (bar graph). P values were determined using two-tailed Student’s t-test. (F) Volcano plot of proteins identified by LC–MS analysis of CM samples. P values (y axis) and fold-change (x axis). Proteins at significantly different concentrations (red dots, P < 0.05) in 393P_ZEB1 cells and 393P_vector cells (left plot) and in Rab6A-deficient and replete 393P_ZEB1 cells (right plot). (G) Venn diagram illustration of differentially expressed proteins identified in F. (H) ATX peptide counts by LC–MS analysis. (IL) ELISA of ATX concentrations in CM samples (n = 4 replicates per sample) from KP cells subjected to ectopic ZEB1 expression (I), Rab6A depletion (J), ectopic expression of wild-type (WT) or enzyme-dead mutant (T27N) Rab6A (K), or deletion of the miR-148a binding site in the Rab6A 3′-UTR (ΔRab6A-3′UTR) (L). Parental (P) and mutant clones (#22, #44) (L). (M) Quantification of invasive cells in Matrigel-coated Boyden chambers. Upper chambers contained 393P_ZEB1 cell-derived CM and vehicle or ATX inhibitor (ATXi). (N) Quantification of invasive cells in Matrigel-coated Boyden chambers. Cells were transfected with distinct siRNAs (#1 or #2) against LPAR1 or LPAR2. Upper chambers loaded with CM from 393P_ZEB1 cells. P values were determined using two-tailed Student’s t-test.
Fig. 4.
Fig. 4.
A Rab6A-dependent immunosuppressive secretory process. (A) Correlation of Rab6A mRNA levels with percentages of total CD8+ T cells (A, Left) and exhausted CD8+ T cells (A, Right) quantified by flow cytometric analysis in a human LUAD cohort. (B) Flow cytometric analysis of Rab6A-deficient (shRab6A#3 and #4) or replete (shCTL) 344SQ flank tumors isolated from syngeneic, immunocompetent mice (n = 6 tumors per cohort). Percentages of T cells (CD8+ T cells, CD44low/CD62Lhigh naive CD8+ T cells, PD1+/TIM3+ exhausted CD8+ T cells and CD44high/CD62Llow effector/memory CD8+ T cells) and antigen-presenting cells (dendritic cells, total macrophages, M1 macrophages, and M2 macrophages) were quantified. (C and D) Flank tumor weight and lung metastasis numbers in syngeneic, immunocompetent mice (dots) injected with Rab6A-deficient (shRab6A#3 and #4) or replete (shCTL) 344SQ cells and treated with IgG CTL or anti-CD8 (C) or anti-CD80/CD86 antibodies (D). Fold-changes in tumor size and lung metastasis numbers were calculated for each cohort based on the mean values in anti-CD8-, anti-CD80/86, and IgG-treated groups. (E) Subcutaneous tumor growth curves in syngeneic, immunocompetent mice (dots). Cohorts are color-coded. Mean ± SEM. ***P < 0.0005. (F) CD8-, granzyme B-, CD11c-, and F4/80-positive cells in flank tumors generated by injection of 344SQ cells into syngeneic, immunocompetent mice. The percentage of positive cells in each cohort (plot). (G) Schematic illustration of a working model. ZEB1 relieves Rab6A, Rab8A, and their associated GEFs from miR-148a-dependent silencing, thereby accelerating Rab6A- and Rab8A-dependent exocytotic trafficking of vesicles carrying cargos that enhance FA turnover (e.g., MMP14) and establish an immunosuppressive TME (e.g., cytokines and ATX) to promote cancer metastasis.

References

    1. Valkenburg K. C., de Groot A. E., Pienta K. J., Targeting the tumour stroma to improve cancer therapy. Nat. Rev. Clin. Oncol. 15, 366–381 (2018). - PMC - PubMed
    1. Pardoll D. M., The blockade of immune checkpoints in cancer immunotherapy. Nat. Rev. Cancer 12, 252–264 (2012). - PMC - PubMed
    1. Tumeh P. C., et al. , PD-1 blockade induces responses by inhibiting adaptive immune resistance. Nature 515, 568–571 (2014). - PMC - PubMed
    1. Koyama S., et al. , Adaptive resistance to therapeutic PD-1 blockade is associated with upregulation of alternative immune checkpoints. Nat. Commun. 7, 10501 (2016). - PMC - PubMed
    1. Sharma P., Hu-Lieskovan S., Wargo J. A., Ribas A., Primary, adaptive, and acquired resistance to cancer immunotherapy. Cell 168, 707–723 (2017). - PMC - PubMed

Publication types

MeSH terms

Substances