. 2023 Jul 7;9(27):eabq6120.
doi: 10.1126/sciadv.abq6120. Epub 2023 Jul 5.

Physically informed data-driven modeling of active nematics

Affiliations

Physically informed data-driven modeling of active nematics

Matthew Golden et al. Sci Adv. .

Abstract

A continuum description is essential for understanding a variety of collective phenomena in active matter. However, building quantitative continuum models of active matter from first principles can be extremely challenging due to both the gaps in our knowledge and the complicated structure of nonlinear interactions. Here, we use a physically informed data-driven approach to construct a complete mathematical model of an active nematic from experimental data describing kinesin-driven microtubule bundles confined to an oil-water interface. We find that the structure of the model is similar to the Leslie-Ericksen and Beris-Edwards models, but there are appreciable and important differences. Rather unexpectedly, elastic effects are found to play no role in the experiments considered, with the dynamics controlled entirely by the balance between active stresses and friction stresses.


Figures

Fig. 1.
Fig. 1.. Raw experimental images and the extracted fields.
(A) A snapshot of the microtubules. The complete image is shown, with the red box highlighting a small region centered on a −1/2 topological defect. (B) The zoomed-in view of the red box. The extracted director field n (red arrows) does not line up with the orientation of the microtubules in the center of the image, which indicates that director field data are unreliable near topological defects. (C) Director field (black arrows) and the mask ψ (color). (D) The flow field u (black arrows) and the corresponding vorticity ω = −2Ωxy (color). (C) and (D) The vector fields corresponding to (A) on a much coarser grid than that on which the data are available.
Fig. 2.
Fig. 2.. A schematic representation of the SPIDER algorithm.
Tensors Fr are constructed in symbolic form from fields and their derivatives and projected into irreducible representations of the underlying symmetry group, yielding a set of libraries. Weak form of the corresponding (Eq. 1) evaluated using appropriately sampled data yields a coefficient (Eq. 2). Last, a sparse regression algorithm is applied to each coefficient equation to identify one or more empirical relations.
Fig. 3.
Fig. 3.. An iterative regression algorithm for finding a set of sparse solutions for the coefficient (Eq. 2).
An empirical relation balancing sparsity and accuracy is identified using sequential regression of the full library. The largest term in that relation is then removed from the full library, and the procedure is repeated to find additional empirical relations contained in the library. Gn represents the nth column of the matrix G.
Fig. 4.
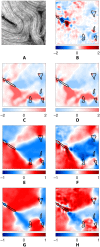
Fig. 4.. The strong form of the identified relations.
Symbolic regression identifies physical relations in weak form. To check the validity of the corresponding PDEs in strong form, we computed each term on the entire spatial domain using finite differences. (A) A cropped snapshot of the microtubules, and all other panels correspond to this snapshot. (B) Divergence ∇iui of the interfacial flow. (C) Observed angular velocity ∂tθ = εijnitnj of the microtubules and (D) its value reconstructed using the vector relation (4). The remaining panels compare the two components of the active and viscous stresses in arbitrary units: the diagonal component σ11a (E) and σ11v (F) and the off-diagonal component σ12a (G) and σ12v (H). The viscous stress shown in (F) and (H) involves spatial derivatives and is therefore much noisier than the active stress shown in (E) and (G). Black solid curves in (B) to (H) correspond to a level set of the number density field ϕ and describe the edges of the regions devoid of microtubules.
Fig. 5.
Fig. 5.. Schematic of the experimental flow cell.
Microtubules (shown in red) are confined between a layer of oil and a layer of water. The flow in the x-z plane for f(x) = g(y) = 0 is shown in blue.
Fig. 6.
Fig. 6.. Microtubule alignment and the accuracy of the identified relations.
(A) Three noticeable out-of-plane microtubule bundles are misaligned with the rest of the microtubules at the bottom left of the image. (B) Divergence of the flow is the largest in the regions of misalignment. (C) The error (residual) of the scalar form (9) of the stress balance is also the largest there.

References

    1. Toner J., Tu Y., Flocks, herds, and schools: A quantitative theory of flocking. Phys. Rev. E 58, 4828–4858 (1998).
    1. Toner J., Tu Y., Ramaswamy S., Hydrodynamics and phases of flocks. Ann. Phys. Rehabil. Med. 318, 170–244 (2005).
    1. Ramaswamy S., The mechanics and statistics of active matter. Annu. Rev. Condens. Matter Phys. 1, 323–345 (2010).
    1. Marchetti M. C., Joanny J. F., Ramaswamy S., Liverpool T. B., Prost J., Rao M., Simha R. A., Hydrodynamics of soft active matter. Rev. Mod. Phys. 85, 1143–1189 (2013).
    1. Jülicher F., Grill S. W., Salbreux G., Hydrodynamic theory of active matter. Rep. Prog. Phys. 81, 076601 (2018). - PubMed