. 2023 Jul 5;15(703):eabq5923.
doi: 10.1126/scitranslmed.abq5923. Epub 2023 Jul 5.

Proteomics of brain, CSF, and plasma identifies molecular signatures for distinguishing sporadic and genetic Alzheimer's disease

Affiliations

Proteomics of brain, CSF, and plasma identifies molecular signatures for distinguishing sporadic and genetic Alzheimer's disease

Yun Ju Sung et al. Sci Transl Med. .

Abstract

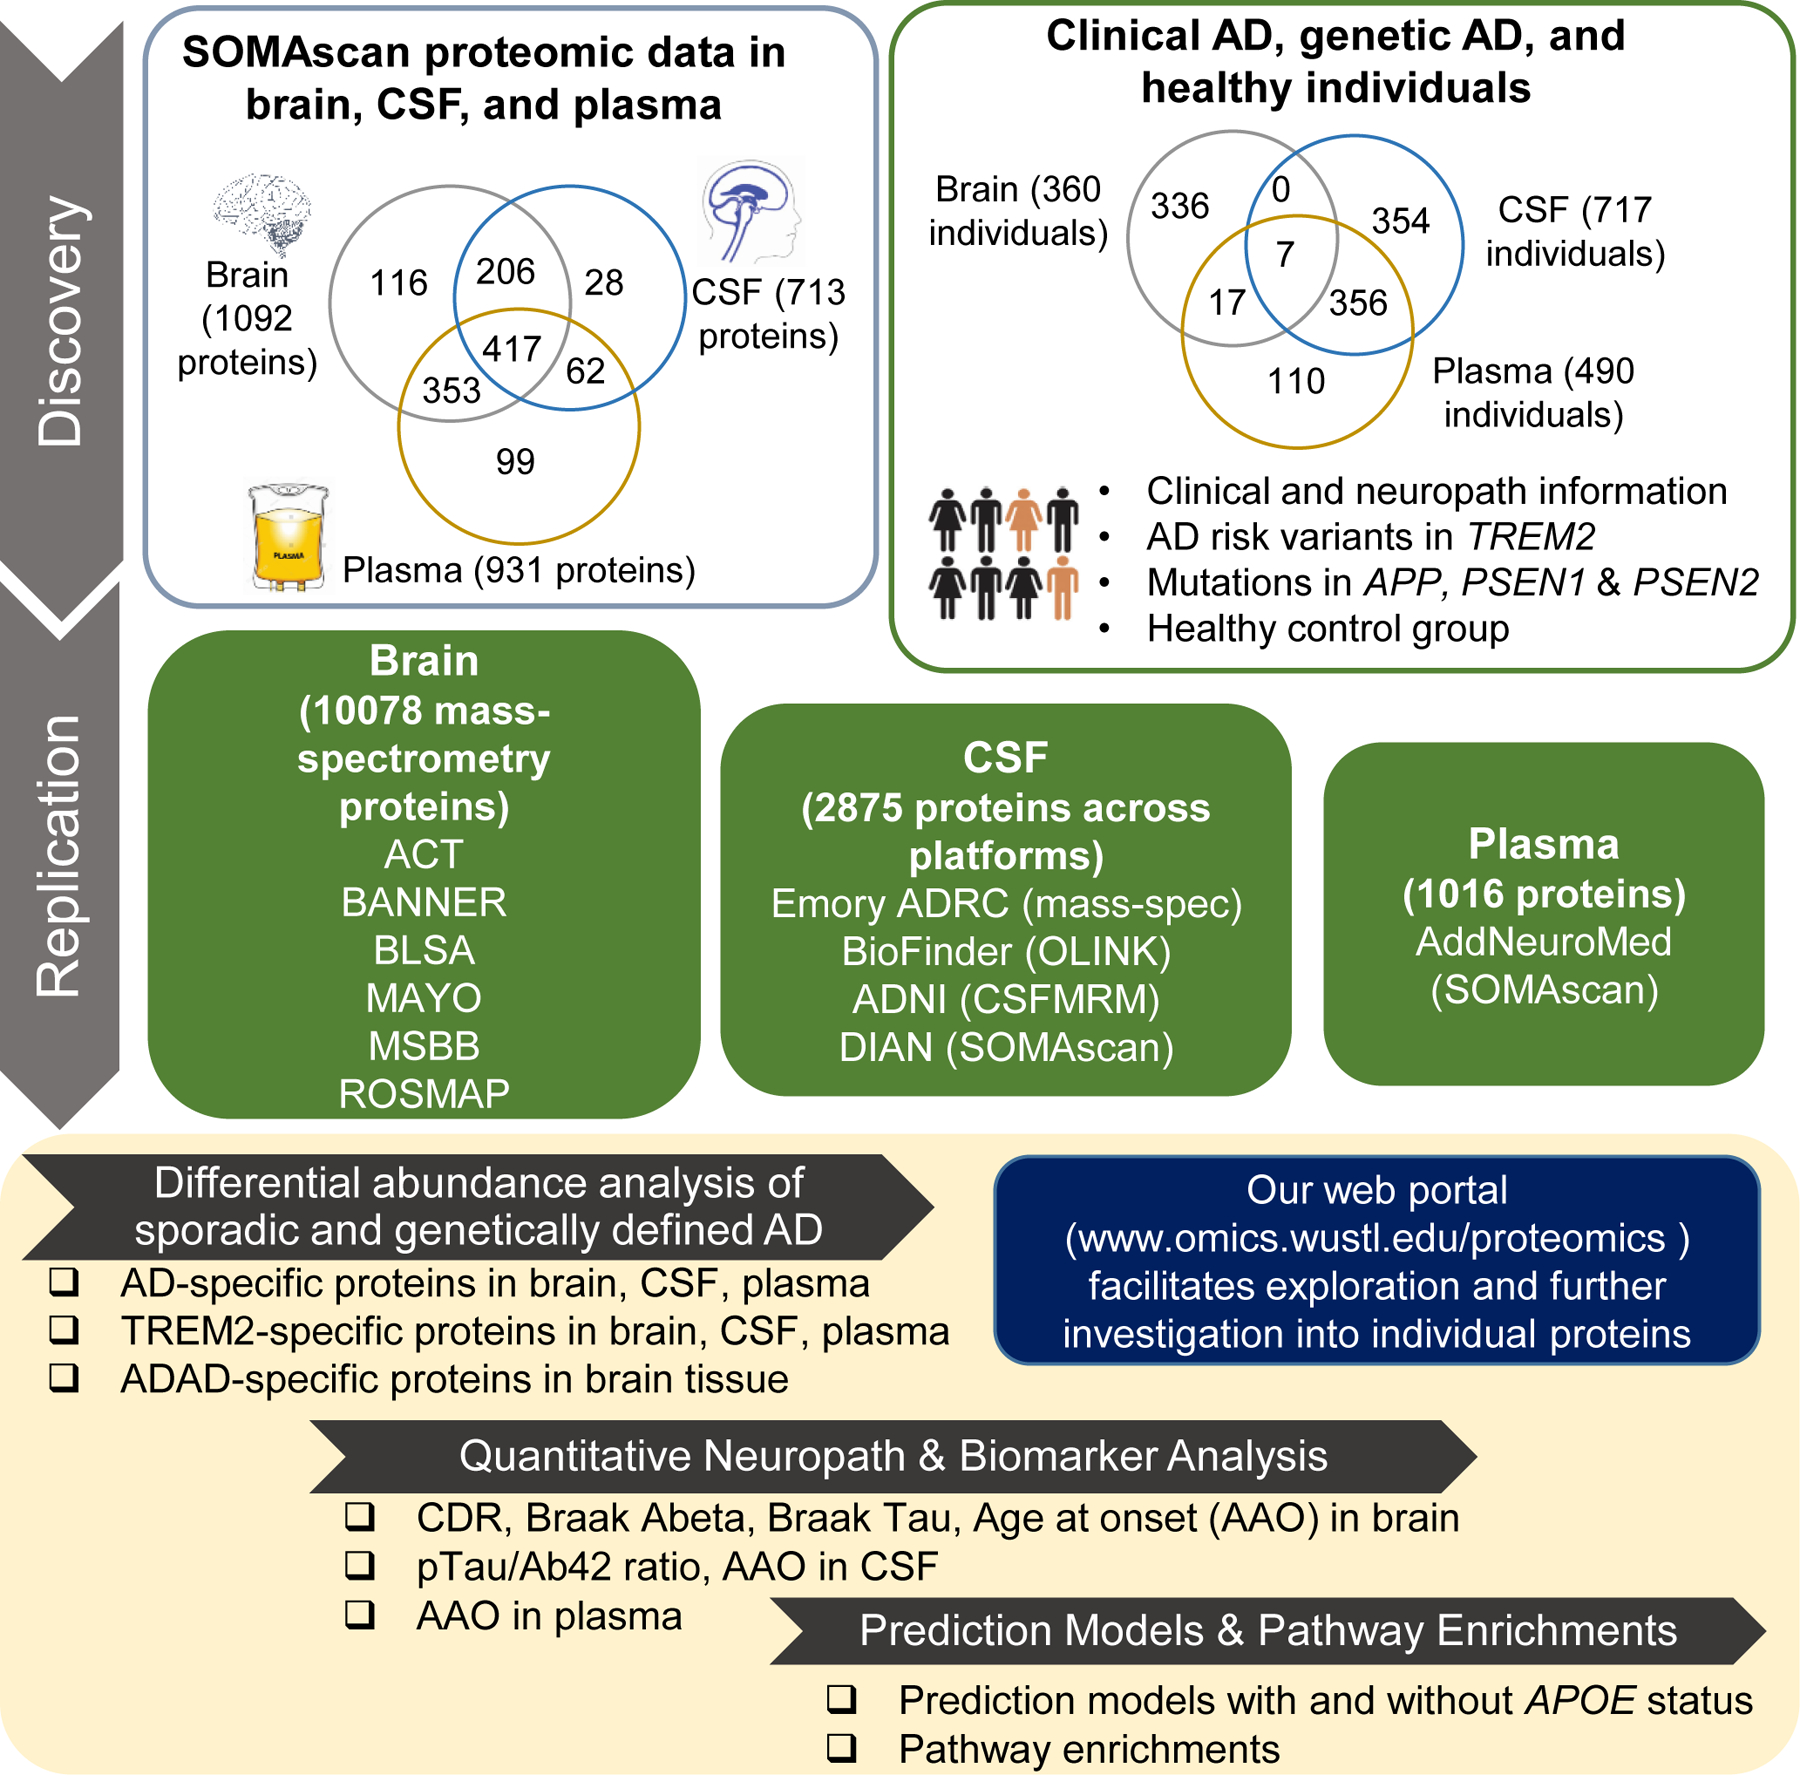
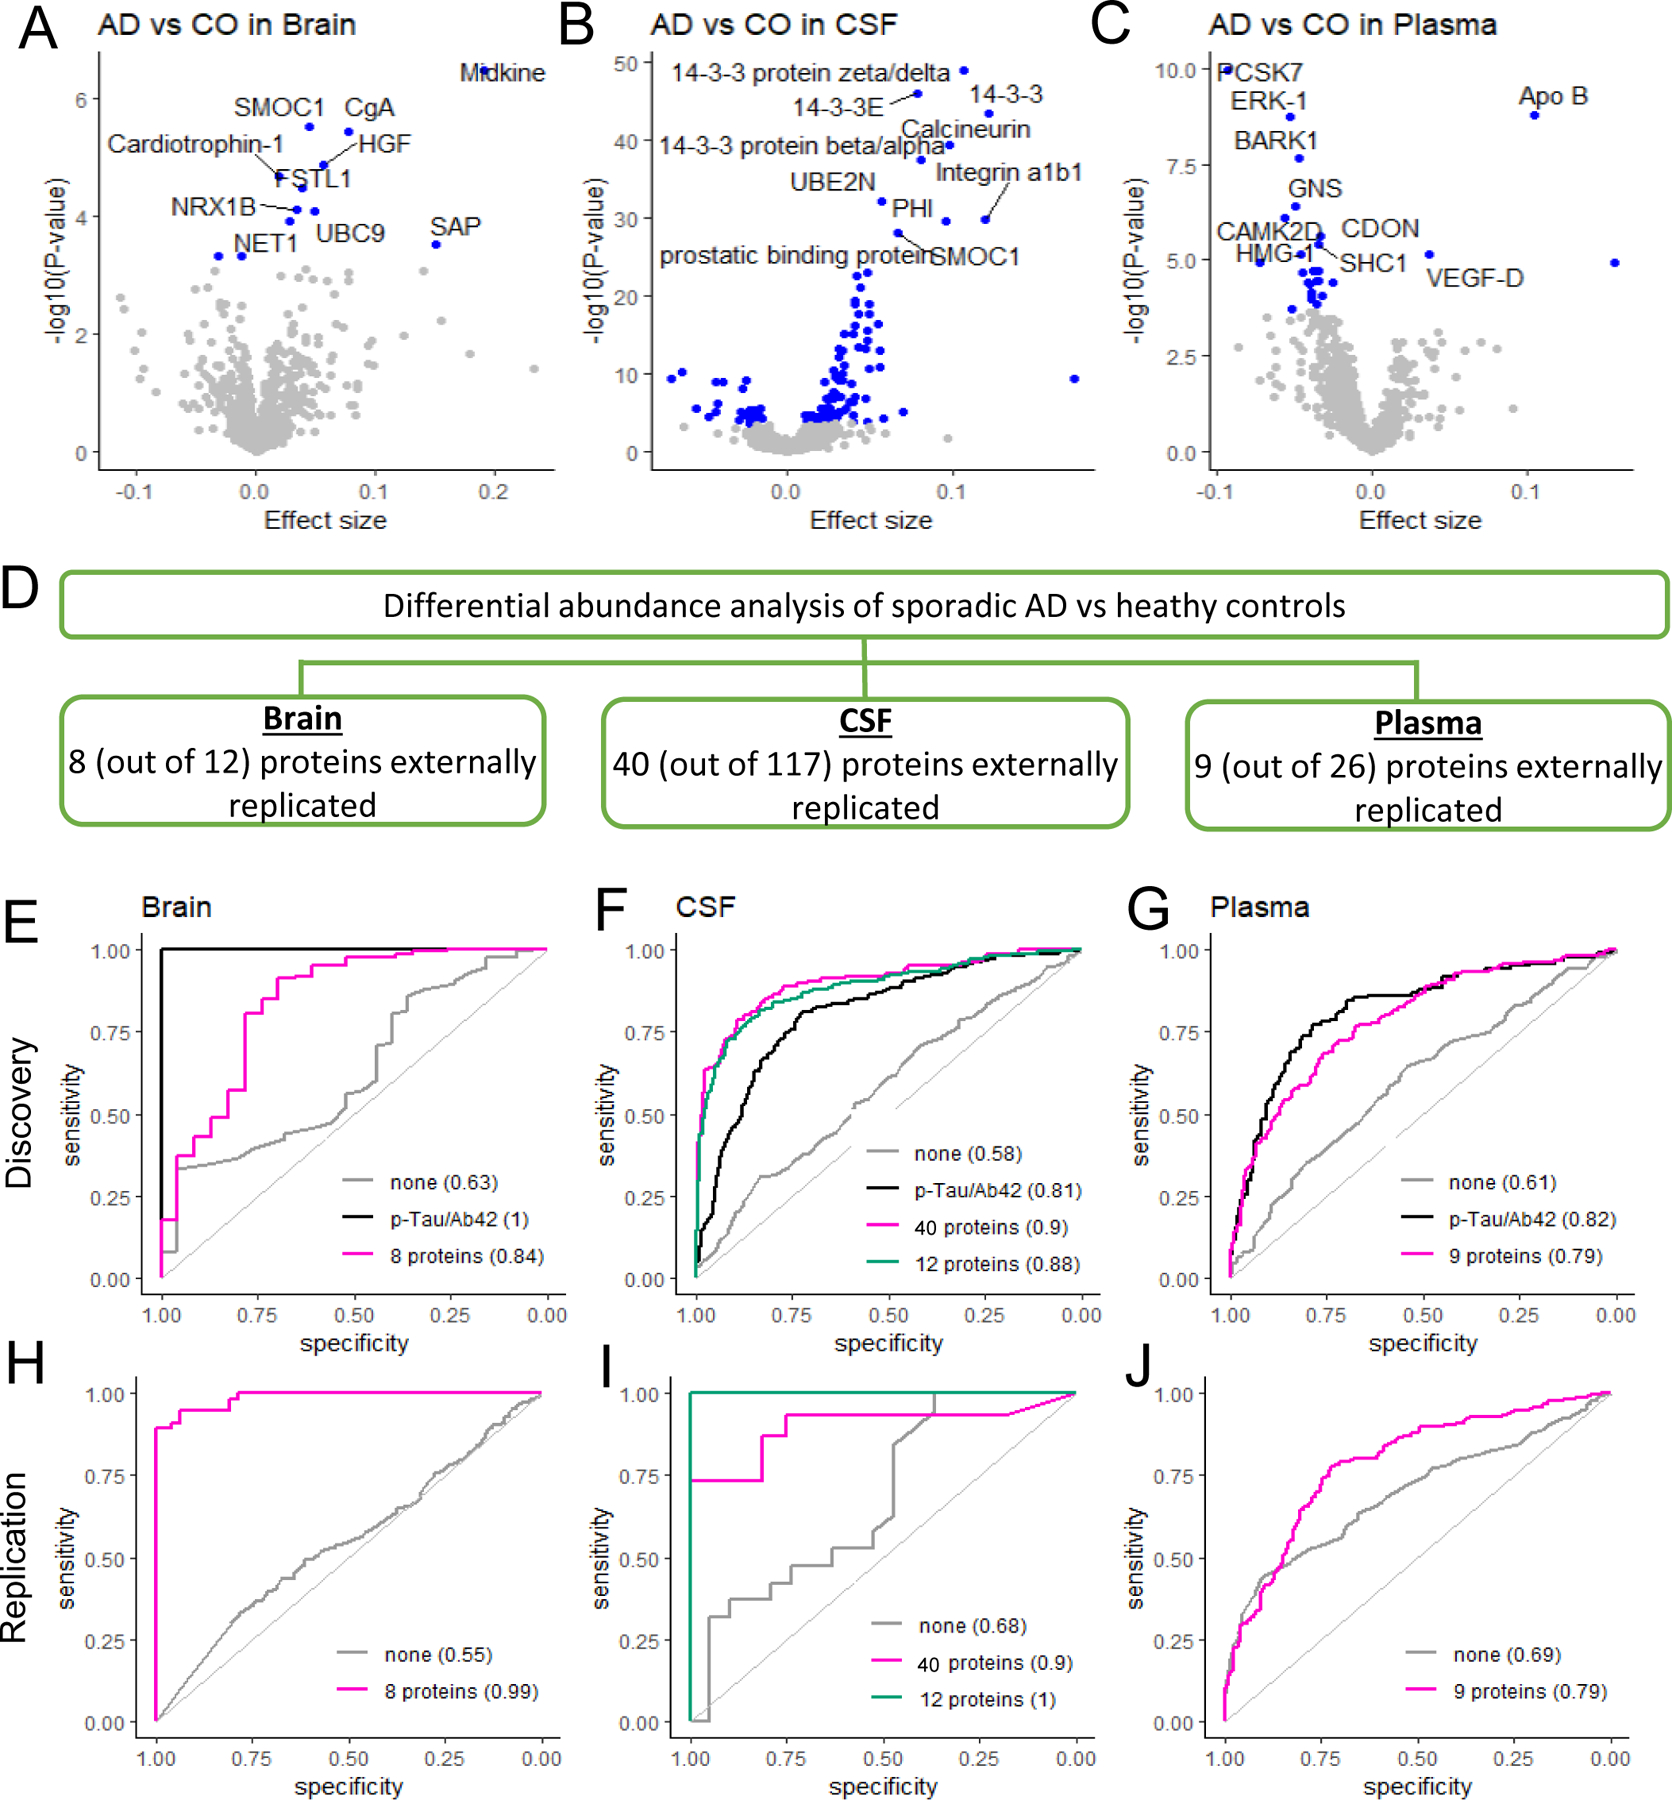
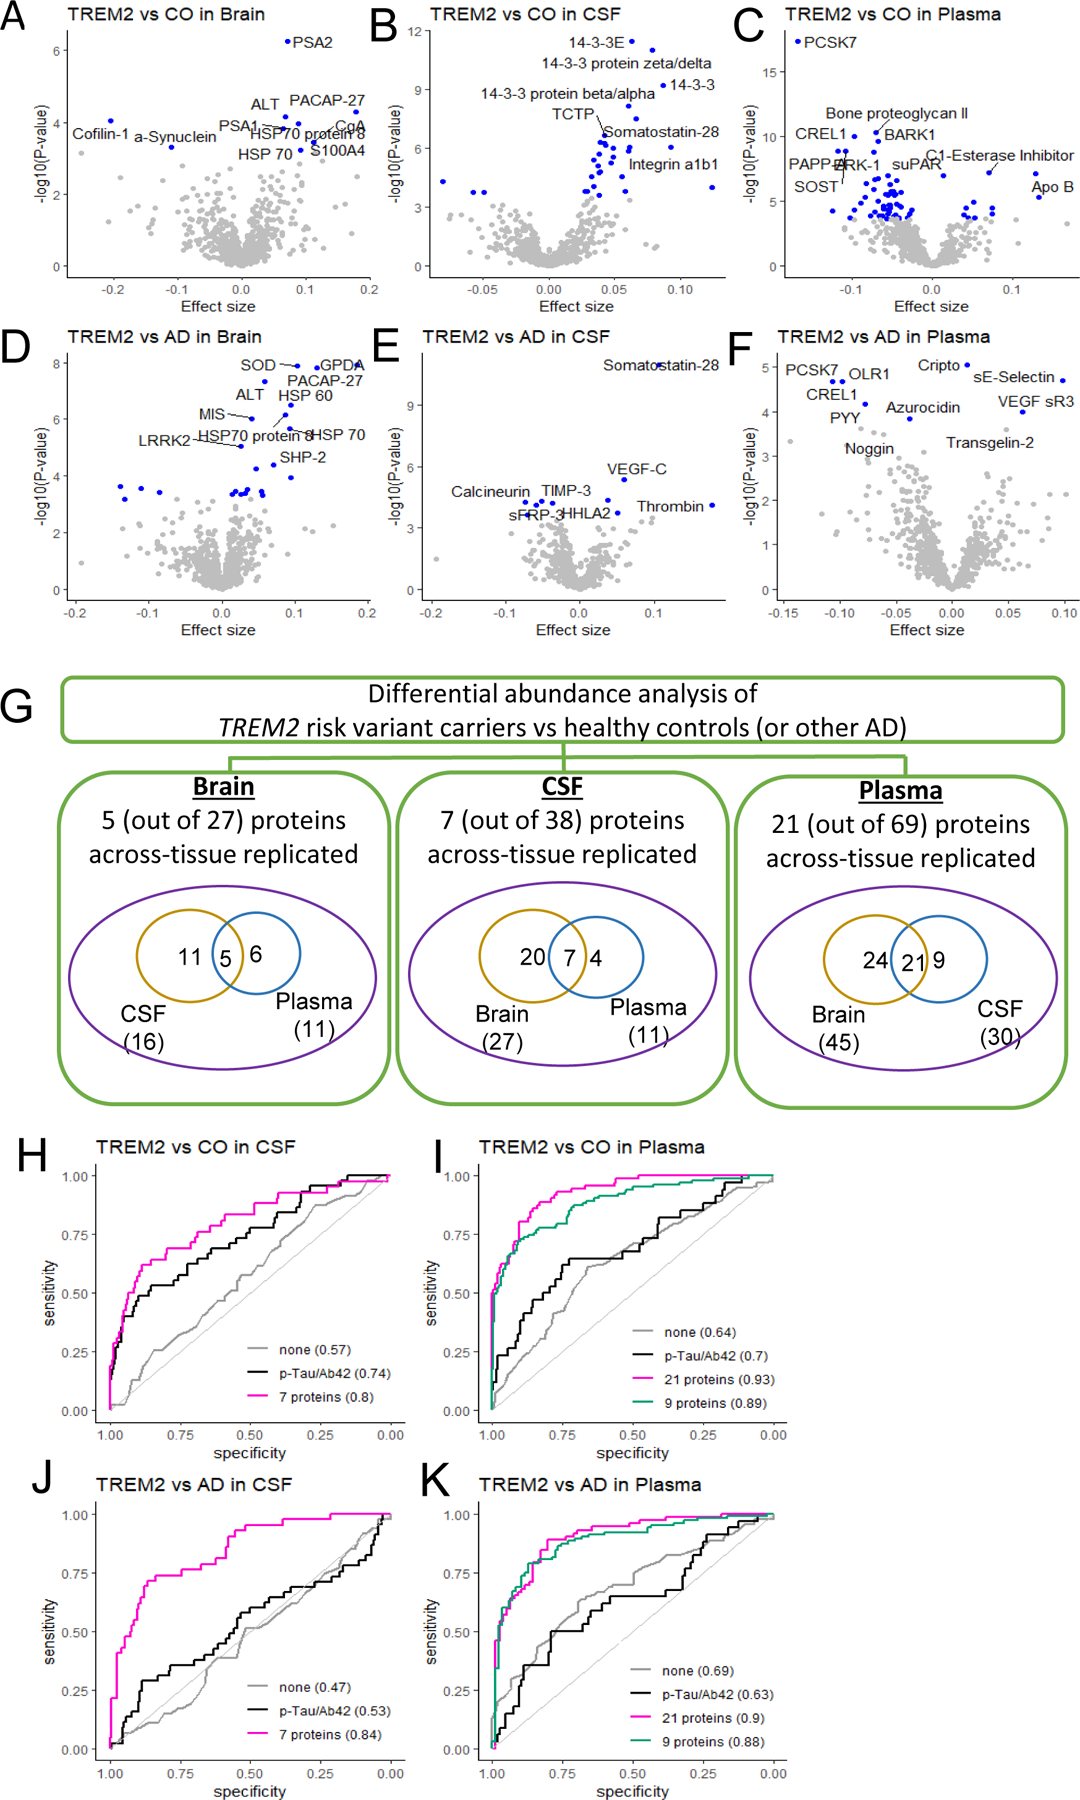
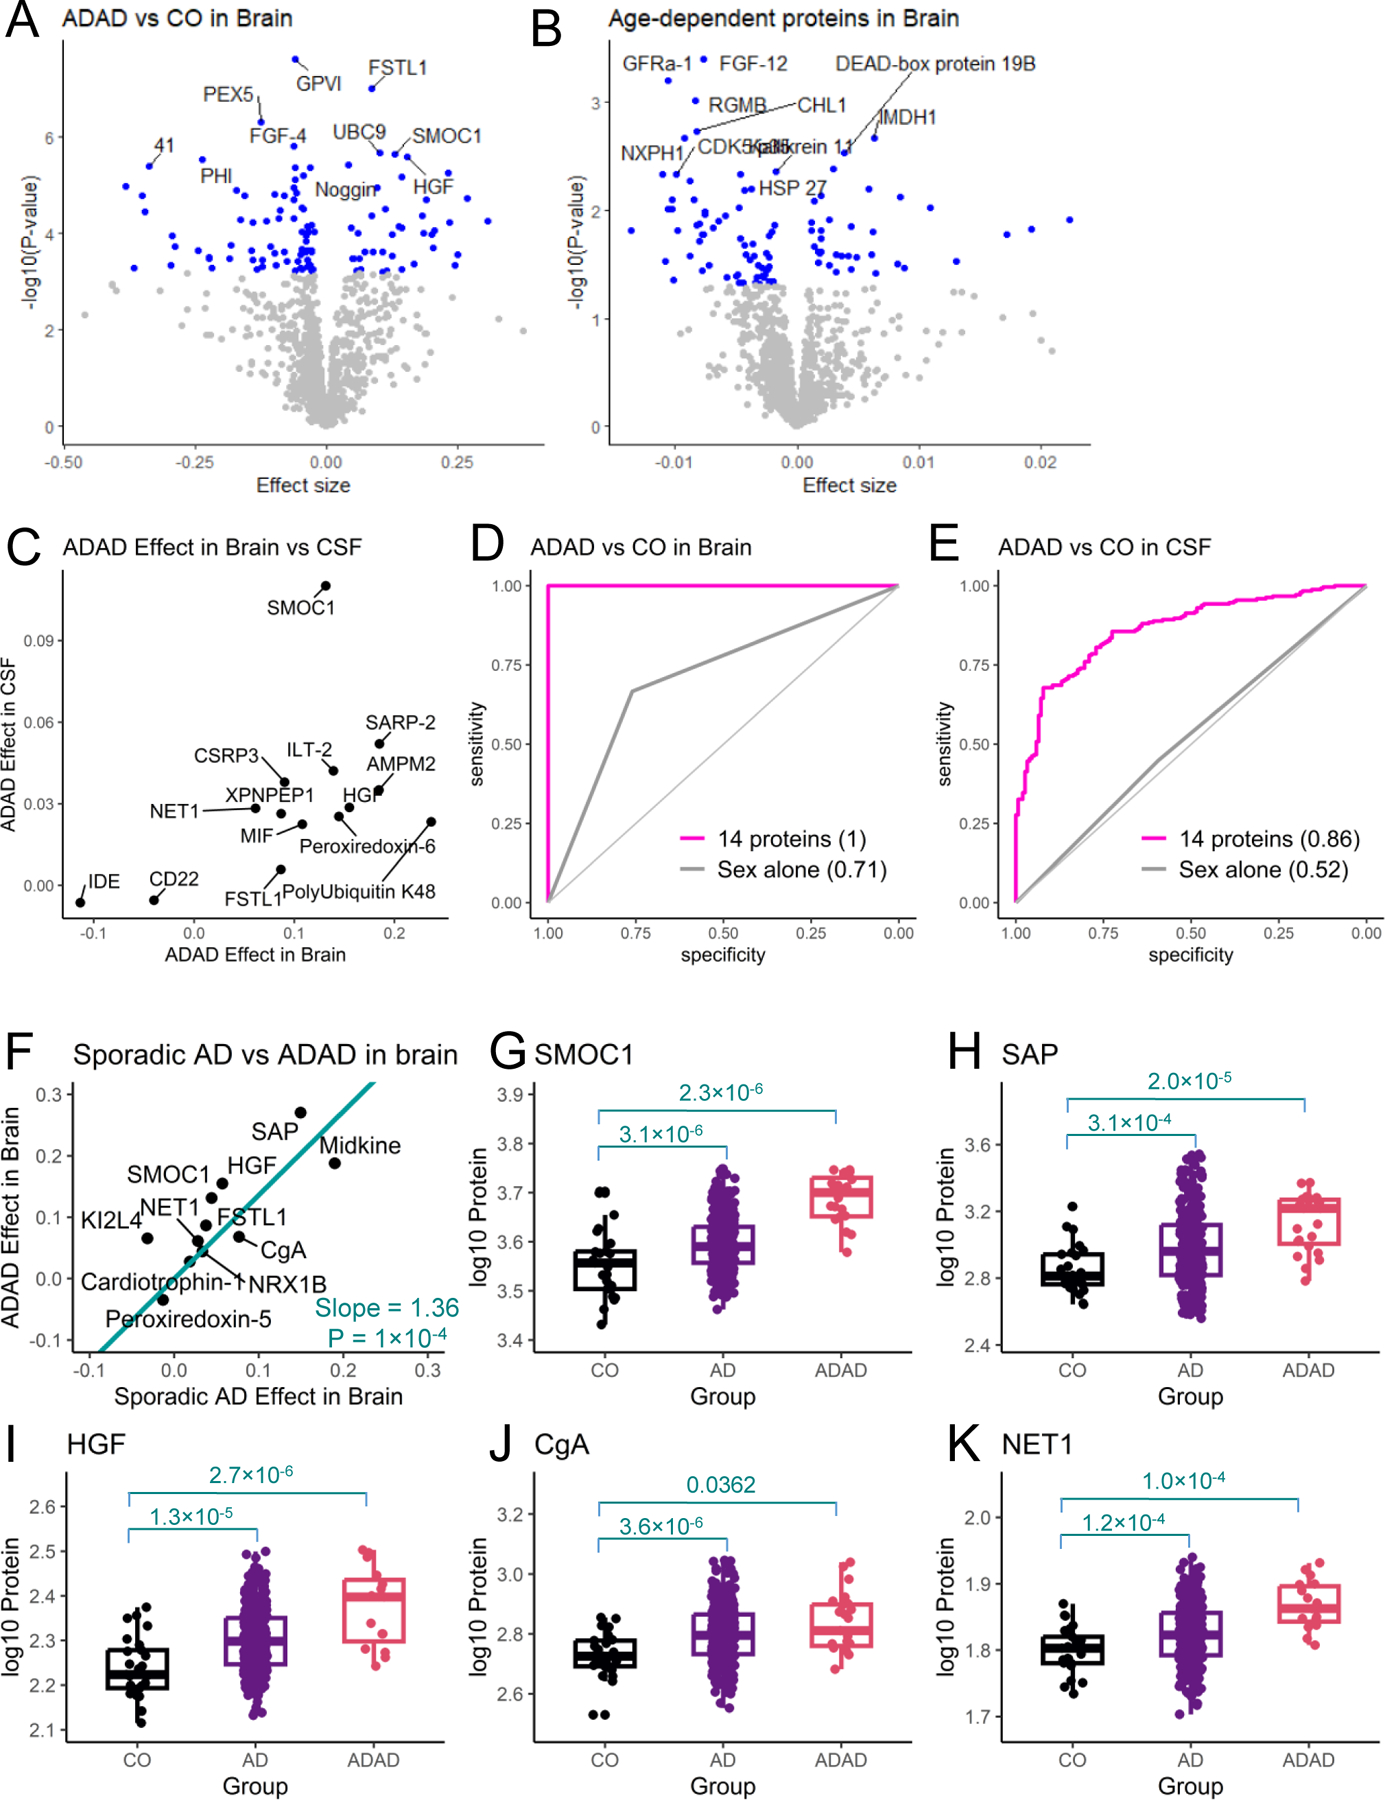
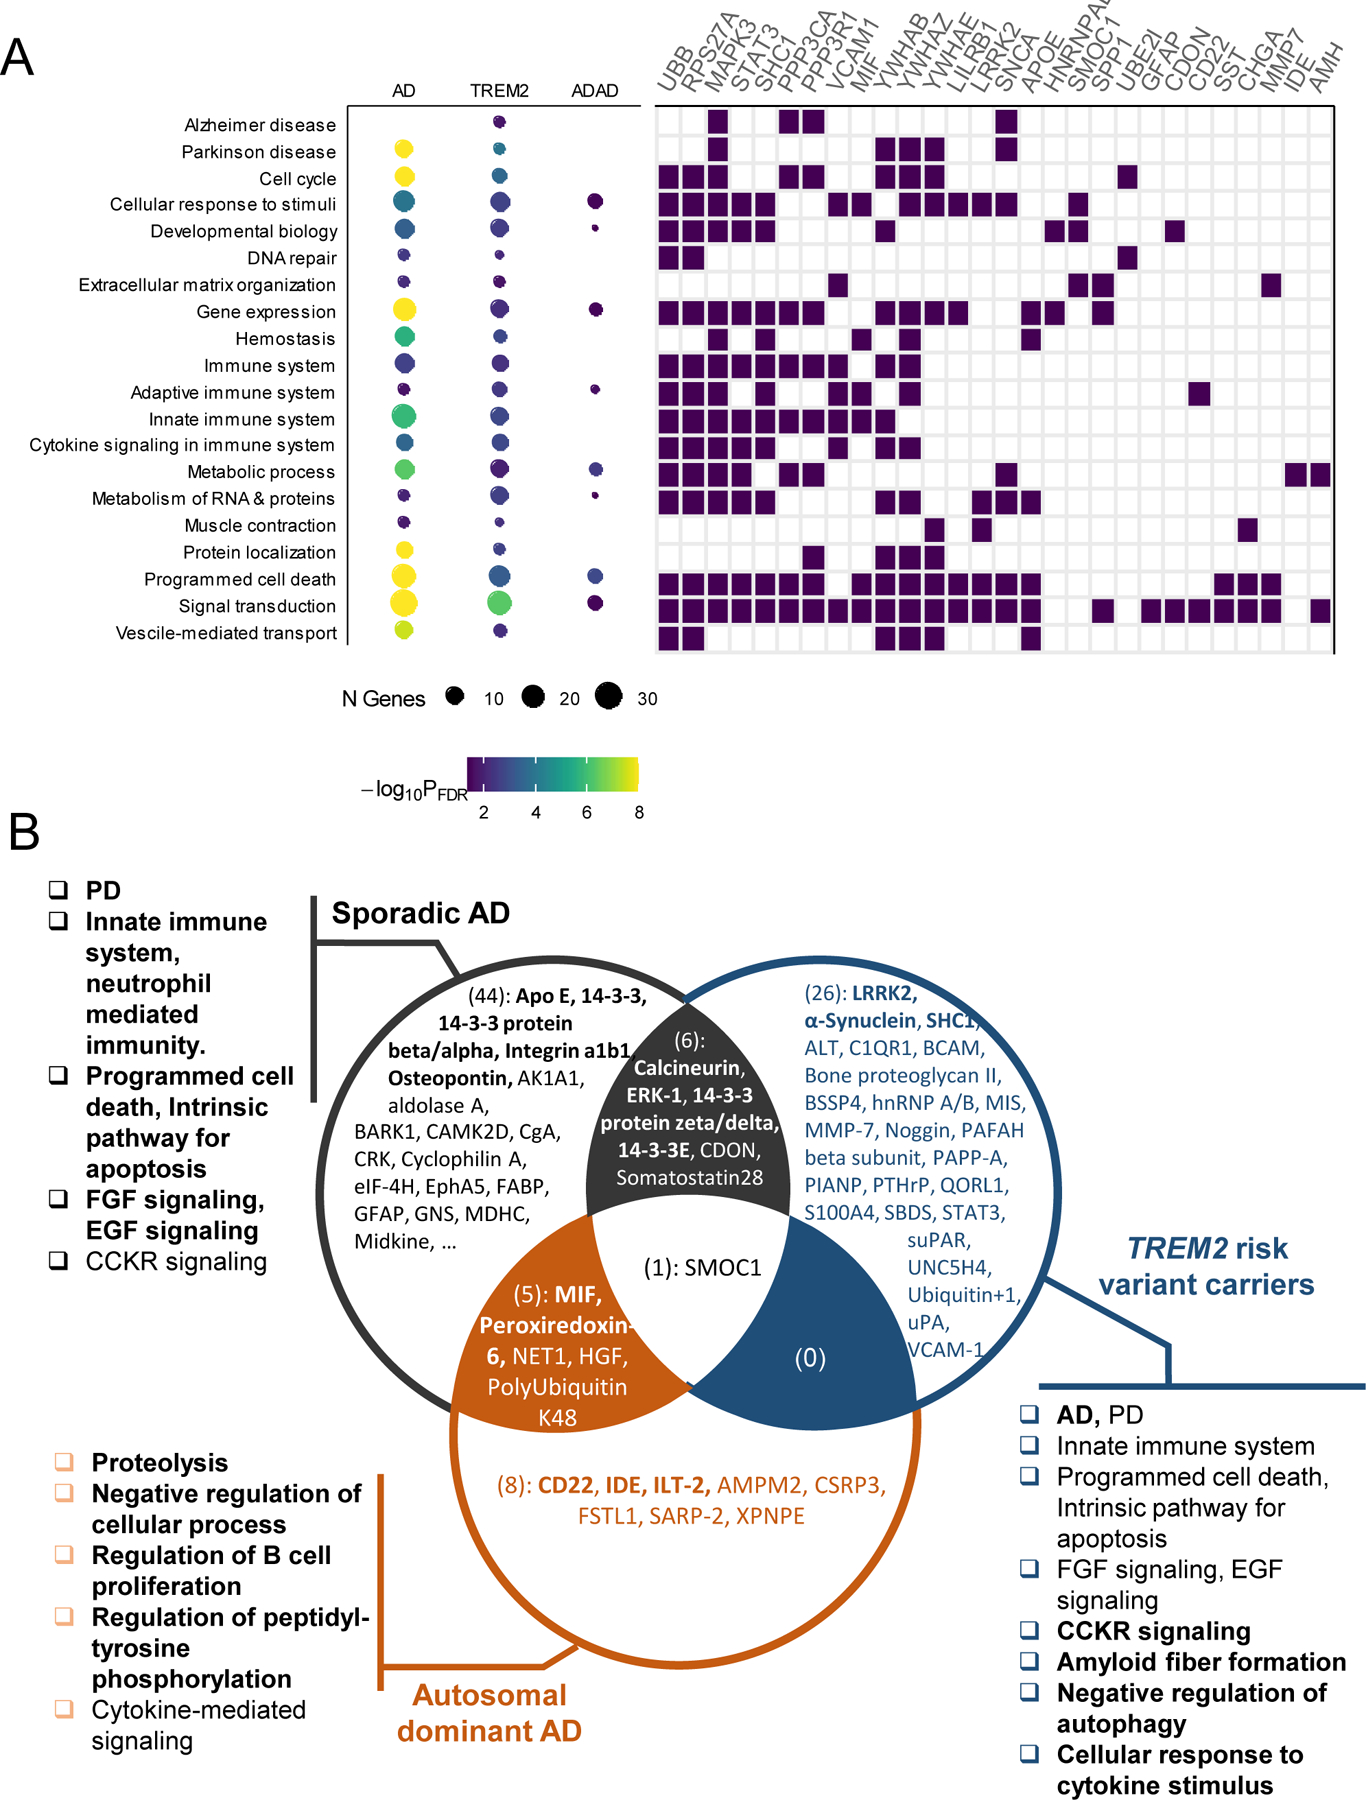
Proteomic studies for Alzheimer's disease (AD) are instrumental in identifying AD pathways but often focus on single tissues and sporadic AD cases. Here, we present a proteomic study analyzing 1305 proteins in brain tissue, cerebrospinal fluid (CSF), and plasma from patients with sporadic AD, TREM2 risk variant carriers, patients with autosomal dominant AD (ADAD), and healthy individuals. We identified 8 brain, 40 CSF, and 9 plasma proteins that were altered in individuals with sporadic AD, and we replicated these findings in several external datasets. We identified a proteomic signature that differentiated TREM2 variant carriers from both individuals with sporadic AD and healthy individuals. The proteins associated with sporadic AD were also altered in patients with ADAD, but with a greater effect size. Brain-derived proteins associated with ADAD were also replicated in additional CSF samples. Enrichment analyses highlighted several pathways, including those implicated in AD (calcineurin and Apo E), Parkinson's disease (α-synuclein and LRRK2), and innate immune responses (SHC1, ERK-1, and SPP1). Our findings suggest that combined proteomics across brain tissue, CSF, and plasma can be used to identify markers for sporadic and genetically defined AD.


Conflict of interest statement

Competing interests: CC has received research support from: GSK and EISAI. The funders of the study had no role in the collection, analysis, or interpretation of data; in the writing of the report; or in the decision to submit the paper for publication. CC is a member of the advisory board of Vivid Genomics and Circular Genomics and owns stocks.

Dr. Fagan has received research funding from the National Institute on Aging of the National Institutes of Health, Biogen, Centene, Fujirebio and Roche Diagnostics. She is a member of the scientific advisory boards for Roche Diagnostics and Genentech and also consults for Diadem, DiamiR and Siemens Healthcare Diagnostics Inc. There are no conflicts. Dr. Seyfried is co-founder of Emtherapro Corp. There are no conflicts.

Figures

Fig. 1.
Fig. 1.. Study outline.
In the discovery stage, protein measures with SOMAscan targeting 1,305 proteins were obtained in brain, CSF, and plasma from well-characterized Knight ADRC and DIAN participants with comprehensive clinical information about AD pathology and cognition. This discovery cohort contained sporadic AD (290 in brain; 176 in CSF; 105 in plasma), TREM2 risk variant carriers (21 in brain; 47 in CSF; 131 in plasma), autosomal dominant AD (24 in brain), and healthy controls (25 in brain; 494 in CSF; 254 in plasma). Differential abundance analyses were performed for sporadic AD status, TREM2 risk variant carrier status, and autosomal dominant AD status. Several publicly available external proteomics data were then used to replicate our findings (details in Supplementary Materials and Methods). Finally, replicated proteins were used for creating tissue-specific prediction models and pathway enrichment analysis. In addition, we built a web portal (omics.wustl.edu/proteomics to support interactive visualization and exploration (fig. S2).
Fig. 2.
Fig. 2.. Multi-tissue proteomics profiling of sporadic AD.
(A) Summary showing the number of identified and externally replicated proteins in three tissues. (B) Volcano plots for brain, CSF, and plasma in discovery analysis. Differential abundance between AD and healthy control (CO) groups is in x-axis and –log10(P-value) for statistical significance are in y-axis. The blue points show the proteins significant at the multiple testing-corrected threshold. While the top 10 proteins are labeled here, the volcano plots in the web portal ((omics.wustl.edu/proteomics) support interactive exploration for all proteins. (C) Tissue-specific prediction models based on the externally replicated proteins (eight in brain, 40 in CSF, and nine in plasma) for both discovery and replication data. Sex and age were included as covariates for all models. ‘None’ corresponds to the model including age and sex only, without any proteins or other biomarkers. Replication data were MassSpec Joint combining all mass-spec based cohorts in brain, Emory-ADRC mass-spec data in CSF, and AddNeuroMed in plasma.
Fig. 3.
Fig. 3.. Multi-tissue proteomics profiling of TREM2 variant carrier status.
(A) Summary showing identified and across-tissue replicated proteins in three tissues. Multiple proteins showed differential abundance in TREM2 variant carriers (compared to controls or other sporadic AD cases) in at least one of the three tissues, several of which are replicated across tissue. (B) Volcano plots for brain, CSF, and plasma tissue. Differential abundance between TREM2 variant carriers and healthy control (CO) groups (at top panels) or other AD (at bottom panels) are in x-axis and –log10(P-value) for statistical significance are in y-axis. While the top 10 proteins are labeled here, the volcano plots in the web portal ((omics.wustl.edu/proteomics) support interactive exploration for all proteins. (C) Tissue-specific prediction models, including sex and age as covariates. ‘None’ corresponds to the model including age and sex only, without any proteins or other biomarkers.
Fig. 4.
Fig. 4.. Proteomic profiling of autosomal dominant AD (ADAD) status.
(A) Volcano plots of differential abundance analysis between individuals with ADAD and healthy control (CO) groups. (B) Volcano plots of differential abundance analysis of age dependent proteins in the brain. (C) The scatterplot of the 14 proteins replicated in CSF and their prediction models in brain and CSF. (D) The scatterplot of the 12 proteins associated with sporadic AD status. The effect of ADAD status on log-transformed protein abundance is in y-axis, and the effect of AD status is in x-axis. The box plots for the select 5 proteins are displayed.
Fig. 5.
Fig. 5.. Pathway enrichments for sporadic and genetically defined AD.
(A) The dot chart (on the left, size corresponding to the number of identified genes and color corresponding to the FDR corrected significance, table S25). The tile plot (on the right) show genes that belong to the specific pathway. A full list of 81 genes is shown in fig. S12. (B) The Venn diagram shows overlap of identified proteins across the three groups: 56 externally replicated proteins for sporadic AD, 33 across-tissue replicated proteins for TREM2, 14 proteins replicated in DIAN CSF data for ADAD. Proteins mentioned in Pathway section are in boldface (for example, Apo E). The pathways highlighted in Pathway section are included. The most enriched pathways across 3 groups are in boldface.

References

    1. A. s. Association, 2020 Alzheimer’s disease facts and figures. Alzheimers Dementia, (2020); published online EpubMar 10 (10.1002/alz.12068). - DOI - PubMed
    1. McKhann G, Drachman D, Folstein M, Katzman R, Price D, Stadlan EM, Clinical diagnosis of Alzheimer’s disease: report of the NINCDS-ADRDA Work Group under the auspices of Department of Health and Human Services Task Force on Alzheimer’s Disease. Neurology 34, 939–944 (1984); published online EpubJul (10.1212/wnl.34.7.939). - DOI - PubMed
    1. Bateman RJ, Xiong C, Benzinger TL, Fagan AM, Goate A, Fox NC, Marcus DS, Cairns NJ, Xie X, Blazey TM, Holtzman DM, Santacruz A, Buckles V, Oliver A, Moulder K, Aisen PS, Ghetti B, Klunk WE, McDade E, Martins RN, Masters CL, Mayeux R, Ringman JM, Rossor MN, Schofield PR, Sperling RA, Salloway S, Morris JC, N. Dominantly Inherited Alzheimer, Clinical and biomarker changes in dominantly inherited Alzheimer’s disease. N Engl J Med 367, 795–804 (2012); published online EpubAug 30 (10.1056/NEJMoa1202753). - DOI - PMC - PubMed
    1. Ulrich JD, Holtzman DM, TREM2 Function in Alzheimer’s Disease and Neurodegeneration. ACS Chem Neurosci 7, 420–427 (2016); published online EpubApr 20 (10.1021/acschemneuro.5b00313). - DOI - PubMed
    1. Guerreiro R, Wojtas A, Bras J, Carrasquillo M, Rogaeva E, Majounie E, Cruchaga C, Sassi C, Kauwe JS, Younkin S, Hazrati L, Collinge J, Pocock J, Lashley T, Williams J, Lambert JC, Amouyel P, Goate A, Rademakers R, Morgan K, Powell J, St George-Hyslop P, Singleton A, Hardy J, Alzheimer Genetic Analysis G, TREM2 variants in Alzheimer’s disease. N Engl J Med 368, 117–127 (2013); published online EpubJan 10 (10.1056/NEJMoa1211851). - DOI - PMC - PubMed

Publication types