. 2023 Jul 5;15(703):eade7028.
doi: 10.1126/scitranslmed.ade7028. Epub 2023 Jul 5.

Dysregulated IFN-γ signals promote autoimmunity in STAT1 gain-of-function syndrome

Affiliations

Dysregulated IFN-γ signals promote autoimmunity in STAT1 gain-of-function syndrome

Andrea D Largent et al. Sci Transl Med. .

Abstract

Heterozygous signal transducer and activator of transcription 1 (STAT1) gain-of-function (GOF) mutations promote a clinical syndrome of immune dysregulation characterized by recurrent infections and predisposition to humoral autoimmunity. To gain insights into immune characteristics of STAT1-driven inflammation, we performed deep immunophenotyping of pediatric patients with STAT1 GOF syndrome and age-matched controls. Affected individuals exhibited dysregulated CD4+ T cell and B cell activation, including expansion of TH1-skewed CXCR3+ populations that correlated with serum autoantibody titers. To dissect underlying immune mechanisms, we generated Stat1 GOF transgenic mice (Stat1GOF mice) and confirmed the development of spontaneous humoral autoimmunity that recapitulated the human phenotype. Despite clinical resemblance to human regulatory T cell (Treg) deficiency, Stat1GOF mice and humans with STAT1 GOF syndrome exhibited normal Treg development and function. In contrast, STAT1 GOF autoimmunity was characterized by adaptive immune activation driven by dysregulated STAT1-dependent signals downstream of the type 1 and type 2 interferon (IFN) receptors. However, in contrast to the prevailing type 1 IFN-centric model for STAT1 GOF autoimmunity, Stat1GOF mice lacking the type 1 IFN receptor were only partially protected from STAT1-driven systemic inflammation, whereas loss of type 2 IFN (IFN-γ) signals abrogated autoimmunity. Last, germline STAT1 GOF alleles are thought to enhance transcriptional activity by increasing total STAT1 protein, but the underlying biochemical mechanisms have not been defined. We showed that IFN-γ receptor deletion normalized total STAT1 expression across immune lineages, highlighting IFN-γ as the critical driver of feedforward STAT1 elevation in STAT1 GOF syndrome.


Conflict of interest statement

Competing interests:

The authors declare the following competing interests. D.L. is an advisor/consultant to the Cystic Fibrosis Foundation Therapeutics Inc., the University of Washington Institute for Translational Medicine Drug and Device Advisory Board, DNARx LLC., Athira Pharma Inc., Kymera Therapeutics Inc., and Sonomotion Inc. T.R.T has had consulting relationships with Takeda, CSL Behring, Grifols, Enzyvant, X4 Pharmaceuticals, Horizon, and Pharming Healthcare, and performed collaborative studies with Incyte and Eli Lilly. J.H.B. is a Scientific Co-Founder and Scientific Advisory Board member of GentiBio, a consultant for Bristol-Myers Squibb and Hotspot Therapeutics, and has past and current research projects sponsored by Amgen, Bristol-Myers Squib, Janssen, Novo Nordisk, and Pfizer. She is a member of the Type 1 Diabetes Trialnet Study Group, a partner of the Allen Institute for Immunology, and a member of the Scientific Advisory Boards for the La Jolla Institute for Allergy and Immunology and BMS Immunology. D.J.R. is Scientific Co-Founder, Scientific Advisor and Scientific Advisory Board member of GentiBio, and Scientific Co-Founder and Scientific Advisory Board member of BeBiopharma Inc. He has past and current funding from GentiBio, CSL-Behring, BeBiopharma Inc., and Emendo Bio for unrelated studies. S.W.J. previously is a consultant for ChemoCentryx, Inc. All other authors declare that they have no competing interests.

Figures

Figure 1:
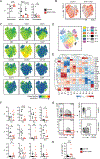
Figure 1:. STAT1 GOF immunophenotyping by mass cytometry
(A) Schematic showing location of STAT1 mutations in the patient cohort. STAT1 protein domains: CCD, Coiled-coil domain; DBD, DNA-binding domain; SH2, Src-Homology 2 domain; Trans, Trans-Activation domain. * Mutation studied in the Stat1GOF murine model. (B) Frequencies of major immune cell types amongst total PBMCs. (C and D) Frequencies of naïve, effector memory (TEM), central memory (TCM), terminally differentiated effector memory T cells (TEMRA) as proportion of total CD4+ (C) and CD8+ (D) T cells. (E) Proportion of Th1, Th1/Th17, Th17, and Th2 cells within non-Tfh memory population (CXCR5CD45RO+CD4+ Teff). (F) Representative flow cytometry plots (gated on non-naïve CD8+) showing expansion of CD38+HLA-DR+ T cells in patients with STAT1 GOF syndrome. Number equals percentage within gate. (G) CD38+HLA-DR+ cells as a percentage of non-naïve CD8+ (left) and CD4+ (right) T cells. (H) CD38+HLA-DR+CD8+ vs. CD38+HLA-DR+CD4+ cells in patients with STAT1 GOF syndrome. Spearman correlation shown. (I) Representative flow cytometry plots showing gating of CXCR5+PD-1+ cTfh and activated CD38+ICOS+ cTfh. Number equals percentage within gate. (J) Percentage of cTfh (left) and percentage of activated cTfh in control and STAT1 GOF syndrome. (K) Percentage of activated cTfh exhibiting Th1, Th1/Th17, and Th17 surface phenotype. (B-K) Each dot represents an individual; black (control), red (STAT1 GOF syndrome). *, P<0.05; **, P<0.01; ***, P<0.001; ****, P<0.0001; by two-tailed Mann-Whitney test. N=1 CyTOF experiment.
Figure 2:
Figure 2:. STAT1 GOF syndrome promotes broad changes in the CD4+ T cell compartment
(A) t-SNE projection of effector CD4+ T cell composite sample (3500 representative cells per individual). Red contour plot represents concatenated healthy control (left) and patients with STAT1 GOF syndrome (right). Composite sample including patients and controls shown in grey. (B) Heat maps of select marker expression overlaid on composite t-SNE projection from A. (C) t-SNE projection of CD4+ Teff clusters identified using phenograph. (D) Heatmap of marker MFI in CD4+ Teff phenograph clusters. (E) % of CD4+ Teff cells in each phenograph cluster in controls (black) and patients with STAT1 GOF syndrome (red). **, P<0.01; ***, P<0.001; ****, P<0.0001; by two-tailed Mann-Whitney test. N=1 CyTOF experiment.
Figure 3:
Figure 3:. Expansion of activated CXCR3+ B cells in patients with STAT1 GOF syndrome
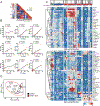
(A) Percentage of IgD+CD27 (Naïve/transitional), IgD+CD27+ (NSWM), IgDCD27+ (SWM), and CD27+CD38+ plasmablasts. (B) t-SNE projection of CD19+ B cell composite sample. Red contour: concatenated control (left) and STAT1 GOF (right). Grey: combined composite sample. (C) Heat maps of select marker expression in composite t-SNE from B. (D) t-SNE projection of CD19+ B cell phenograph clusters. (E) Heatmap of marker MFI in CD19+ B cell phenograph clusters. (F) Percentage of CD19+ B cells in each phenograph cluster. (G) Gating strategy to identify CXCR5loCXCR3+ subset within IgD+CD27 B cells. (H) Percentage of CXCR5loCXCR3+ B cells (of IgD+CD27 gate). (A, F, H) Each point indicates an individual; Control (black) and STAT1 GOF (red). *, P<0.05; **, P<0.01; ***, P<0.001, n.s. not significant; by two-tailed Mann-Whitney test. N=1 CyTOF experiment.
Figure 4:
Figure 4:. STAT1-driven changes in CD4+ T cell and B cell compartments correlate with autoantibody titers in patients with STAT1 GOF syndrome
(A) Correlation between CD4+ Teff and CD19+ B cell phenograph clusters in control and STAT1 GOF patients. Heat map shows Spearman’s rank correlation coefficient. *, P<0.05; **, P<0.01; ***, P<0.001; False-discovery rate correction by Benjamini-Hochberg procedure (<0.05 significance threshold). (B) Spearman correlation of STAT1 GOF CD4+ Teff versus CD19+ B cell phenograph clusters. (C) PCA of CD4+ Teff and CD19+ B cell phenograph cluster distribution in controls (black) versus patients with STAT1 GOF syndrome (red). Ellipses indicate 95% probability range for each group. (D) Heatmap of IgM (upper panel) and IgG (lower panel) autoantibody titers in controls (blue), patients with STAT1 GOF syndrome (red), and patients with SLE (green). Timing of serum collection, relative to CyTOF sample, indicated in months. N=1 CyTOF and autoantibody microarray experiment.
Figure 5:
Figure 5:. Enhanced STAT1 activity promotes spontaneous humoral autoimmunity in Stat1GOF mice
(A and B) IFN-γ-induced phospho-STAT1 (pSTAT1) in naïve CD44loCD4+ T cells (A) and CD19+ B cells (B) from WT (black), heterozygous Stat1WT/GOF (blue), and homozygous Stat1GOF/GOF (red) mice. Right panel: Relative pSTAT1 expression over time, normalized to the peak WT response. Left panel: Quantification of pSTAT1 area under the curve (AUC; normalized to WT). (C) pSTAT1 expression over time expressed as a percentage of peak expression for each respective genotype. (D) Histogram of total STAT1 in CD4+ T cells. (E) Total STAT1 MFI (normalized to WT) in indicated subsets. (F) Representative Hep-2 ANA staining (left) and quantification of ANA intensity (right). (G and H) Anti-dsDNA (G) and anti-Sm/RNP (H) IgG and IgG2c autoAb in animals of indicated genotypes. Top panels: Graph of mean autoAb titer (Error bars indicate SEM*; P<0.05, by one-way ANOVA). Lower panel: Pie chart showing percent of animals that are autoAb positive (defined as O.D. > WT mean plus 1 SD) for each antigen/subclass. *, P<0.05; **, P<0.01; ***, P<0.001, by Fisher's exact test relative to WT control. (I) Heatmaps of IgG2c autoantibodies in WT and Stat1GOF/GOF mice. Each column represents an independent animal. (J to O) Spleen weight (J), %PNA+FAS+ GC B cells (K), %PD1+CXCR5+ Tfh cells (L), %CD11b+CD11c+ ABCs (M), and %TACI+IRF4+ plasma cells in spleen (N) and bone marrow (O) in WT (black), heterozygous Stat1WT/GOF (blue), and homozygous Stat1GOF/GOF (red) mice. (P) Representative histogram T-bet expression in indicated immune subsets. (Q) T-bet MFI (normalized to WT for each population) in indicated genotype. (A to C) Data representative of 4 independent experiments. Error bars indicate SEM; *, P<0.05; **, P<0.01, by one-way ANOVA relative to WT control. (E-Q) Each point equals individual animal. *, P<0.05; **, P<0.01;***, P<0.001; ****, P<0.0001, by Kruskal-Wallis test with Dunn’s multiple comparison test (E, J to Q) or by one-way ANOVA (F). Data compiled from 4–10 independent mouse cohorts.
Figure 6:
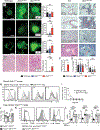
Figure 6:. Systemic autoimmunity despite normal regulatory T cell development and function in murine and human STAT1 GOF syndrome
(A) Immunofluorescence (IF) staining for glomerular IgG, IgG2c, and complement C3. Left panels: Representative images. Right panels: Quantification of glomerular IF staining. (B) Representative hematoxylin and eosin (H&E)-stained kidney sections (left) and glomerular inflammation (right; scored from 0–3 based on mesangial expansion and cellularity, glomerular basement membrane (GBM) thickening, and glomerular hypercellularity). (C to E) Representative images showing widespread organ inflammation in homozygous Stat1GOF/GOF mice, including: lymphoid cell infiltrates in lungs surrounding pulmonary blood vessels (C; upper panels 10x; arrows) with extension into surrounding airspace resulting in patchy alveolar collapse (lower panels 20x; arrows); and inflammatory cell accumulations in perivascular and periductal regions of Stat1GOF/GOF salivary glands (D; 10x) and pancreas (E; 20x). Bars equal 100μm. (F) Composite score of organ inflammation in Stat1GOF model. (G) Percentage (left) and total number (right) of splenic Foxp3+CD25+ global WT, Stat1WT/GOF, and Stat1GOF/GOF mice. (H) WT CD4+ T cell proliferation by cell-trace violet (CTV) dilution co-cultured with indicated ratios of WT or Stat1GOF/GOF Treg. (I) Treg suppression index at different Treg ratios. **, P<0.01, unpaired Student t test. (J) Percentage of YFP+ Treg in spleen and LN of Foxp3cre.Stat1WT/WT and Foxp3cre.Stat1WT/GOF mice. (K) Treg surface marker expression in LN Treg from Foxp3cre.Stat1WT/WT (dashed line) versus Foxp3cre.Stat1WT/GOF (solid line) mice. Gray histogram: WT Foxp3CD4+ non-Treg. (L) CD25, CTLA-4, and Helios MFI on CD4+ non-Treg vs. Foxp3.YFP+ Treg (normalized to WT non-Treg). (A-L) Data representative of 8 independent cohorts with each circle indicating an individual animal. *, P<0.05; **, P<0.01, ***, P<0.001; ****, P<0.0001; ns, not significant, by Kruskal-Wallis test with Dunn’s multiple comparison test (A, B, G, L), and two-tailed Mann-Whitney test (F, J). Bars equal 50μm.
Figure 7:
Figure 7:. Dysregulated type 1 and type 2 IFN signals promote autoimmunity in STAT1 GOF syndrome
(A) Human T cells: CD4+ T cell pSTAT1 MFI (normalized to unstimulated control) following IFN-α, IFN-β, or IFN-γ stimulation. Each data point indicates individual controls (black) and patients with STAT1 GOF syndrome (red). *, P<0.05; **, P<0.01; ***, P<0.001; ****, P<0.0001; by one-way ANOVA followed by Tukey multiple comparison test. N=1 human CD4+ T cell in vitro stimulation. (B to G) Murine Stat1GOF model: (B) Anti-dsDNA and anti-Sm/RNP IgG and IgG2c titers in indicated genotypes. (C to E) Spleen weight (C), Percentage of PD1+CXCR5+ Tfh cells (D), percentage of PNA+FAS+ GC B cells, and percentage of CD11b+CD11c+ ABCs (E) in indicated mice. (F) Representative images showing hematoxylin and eosin (H&E) staining of indicated tissues from Ifnar−/−.Stat1GOF/GOF and Ifngr−/−.Stat1GOF/GOF animals. Bars equal 100μm. (G) Composite score of glomerulonephritis (GN, upper) and organ inflammation (lower) in indicated genotypes. (B to G) Each dot represents an individual WT (light grey), Stat1WT/GOF (dark grey), Stat1GOF/GOF (black), Ifnar−/−.Stat1GOF/GOF (blue), and Ifngr−/−.Stat1GOF/GOF (red) animal. *, P<0.05; **, P<0.01; ***, P<0.001; ****, P<0.0001; by Kruskal-Wallis test with Dunn’s multiple comparison test. Data compiled from 7 Ifnar−/−.Stat1GOF/GOF and 3 Ifngr−/−.Stat1GOF/GOF independent mouse cohorts.
Figure 8:
Figure 8:. IFN-γ drives increased total STAT1 expression in STAT1 GOF syndrome:
(A to C) Murine Stat1GOF model: (A) T-bet MFI (normalized to WT for each population) in WT (light grey), Stat1WT/GOF (dark grey), Stat1GOF/GOF (black), Ifnar−/−.Stat1GOF/GOF (blue), and Ifngr−/−.Stat1GOF/GOF (red) mice. (B) Total STAT1 abundance (normalized to WT for each population) in indicated genotypes. (C) WT and Stat1GOF/GOF B cells were cultured for 4 days on 40LB feeder cells [expressing CD40 ligand (CD40L) and B-cell activating factor (BAFF)] plus indicated concentrations of IFN-γ. Left panel: Histograms of total STAT1 expression assessed by flow cytometry in WT (black) and Stat1GOF/GOF (red) B cells, treated with 0 ng/mL (dashed) or 20 ng/mL (solid) IFN-γ. Right panel: Relative total STAT1 concentrations (normalized to 0 ng/mL IFN-γ condition for each genotype) in WT (black) and Stat1GOF/GOF (red) B cells. (A to C) *, P<0.05; **, P<0.01; ***, P<0.001; ****, P<0.0001; ns, not significant; by one-way ANOVA followed by Tukey multiple comparison test (A), by Kruskal-Wallis test with Dunn’s multiple comparison test (B), and by unpaired Student t test (C). Representative of ≥2 independent experiments. (D to F) Human STAT1 GOF syndrome: (D) Spearman correlation of activated B cell (left) and CD4+ T cell (right) phenograph clusters versus total STAT1 concentrations in total B and CD4+ T cells, respectively. (E) Spearman correlation of IgD+CD27CXCR5loCXCR3+ B cells versus total B cell STAT1. (F) STAT1 MFI in CXCR5hi versus CXCR5lo B cells from controls (black) and patients with STAT1 GOF syndrome (red). (D to F) Each data point indicates an individual healthy control (black) or patient with STAT1 GOF syndrome (red). Spearman correlation statistics are reported for combined population (black) and patients with STAT1 GOF syndrome alone (red). *, P<0.05; ***, P<0.001; by paired t test (F). N=1 CyTOF experiment.

References

    1. Casanova JL, Abel L, Quintana-Murci L, Immunology taught by human genetics. Cold Spring Harb Symp Quant Biol 78, 157–172 (2013). - PubMed
    1. Liu L, Okada S, Kong XF, Kreins AY, Cypowyj S, Abhyankar A, Toubiana J, Itan Y, Audry M, Nitschke P, Masson C, Toth B, Flatot J, Migaud M, Chrabieh M, Kochetkov T, Bolze A, Borghesi A, Toulon A, Hiller J, Eyerich S, Eyerich K, Gulacsy V, Chernyshova L, Chernyshov V, Bondarenko A, Grimaldo RM, Blancas-Galicia L, Beas IM, Roesler J, Magdorf K, Engelhard D, Thumerelle C, Burgel PR, Hoernes M, Drexel B, Seger R, Kusuma T, Jansson AF, Sawalle-Belohradsky J, Belohradsky B, Jouanguy E, Bustamante J, Bue M, Karin N, Wildbaum G, Bodemer C, Lortholary O, Fischer A, Blanche S, Al-Muhsen S, Reichenbach J, Kobayashi M, Rosales FE, Lozano CT, Kilic SS, Oleastro M, Etzioni A, Traidl-Hoffmann C, Renner ED, Abel L, Picard C, Marodi L, Boisson-Dupuis S, Puel A, Casanova JL, Gain-of-function human STAT1 mutations impair IL-17 immunity and underlie chronic mucocutaneous candidiasis. The Journal of experimental medicine 208, 1635–1648 (2011). - PMC - PubMed
    1. van de Veerdonk FL, Plantinga TS, Hoischen A, Smeekens SP, Joosten LA, Gilissen C, Arts P, Rosentul DC, Carmichael AJ, Smits-van der Graaf CA, Kullberg BJ, van der Meer JW, Lilic D, Veltman JA, Netea MG, STAT1 mutations in autosomal dominant chronic mucocutaneous candidiasis. N Engl J Med 365, 54–61 (2011). - PubMed
    1. Uzel G, Sampaio EP, Lawrence MG, Hsu AP, Hackett M, Dorsey MJ, Noel RJ, Verbsky JW, Freeman AF, Janssen E, Bonilla FA, Pechacek J, Chandrasekaran P, Browne SK, Agharahimi A, Gharib AM, Mannurita SC, Yim JJ, Gambineri E, Torgerson T, Tran DQ, Milner JD, Holland SM, Dominant gain-of-function STAT1 mutations in FOXP3 wild-type immune dysregulation-polyendocrinopathy-enteropathy-X-linked-like syndrome. J Allergy Clin Immunol 131, 1611–1623 (2013). - PMC - PubMed
    1. Toubiana J, Okada S, Hiller J, Oleastro M, Lagos Gomez M, Aldave Becerra JC, Ouachee-Chardin M, Fouyssac F, Girisha KM, Etzioni A, Van Montfrans J, Camcioglu Y, Kerns LA, Belohradsky B, Blanche S, Bousfiha A, Rodriguez-Gallego C, Meyts I, Kisand K, Reichenbach J, Renner ED, Rosenzweig S, Grimbacher B, van de Veerdonk FL, Traidl-Hoffmann C, Picard C, Marodi L, Morio T, Kobayashi M, Lilic D, Milner JD, Holland S, Casanova JL, Puel A, S. G.-o.-F. S. G. International, Heterozygous STAT1 gain-of-function mutations underlie an unexpectedly broad clinical phenotype. Blood 127, 3154–3164 (2016). - PMC - PubMed

Publication types