. 2023 Sep 1;325(3):E180-E191.
doi: 10.1152/ajpendo.00084.2023. Epub 2023 Jul 5.

Lactate shuttling drives the browning of white adipose tissue after burn

Affiliations

Lactate shuttling drives the browning of white adipose tissue after burn

Dalia Barayan et al. Am J Physiol Endocrinol Metab. .

Abstract

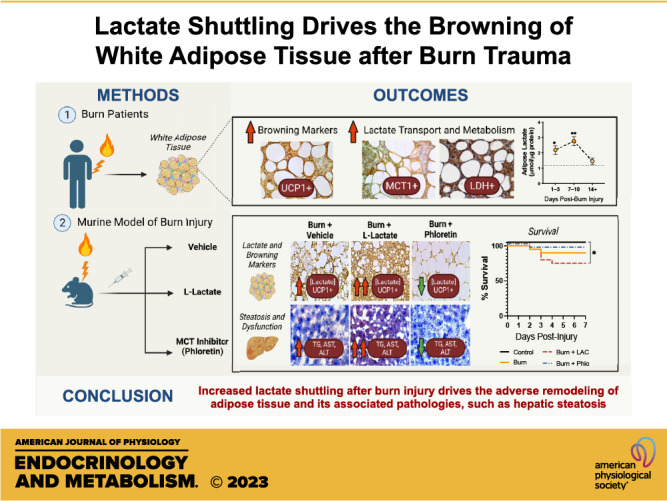
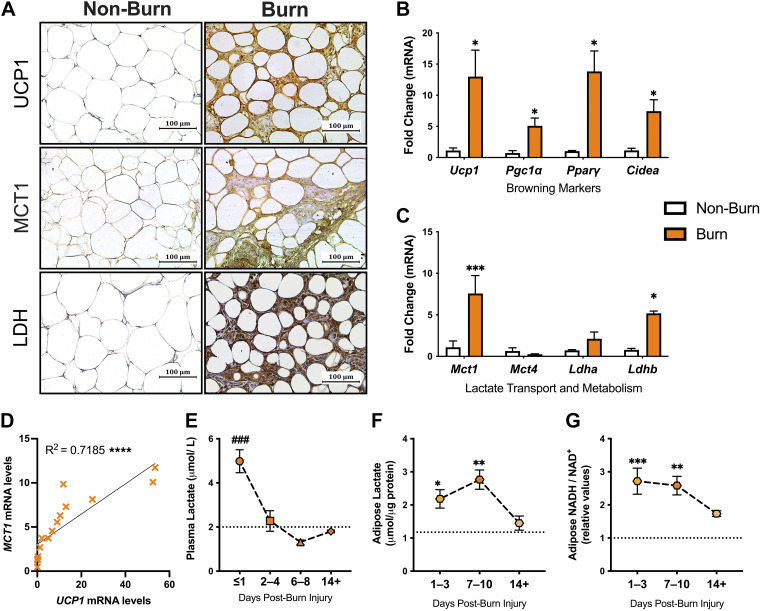
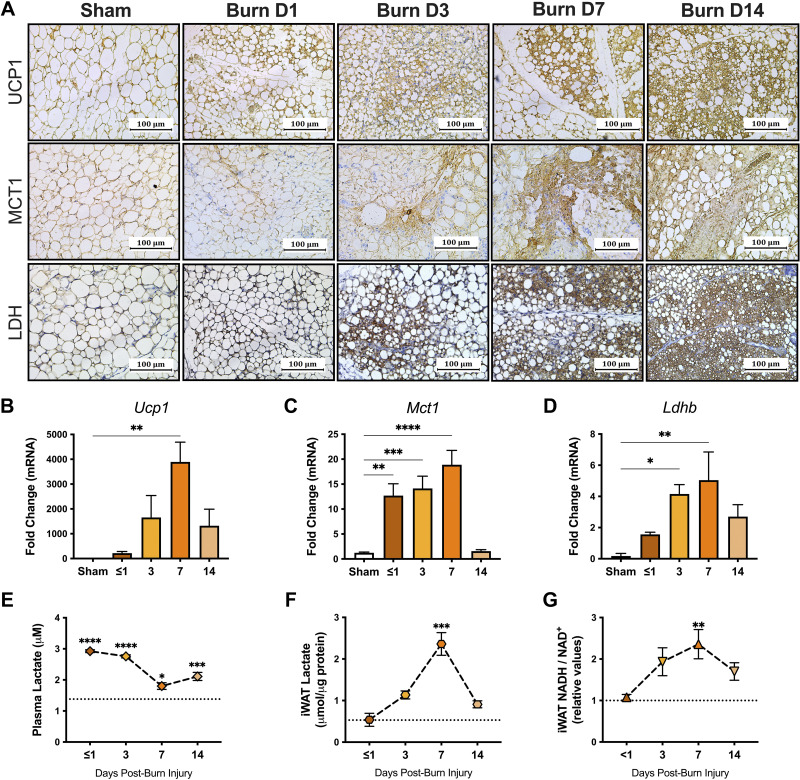
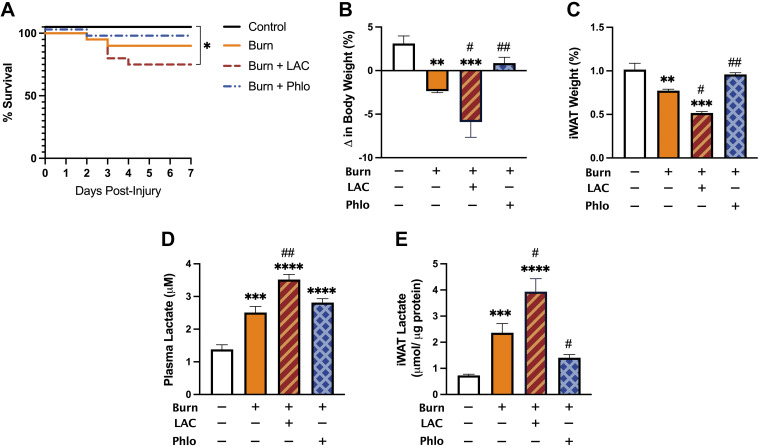
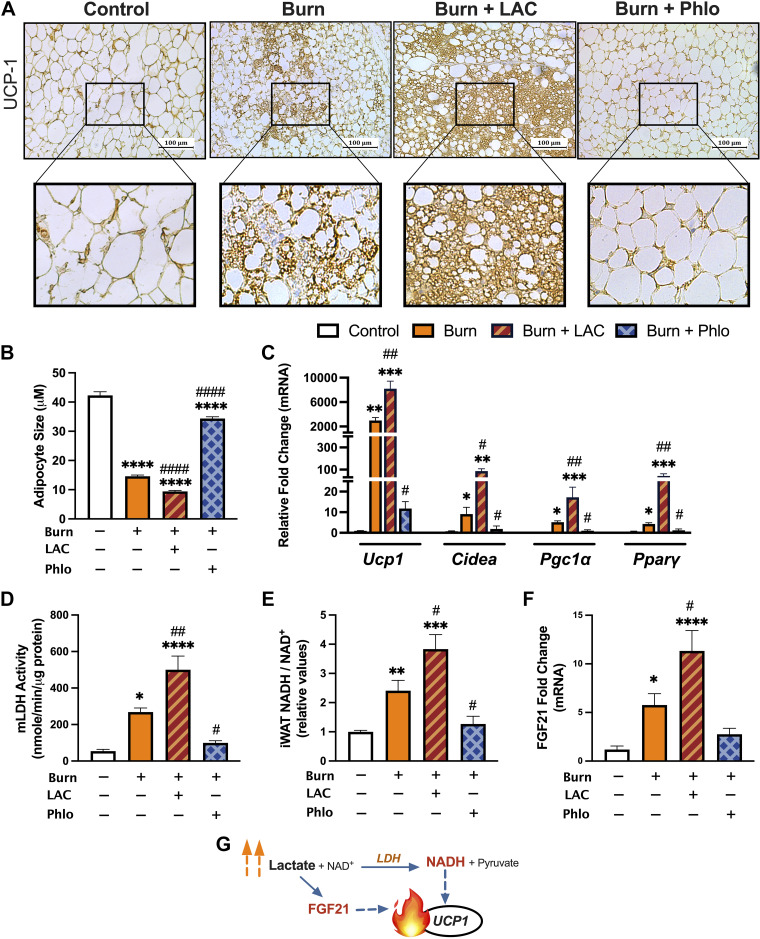
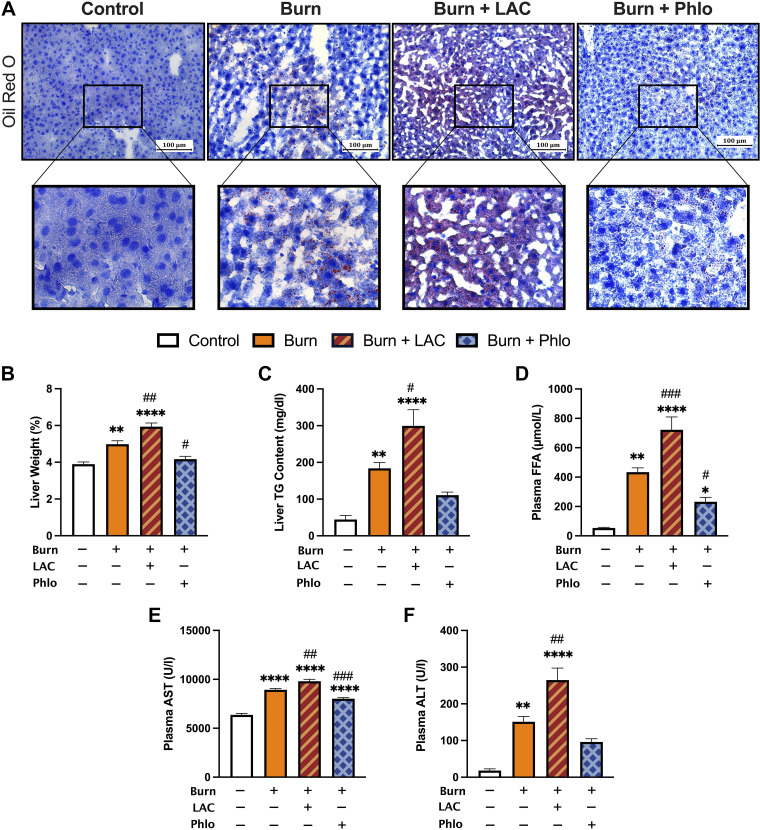
High levels of plasma lactate are associated with increased mortality in critically injured patients, including those with severe burns. Although lactate has long been considered a waste product of glycolysis, it was recently revealed that it acts as a potent inducer of white adipose tissue (WAT) browning, a response implicated in mediating postburn cachexia, hepatic steatosis, and sustained hypermetabolism. Despite the clinical presentation of hyperlactatemia and browning in burns, whether these two pathological responses are linked is currently unknown. Here, we report that elevated lactate plays a causal signaling role in mediating adverse outcomes after burn trauma by directly promoting WAT browning. Using WAT obtained from human burn patients and mouse models of thermal injury, we show that the induction of postburn browning is positively correlated with a shift toward lactate import and metabolism. Furthermore, daily administration of l-lactate is sufficient to augment burn-induced mortality and weight loss in vivo. At the organ level, increased lactate transport amplified the thermogenic activation of WAT and its associated wasting, thereby driving postburn hepatic lipotoxicity and dysfunction. Mechanistically, the thermogenic effects of lactate appeared to result from increased import through MCT transporters, which in turn increased intracellular redox pressure, [NADH/NAD+], and expression of the batokine, FGF21. In fact, pharmacological inhibition of MCT-mediated lactate uptake attenuated browning and improved hepatic function in mice after injury. Collectively, our findings identify a signaling role for lactate that impacts multiple aspects of postburn hypermetabolism, necessitating further investigation of this multifaceted metabolite in trauma and critical illness.NEW & NOTEWORTHY To our knowledge, this study was the first to investigate the role of lactate signaling in mediating white adipose tissue browning after burn trauma. We show that the induction of browning in both human burn patients and mice is positively correlated with a shift toward lactate import and metabolism. Daily l-lactate administration augments burn-induced mortality, browning, and hepatic lipotoxicity in vivo, whereas pharmacologically targeting lactate transport alleviates burn-induced browning and improves liver dysfunction after injury.

Keywords: adipose; browning; burns; hypermetabolism; lactate.


Conflict of interest statement

No conflicts of interest, financial or otherwise, are declared by the authors.

Figures

None
Graphical abstract
Figure 1.
Figure 1.
Upregulated UCP1, MCT1, and LDH in human adipose tissue after burn. A: immunohistochemical staining for UCP1, MCT1, and LDH in normal and burn human subcutaneous WAT (sWAT). Gene expression of browning markers UCP1, PGC1α, PPARγ, and CIDEA (B) and lactate transporters, MCT1 and MCT4, and dehydrogenases, LDHa and LDHb, in normal and burn human sWAT (C). D: correlation graph between MCT1 and mRNA expression. E: plasma lactate levels in burn patients over the course of admission relative to threshold of hyperlactatemia (dotted line) defined as levels >2 µmol/L. Changes in tissue lactate (F) and [NADH/NAD+] (G) levels burn sWAT at 1–3, 7–10, and 14+ days after injury relative to nonburn (dotted line). Values are presented as means ± standard error. Student’s t test and one-way ANOVA, Burn vs. nonburn *P < 0.05; **P < 0.01; ***P < 0.001, ****P < 0.0001 burn at different time points ###P < 0.001. CIDEA, cell death-inducing DNA fragmentation factor-alpha-like effector A; LDH, lactate dehydrogenase; MCT1, monocarboxylate transporter 1; PGC1α, peroxisome proliferator-activated receptor-γ coactivator 1-α; PPARγ, peroxisome proliferator-activated receptor γ; UCP1, uncoupling protein 1; WAT, white adipose tissue.
Figure 2.
Figure 2.
Upregulated UCP1, MCT1, and LDH in murine adipose tissue after burn. A: immunohistochemical staining for UCP1, MCT1, and LDH in inguinal WAT (iWAT) isolated from sham and burn mice at <1, 3, 7, and 14 days after injury. Gene expression of UCP1 (B), MCT1 (C), and Ldhb (D) in iWAT from sham and burn mice at <1, 3, 7, and 14 days after injury. Changes in plasma lactate (E), iWAT lactate (F), and iWAT [NADH/NAD+] (G) in sham (dotted line) and burn mice at <1, 3, 7, and 14 days after injury. Values are presented as means ± standard error. One-way ANOVA, Burn vs. sham *P < 0.05; **P < 0.01; ***P < 0.001; ****P < 0.0001, n = 7/group. LDH, lactate dehydrogenase; MCT1, monocarboxylate transporter 1; PGC1α, peroxisome proliferator-activated receptor-γ coactivator 1-α; PPARγ, peroxisome proliferator-activated receptor γ; UCP1, uncoupling protein 1; WAT, white adipose tissue.
Figure 3.
Figure 3.
Effect of daily l-lactate and Phloretin treatment on postburn mortality and body composition in vivo. A: Kaplan–Meier survival curves of control, vehicle-treated, l-lactate-treated, and Phloretin-treated burn mice over the course of 7 days. Changes in body weight (B), inguinal WAT (iWAT) expressed as a percentage of body weight (C), plasma lactate (D), and tissue lactate (E) in control, vehicle-treated, l-lactate-treated, and Phloretin-treated burn mice at 7 days after injury. Values are presented as means ± standard error. Log-rank test and one-way ANOVA, Burn vs. sham *P < 0.05; **P < 0.01; ***P < 0.001; ****P <0.0001, vehicle vs. treated burn #P < 0.05, ##P < 0.01, n = 7/group. WAT, white adipose tissue.
Figure 4.
Figure 4.
Increased MCT-mediated lactate shuttling augments postburn beige adipocyte formation. A: immunohistochemical staining for UCP1 in iWAT from control, vehicle-treated, l-lactate-treated, and Phloretin-treated burn mice at 7 days after injury. B: postburn changes in adipocyte diameter control (n = 116), vehicle-treated (n = 241), l-lactate-treated (n = 225), and Phloretin-treated (n = 160) burn mice at 7 days after injury. C: quantitative RT-PCR analysis of browning genes in inguinal WAT at 7 days postinjury. Changes in mitochondrial LDH activity (D), relative [NADH/NAD+] (E), and FGF21 gene expression (F) at 7 days postinjury. G: schematic depicting redox-dependent and -independent mechanisms of lactate-induced browning. Values are presented as means ± standard error. One-way ANOVA, Sham vs. burn *P < 0.05; **P < 0.01; ***P < 0.001; ****P < 0.0001, vehicle vs. treated burn #P < 0.05, ##P < 0.01, ####P < 0.0001, n = 7/group. WAT, white adipose tissue.
Figure 5.
Figure 5.
Lactate-induced browning aggravates lipid-induced hepatic dysfunction postburn injury. A: Oil Red O staining for lipid droplets in liver sections from control, vehicle-treated, l-lactate-treated, and Phloretin-treated burn mice at 7 days postinjury. B: liver weights normalized to body weight at 7 days postinjury. C: liver triglyceride (TG) content at 7 days postinjury. Plasma free fatty acid (FFA; D), aspartate transaminase (AST; E), and alanine aminotransferase (ALT; F) concentrations at 7 days postinjury. Values are presented as means ± standard error. One-way ANOVA, Sham vs. burn *P < 0.05; **P < 0.01; ****P < 0.0001, vehicle vs. treated burn #P < 0.05; ##P < 0.01; ###P < 0.001, n = 7/group.

Comment in

References

    1. Bray GA, Bellanger T. Epidemiology, trends, and morbidities of obesity and the metabolic syndrome. Endocrine 29: 109–117, 2006. doi: 10.1385/ENDO:29:1:109. - DOI - PubMed
    1. Bartelt A, Heeren J. Adipose tissue browning and metabolic health. Nat Rev Endocrinol 10: 24–36, 2014. doi: 10.1038/nrendo.2013.204. - DOI - PubMed
    1. Guilherme A, Virbasius JV, Puri V, Czech MP. Adipocyte dysfunctions linking obesity to insulin resistance and type 2 diabetes. Nat Rev Mol Cell Biol 9: 367–377, 2008. doi: 10.1038/nrm2391. - DOI - PMC - PubMed
    1. Galic S, Oakhill JS, Steinberg GR. Adipose tissue as an endocrine organ. Mol Cell Endocrinol 316: 129–139, 2010. doi: 10.1016/j.mce.2009.08.018. - DOI - PubMed
    1. Cristancho AG, Lazar MA. Forming functional fat: a growing understanding of adipocyte differentiation. Nat Rev Mol Cell Biol 12: 722–734, 2011. doi: 10.1038/nrm3198. - DOI - PMC - PubMed

Publication types

LinkOut - more resources