. 2023 Jul 5;14(1):3956.
doi: 10.1038/s41467-023-39652-6.

Blood transcriptomic signatures associated with molecular changes in the brain and clinical outcomes in Parkinson's disease

Affiliations

Blood transcriptomic signatures associated with molecular changes in the brain and clinical outcomes in Parkinson's disease

Krithi Irmady et al. Nat Commun. .

Abstract

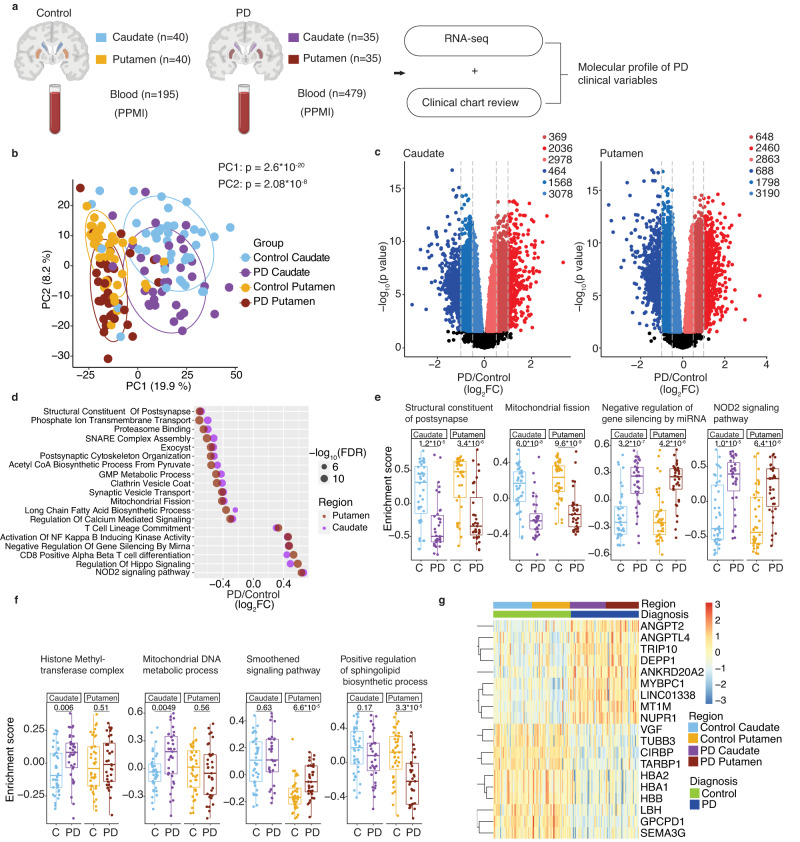
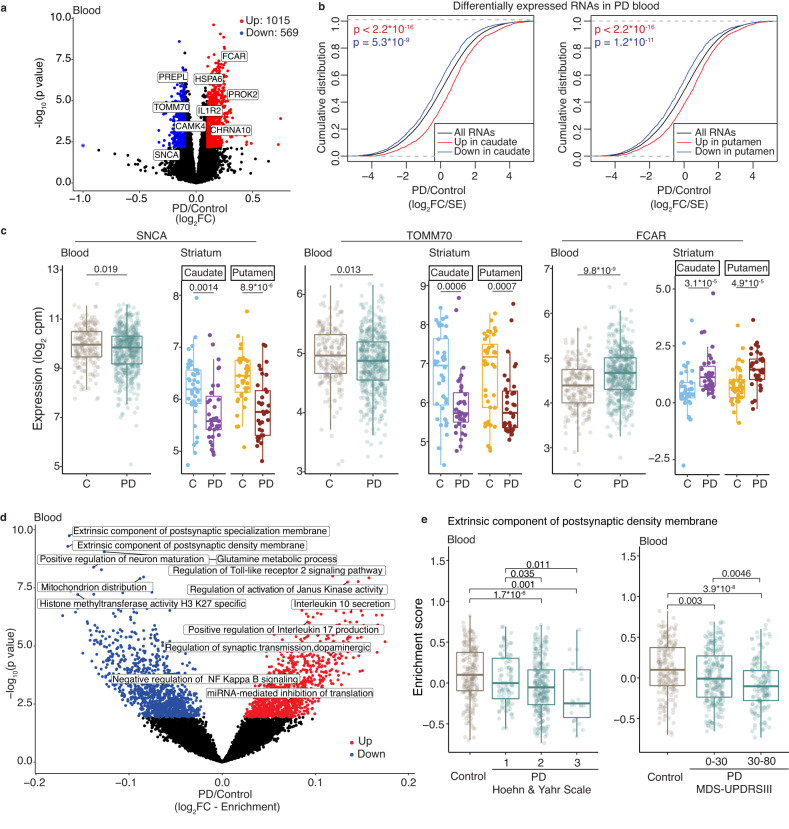
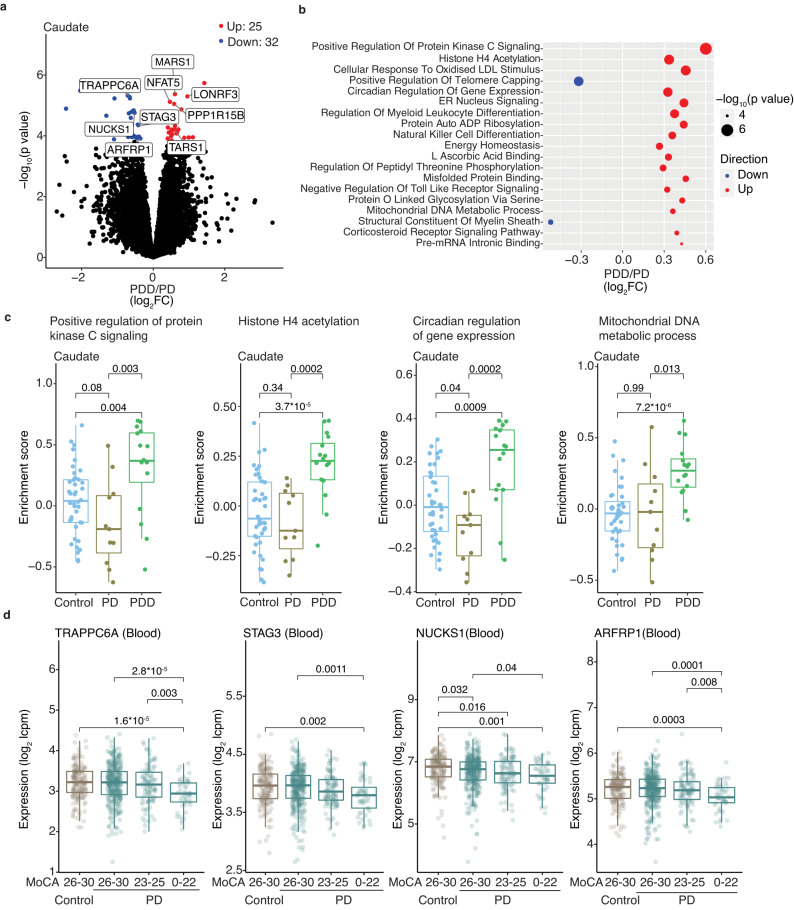
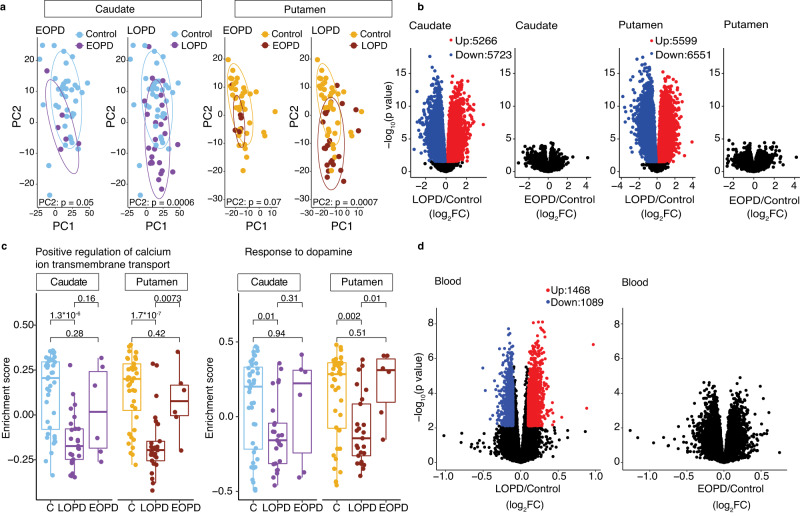
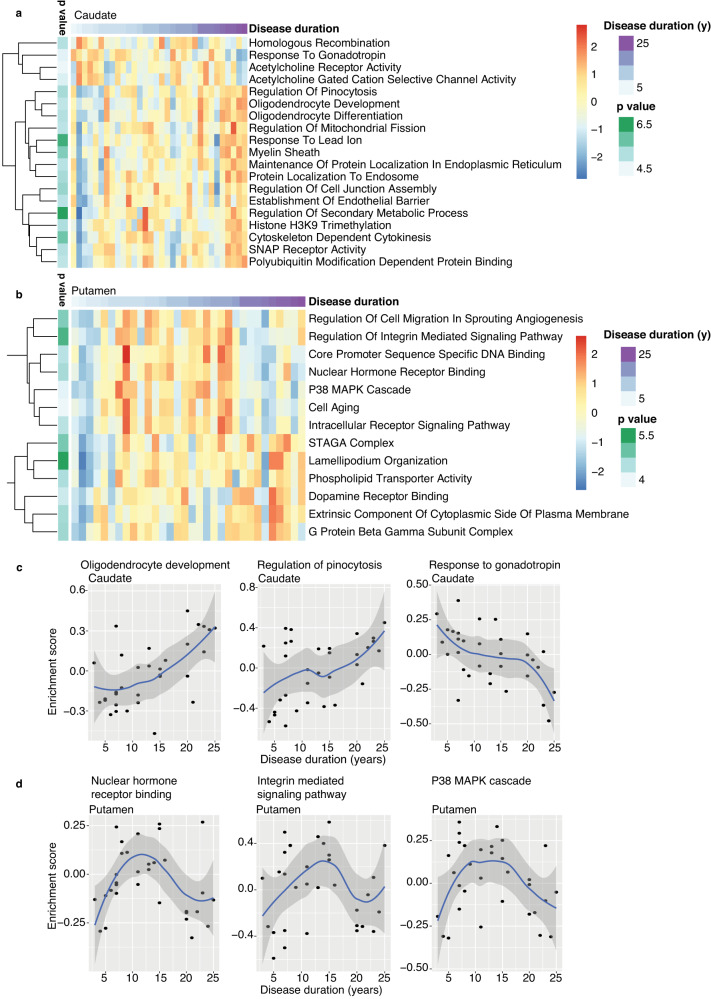
The ability to use blood to predict the outcomes of Parkinson's disease, including disease progression and cognitive and motor complications, would be of significant clinical value. We undertook bulk RNA sequencing from the caudate and putamen of postmortem Parkinson's disease (n = 35) and control (n = 40) striatum, and compared molecular profiles with clinical features and bulk RNA sequencing data obtained from antemortem peripheral blood. Cognitive and motor complications of Parkinson's disease were associated with molecular changes in the caudate (stress response) and putamen (endothelial pathways) respectively. Later and earlier-onset Parkinson's disease were molecularly distinct, and disease duration was associated with changes in caudate (oligodendrocyte development) and putamen (cellular senescence), respectively. Transcriptome patterns in the postmortem Parkinson's disease brain were also evident in antemortem peripheral blood, and correlated with clinical features of the disease. Together, these findings identify molecular signatures in Parkinson's disease patients' brain and blood of potential pathophysiologic and prognostic importance.


Conflict of interest statement

K.I. and R.B.D. are inventors on the provisional United States pending patent application (US 63/464,735) filed by Rockefeller University pertaining to transcriptomic profiles associated with clinical features of PD. R.B.D. serves as a technical advisor for Atreca. S.P. is a member of the scientific board of Luciole Pharmaceuticals. The remaining authors declare no competing interests.

Figures

Fig. 1
Fig. 1. Transcriptome patterns in PD caudate and putamen.
a Overview of the study. Bulk RNA sequencing was performed in postmortem caudate and putamen from controls and PD patients. Antemortem blood transcriptome data was obtained from an independent cohort of subjects enrolled in the PPMI study. Clinical information was extracted from accompanying charts (postmortem donors) and open-access database (PPMI subjects) to determine molecular profiles associated with PD clinical variables. Parts of the image were created with BioRender.com. b Principal component analysis (PCA) shows the separation of caudate and putamen regions of striatum along PC1 (p value: 2.6 × 10−20, Kruskal–Wallis test). Healthy controls and PD are separated along PC2 (p value: 2.08 × 10−8). Ellipses indicate confidence interval = 0.8 of indicated groups. c Volcano plot shows significantly changed RNAs in PD caudate and putamen compared to their respective controls. RNAs with significant changes in expression (determined by moderated t-tests with multiple test corrections using limma) with false discovery rate (FDR) <0.05 and an absolute value of log2 fold change (FC, PD/Control) >0.1, 0.5, and 1 are colored according to direction. d Bubble plot shows representative top significantly (FDR <0.05) up- (log2FC >0) and down (log2FC <0) -regulated GO terms in both caudate and putamen, as determined by GSVA. SNARE: Soluble N-ethylmaleimide-sensitive factor attachment proteins receptor, GMP guanosine monophosphate, NOD nucleotide-binding oligomerization domain. e Sample-wise gene set enrichment scores (determined by GSVA) for individual donors show select GO terms that are changed in both regions. C- Controls (n = 40), PD (n = 35). f Gene set enrichment scores for individual donors show select GO terms that are preferentially changed in either caudate or putamen. C- Controls (n = 40), PD (n = 35). g Heatmap shows expression (log2(counts per million), scaled by genes) of classifier genes (identified in caudate) in control and PD striatum. Significance for box plots were determined by the two-sided Wilcoxon test. Box plots show lower and upper hinges corresponding to the first and third quartiles (representing 25th and 75th percentile, respectively). Whiskers extend from the hinge to the 1.5 × inter-quartile range. The Center line indicates the median. Source data are provided as a Source Data file.
Fig. 2
Fig. 2. Concordant RNA changes are seen in the PD brain and blood.
a Volcano plot showing differential gene expression analysis of blood transcriptome from PPMI subjects. Select RNAs that are also significantly up- or downregulated in the PD striatum (caudate or putamen) are labeled. Controls (n = 195), PD (n = 479). Only significantly (FDR <0.05) changed (log2FC >0.1 or <−0.1) RNAs in PD blood (determined by moderated t-tests with multiple test corrections using limma) are colored according to direction. Blue asterisk indicates log2FC < −1. b Cumulative distribution function plots show that top (FDR <0.05, log2FC >0.5, or log2FC <−0.5) changed RNAs in the PD caudate and putamen (n = 35 each) are collectively differentially expressed in the same direction in blood from controls (n = 195) and PD (n = 479) subjects in the PPMI cohort. p values were calculated using two-sided Kolmogorov–Smirnov tests. c RNA expression box plots showing log2(cpm) for select RNAs significantly changed in the striatum (controls (n = 40), PD (n = 35)), and blood (PPMI) in controls (n = 195) and PD (n = 479) subjects. p values were determined by two-sided Wilcoxon tests. C control. d Volcano plot shows significantly (FDR <0.05) changed GO terms in PD blood compared to controls. Select top GO terms are labeled. p values and FDRs are determined by moderated t-tests and multiple test corrections using limma. e Gene set enrichment scores of the top downregulated GO term (extrinsic component of postsynaptic density membrane) in PD blood correlate with disease progression, based on Hoehn and Yahr scale and MDS-UPDRS III motor scores. C-Controls (n = 195), PD (Hoehn and Yahr 1: n = 93, 2: n = 249, 3: n = 26; MDS-UPDRSIII 0-30: n = 224, 30–80: n = 144) p values were obtained from the Wilcoxon test. Only significant comparisons as determined by two-sided Wilcoxon tests are shown. Box plots show lower and upper hinges corresponding to the first and third quartiles (representing the 25th and 75th percentile, respectively). Whiskers extend from the hinge to the 1.5 × inter-quartile range. The center line indicates the median. Source data are provided as a Source Data file.
Fig. 3
Fig. 3. Caudate is affected in PDD with concordant changes seen in blood.
a Volcano plot shows differentially expressed RNAs in PDD caudate (n = 16) compared to PD without dementia (PD) (n = 11). Only significantly (FDR <0.05) changed (absolute value of log2FC >0.1) RNAs (determined by moderated t-tests with multiple test corrections using limma) are colored according to direction. b Bubble plot shows representative top significant (FDR <0.05) GO terms from GSVA analysis in PDD caudate compared to PD. p values were determined by fgsea, with multiple test correction using the Benjamini–Hochberg method. LDL low-density lipoprotein, ER endoplasmic reticulum, ADP adenosine diphosphate. c GSVA enrichment scores of select GO terms in controls, PD, and PDD. Controls (n = 40), PD (n = 11), PDD (n = 16). p values were determined by two-sided Wilcoxon tests. d Differentially changed RNAs in the PDD caudate show similar changes in expression levels in PD blood with worsening cognition as seen by Montreal Cognitive Assessment (MoCA) scores. Controls (n = 161), PD: MoCA 26-30 (n = 332), 23–25 (n = 96), 0–22 (n = 48). Only significant comparisons as determined by two-sided Wilcoxon tests are shown. Box plots show lower and upper hinges corresponding to the first and third quartiles (representing the 25th and 75th percentile, respectively). Whiskers extend from the hinge to the 1.5 × inter-quartile range. The center line indicates the median. Source data are provided as a Source Data file.
Fig. 4
Fig. 4. PD caudate and putamen from patients with later onset PD (LOPD) show significant changes in RNA levels compared to controls.
a PC2 values (from Fig. 1b) distinguish LOPD (n = 25), but not EOPD (n = 6) samples from controls (n = 40) in both the caudate and putamen. For each region, controls are plotted individually with EOPD (left) and LOPD (right) samples and colored accordingly. p values for separation of the groups along PC2 were obtained from Kruskal–Wallis test. p = 0.05 (Caudate, EOPD and Control), p = 0.0006 (Caudate, LOPD and Control), p = 0.07 (Putamen, EOPD and Control), p = 0.0007 (Putamen, LOPD and Control). Ellipses indicate confidence interval = 0.8 of indicated groups. b Volcano plots show differential gene expression for LOPD and EOPD compared to controls in caudate (left) and putamen (right). Only significantly changed RNAs (FDR <0.05, absolute value of log2FC >0.1) are colored according to direction. p values are determined by moderated t-tests with limma and FDRs are determined by multiple test corrections using the Benjamini–Hochberg method. c Gene set enrichment scores for GO terms are plotted for LOPD, EOPD, and controls (C) in the caudate and putamen. Changes detected in PD donors with LOPD when compared to controls, are not significant in those with EOPD compared to controls. p values are the result of the two-sided Wilcoxon test. Box plots show lower and upper hinges corresponding to the first and third quartiles (representing the 25th and 75th percentile, respectively). Whiskers extend from the hinge to the 1.5 × inter-quartile range. The center line indicates the median. d Volcano plots show differential gene expression analysis in LOPD and EOPD compared to controls in the blood. Only RNAs with FDR <0.05 and an absolute value of log2 FC >0.1 are colored according to direction. Control (n = 195); LOPD (n = 330); EOPD (n = 149). Source data are provided as a Source Data file.
Fig. 5
Fig. 5. Disease duration correlates with distinct molecular changes in caudate and putamen.
a, b Heatmaps show significant (FDR <0.05) GO terms associated with disease duration in PD caudate (a) and putamen (b), identified by spline regression analysis. Scaled expression (log2(cpm)) values are plotted. y years. c, d Scatter plots show GSVA enrichment scores for top significant GO terms plotted against disease duration in caudate (c) and putamen (d). Blue lines indicate loess regression lines, with 95% confidence intervals shaded in gray. Source data are provided as a Source Data file.

References

    1. Poewe W, et al. Parkinson disease. Nat. Rev. Dis. Prim. 2017;3:17013. doi: 10.1038/nrdp.2017.13. - DOI - PubMed
    1. de Lau LML, Breteler MMB. Epidemiology of Parkinson’s disease. Lancet Neurol. 2006;5:525–535. doi: 10.1016/S1474-4422(06)70471-9. - DOI - PubMed
    1. Dauer, W. & Przedborski, S. Parkinson’s disease: mechanisms and models. Neuron. 39, 889–909 (2003). - PubMed
    1. Selikhova M, et al. A clinico-pathological study of subtypes in Parkinson’s disease. Brain. 2009;132:2947–2957. doi: 10.1093/brain/awp234. - DOI - PubMed
    1. Aarsland D, Andersen K, Larsen JP, Lolk A, Kragh-Sørensen P. Prevalence and characteristics of dementia in Parkinson disease: an 8-year prospective study. Arch. Neurol. 2003;60:387–392. doi: 10.1001/archneur.60.3.387. - DOI - PubMed

Publication types