. 2023 Jul 5;14(1):3978.
doi: 10.1038/s41467-023-39215-9.

Water binding and hygroscopicity in π-conjugated polyelectrolytes

Affiliations

Water binding and hygroscopicity in π-conjugated polyelectrolytes

Cindy Guanyu Tang et al. Nat Commun. .

Abstract

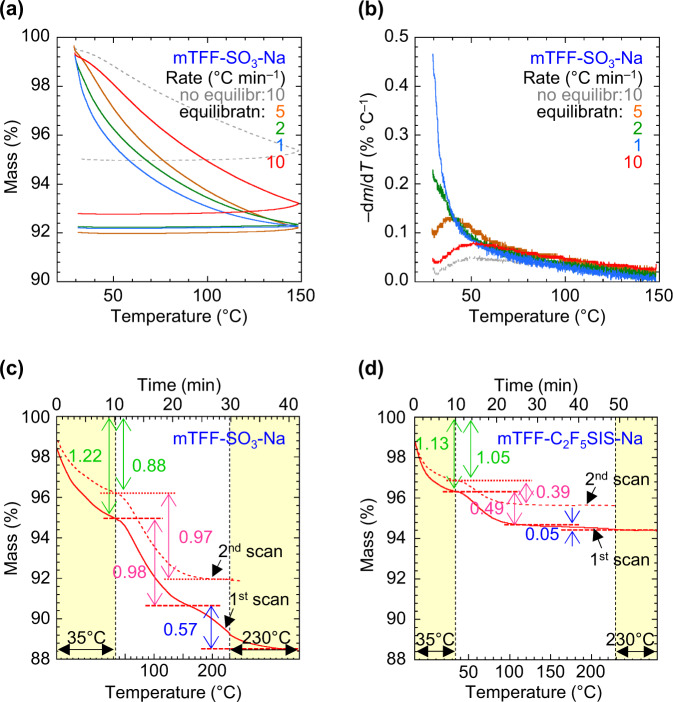
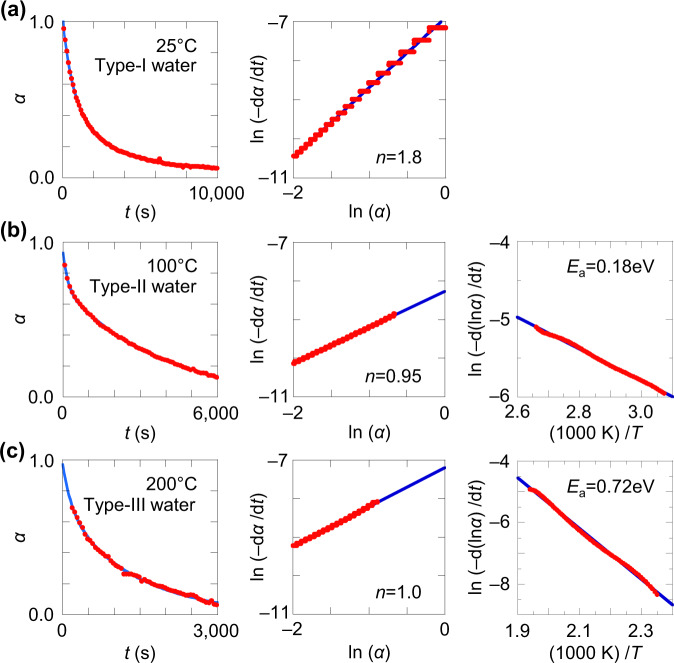
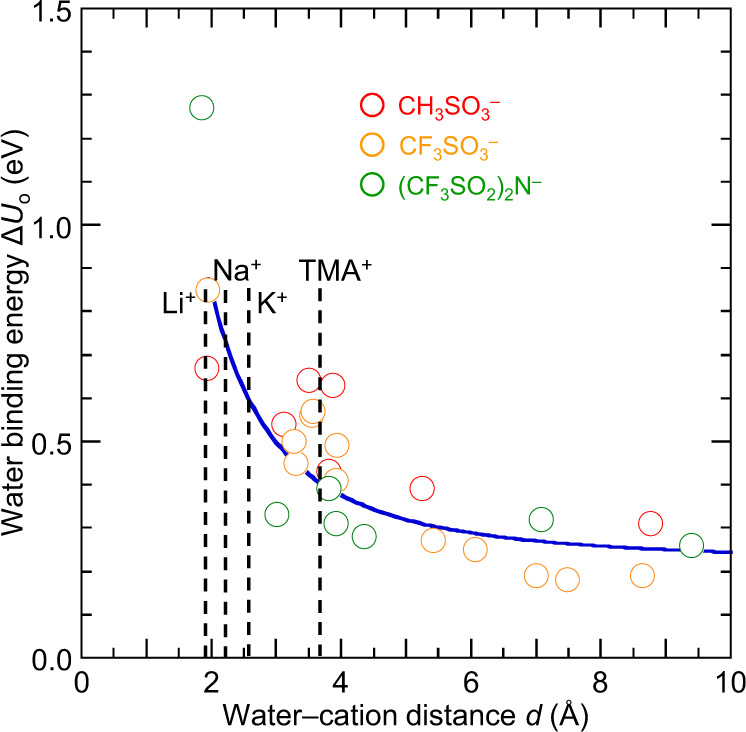
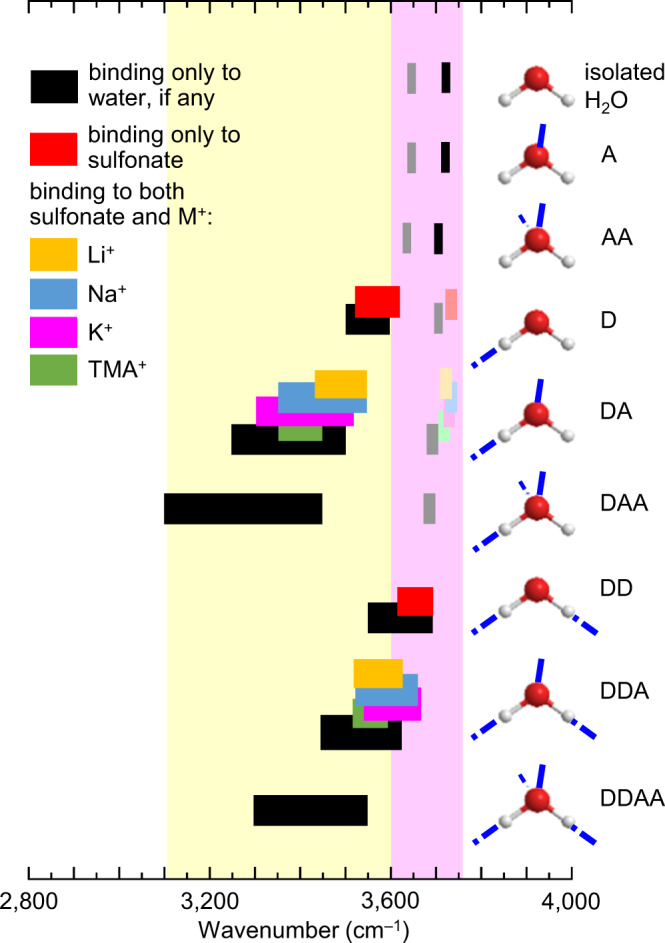
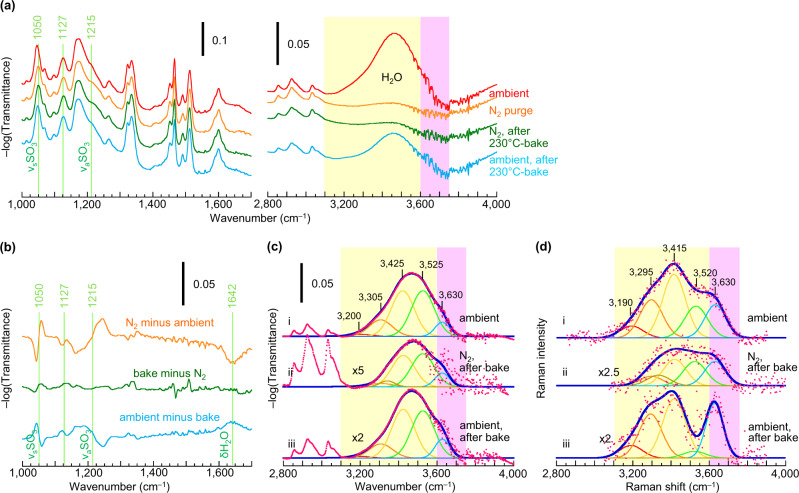
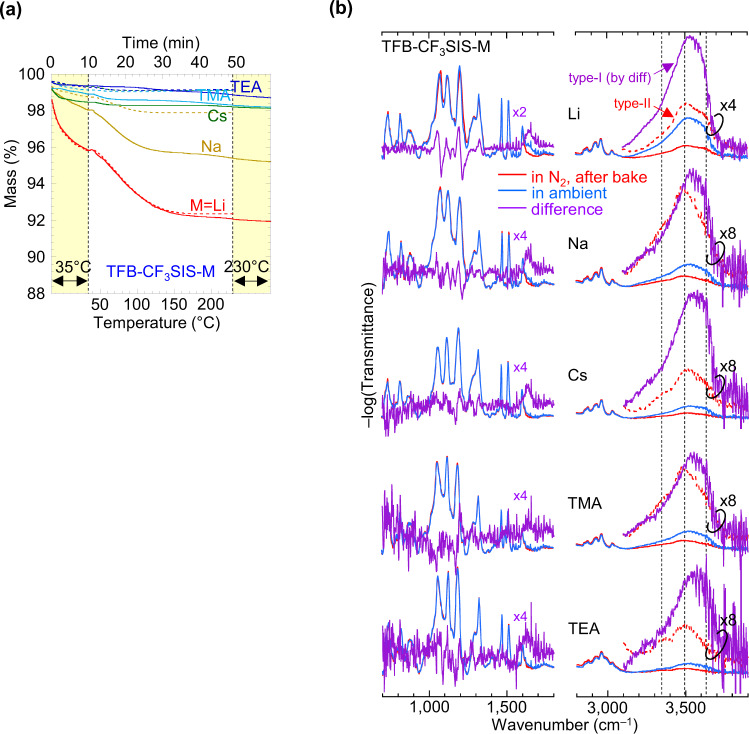
The presence of water strongly influences structure, dynamics and properties of ion-containing soft matter. Yet, the hydration of such matter is not well understood. Here, we show through a large study of monovalent π-conjugated polyelectrolytes that their reversible hydration, up to several water molecules per ion pair, occurs chiefly at the interface between the ion clusters and the hydrophobic matrix without disrupting ion packing. This establishes the appropriate model to be surface hydration, not the often-assumed internal hydration of the ion clusters. Through detailed analysis of desorption energies and O-H vibrational frequencies, together with OPLS4 and DFT calculations, we have elucidated key binding motifs of the sorbed water. Type-I water, which desorbs below 50 °C, corresponds to hydrogen-bonded water clusters constituting secondary hydration. Type-II water, which typically desorbs over 50-150 °C, corresponds to water bound to the anion under the influence of a proximal cation, or to a cation‒anion pair, at the cluster surface. This constitutes primary hydration. Type-III water, which irreversibly desorbs beyond 150 °C, corresponds to water kinetically trapped between ions. Its amount varies strongly with processing and heat treatment. As a consequence, hygroscopicity-which is the water sorption capacity per ion pair-depends not only on the ions, but also their cluster morphology.


Conflict of interest statement

The authors declare no competing interests.

Figures

Fig. 1
Fig. 1. Water desorption thermogravimetry (TG) analysis.
a TG of mTFF-SO3-Na powder: first scan at 10 °C min–1 without equilibration in ambient; then repeat scans at 5, 2, 1 and 10 °C min–1 sequentially after 1-h equilibration in the ambient (22 °C, 65–70% RH) in-between scans. b Derivative thermograms of (a). c, d Segmented TG of mTFF-SO3-Na powder, and mTFF-C2F5SIS-Na powder, respectively. Legend for (c) and (d): solid line, first scan; dashed line, second scan, each after equilibration in the ambient. All thermograms were conducted in flowing nitrogen. Water desorption before first data point causes it to start below 100% mass. The hydration number nw, defined as H2O per ion pair, is given for each step.
Fig. 2
Fig. 2. Characteristics of hydrated polyelectrolytes.
a Histogram of desorption midpoint temperatures for type-II and type-III water. b Plots of type-I and type-II hydration numbers (nw, in H2O/ion pair) against type-I hygroscopicity index, defined to be 1 for PSSNa. Type-I nw are shown for three relative humidity (RH) values; type-II nw is independent of RH. Polyelectrolytes: 1, TFB-CF3SIS-TMA; 2, TFB-NMe3-TfO; 3, p-doped mTFF-C2F5SIS-Na; 4, TFB-CF3SIS-Cs; 5, TFB-CF3SIS-Na; 6, mTFF-CF3SIS-Na; 7, PSSNa; 8, mTFF-C2F5SIS-Na; 9, TFB-CF3SIS-Li; 10, mTFF-SO3-Na; chemical structures in Supplementary Table 1. c Histograms of type-II and type-III nw for different polyelectrolyte families, before and after bake at 230 °C. All datasets from Supplementary Table 1.
Fig. 3
Fig. 3. Desorption kinetics analysis for an mTFF-SO3-Na sample.
Plots of remaining water fraction α against time t, plots of ln(‒dα/dt) vs ln(α); and plots of ln(‒d(lnα)/dt) vs 1/T, for a type-I, b type-II, and c type-III water, to extract the apparent kinetic order n and activation energy Ea. Symbols, data; lines, guide-to-the-eye or linear fits.
Fig. 4
Fig. 4. OPLS4 molecular snapshots of (2M+ –A-(CH2)7-A)8 (H2O)n hydrated ion cluster models for (M+, A).
a (Na+, SO3), b (TMA+, SO3), c (Na+, C2F5SIS), and d (TMA+, C2F5SIS). Atom legend: red, O; yellow, S; white, H; grey, C; violet, Na; blue, N. Atoms are shown in space-filling view to visualize the cation–anion framework at the ion cluster surface; water molecules in skeleton view and coloured for different binding motifs. Legend: red, α-binding, i.e., bonded to anion; orange, β-binding, i.e., bridging two anions; green, δ-binding, i.e., bonded to cation–anion pair; violet, χ-binding, i.e., bonded to cation; blue, water molecule in secondary hydration. MD production run: 4 ns at 300 K.
Fig. 5
Fig. 5. Selected water binding motifs in (M+ X)r (H2O)p hydrated ion multiplets.
Methodology: Geometry optimization and energy minimization by DFT/CAM-B3LYP/6-31 + + G(d,p). Bonded distance given in Å from water to: anion (blue dashed line), cation (orange) and H-bonded water (green), with water molecules numbered. Atom legend: violet, Li, Na or K; red, O; yellow, S; blue, N; cyan, F; grey, C; white, H. Full set in Supplementary Figs. 2–4. The H…O distance in H-bonded water dimer is 1.89 Å at this level of theory.
Fig. 6
Fig. 6. Water binding energies to cation‒anion pairs at PM3 level.
Water molecule singly H-bonded to anion {CH3SO3 (red), CF3SO3 (yellow), (CF3SO2)2N (green)} under influence of cations {Li+, Na+, K+, TMA+, TEA+ and TPP+} giving different water oxygen–cation distances d. Methodology: Difference of internal energies of formation before and after removal of the water molecule, for geometry optimization at PM3 level. Blue line is empirical fit to: ΔUo = A + B * d–2, with A = 0.22 eV and B = 2.5 eV Å2. The locations of water–cation contact distances given by DFT are marked by dashed lines.
Fig. 7
Fig. 7. Computed νOH wavenumber correlation chart for water molecules.
Hydrogen-bond character labels: ‘D’ denotes H-bond donor; ‘A’, H-bond acceptor. Wavenumber ranges: saturated colour and black bands for strong infrared absorptions; tinted colour and grey bands for weak absorptions. Water cluster data from Ref. . Water bonded to ion-multiplet data from present work: DFT/CAM-B3LYP/6-31 + + G(d,p), with wavenumber scaling: ν = ν’ * (1.184 – 0.00006 ν’), where ν’ is the DFT frequency. The wavenumber of ‘free’ νOH redshifts significantly with van der Waals interaction in condensed phase. Yellow and magenta colourations are guide-to-the-eye.
Fig. 8
Fig. 8. Vibrational spectroscopy of mTFF-SO3-Na film undergoing a dehydration–rehydration cycle.
a Transmission FTIR spectra collected in an optical-access flow-through cell: (red) after exposure to ambient air, (orange) in situ after 15 min in flowing nitrogen, (green) after 15-min bake at 230 °C in nitrogen and cooling to room temperature, and (blue) in situ after 5-min exposure to ambient air. b Difference spectra in the 1000–1700-cm–1 region. c Gaussian curve-fitted FTIR νOH envelope of (a). d Gaussian curve-fitted Raman νOH envelope. Raman spectroscopy was performed in backscattering geometry on Si wafer mounted on hot stage, with excitation wavelength of 514 nm. Films were cast from acetonitrile solution. Atmospheric contribution by H2O and CO2 to FTIR spectra, and fluorescence contribution by glass to Raman spectra, were removed by subtraction.
Fig. 9
Fig. 9. Thermogravimetry and infrared spectroscopy of TFB-CF3SIS-M.
a Segmented TG of powders, at 5 °C min−1. b FTIR spectroscopy of films baked in dry nitrogen, and after exposure to ambient air. Methodology: Films were baked on hotplate at 180 °C in nitrogen glovebox, and spectra collected in N2 (red lines); then films were equilibrated in ambient air, and spectra collected in ambient air (blue). Difference spectra are shown in violet on expanded scale, together with the spectra in N2 (red dashed lines). The vertical black dashed lines mark the νOH components for type-II water in the samples, at 3350, 3500 and 3630 cm‒1.
Fig. 10
Fig. 10. Schematic illustration of internal and surface hydration models for embedded ion clusters.
a Internal hydration model, and b surface hydration model. Cartoon is drawn for the moderate hydration regime. Circles with “‒” represent anions, “+” represent cations; coloured circles with filled ellipses represent water molecules (where orientation of the ellipse suggests orientation of H atom). Water molecules are nearly spherical with van der Waals radius of 1.4 Å. For polyelectrolytes with large cation‒anion pairs, α binding under the influence of proximal cation crosses over to δ binding.

References

    1. Nalwa, H. S. (ed.) Handbook of Polyelectrolytes and Their Applications. (American Scientific Publishers, 2002).
    1. Rembaum, A. & Sélégny, E. (eds.) Polyelectrolytes and their Applications. (Springer, 2012).
    1. Quatarone E, Mustarelli P. Electrolytes for solid-state lithium rechargeable batteries: recent advances and perspectives. Chem. Soc. Rev. 2011;40:2525–2540. doi: 10.1039/c0cs00081g. - DOI - PubMed
    1. Choudhury S, et al. Solid-state polymer electrolytes for high-performance lithium metal batteries. Nat. Commun. 2019;10:4398. doi: 10.1038/s41467-019-12423-y. - DOI - PMC - PubMed
    1. Baskoro F, Wong HQ, Yen HJ. Strategic structural design of a gel polymer electrolyte toward a high efficiency lithium-ion battery. ACS Appl. Energy Mater. 2019;2:3937–3971. doi: 10.1021/acsaem.9b00295. - DOI