. 2023 Jul 5;14(1):3966.
doi: 10.1038/s41467-023-39591-2.

UHRF1 is a mediator of KRAS driven oncogenesis in lung adenocarcinoma

Affiliations

UHRF1 is a mediator of KRAS driven oncogenesis in lung adenocarcinoma

Kaja Kostyrko et al. Nat Commun. .

Abstract

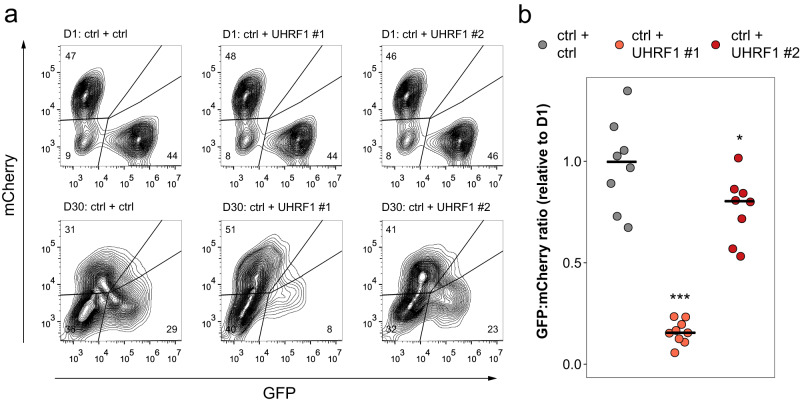
KRAS is a frequent driver in lung cancer. To identify KRAS-specific vulnerabilities in lung cancer, we performed RNAi screens in primary spheroids derived from a Kras mutant mouse lung cancer model and discovered an epigenetic regulator Ubiquitin-like containing PHD and RING finger domains 1 (UHRF1). In human lung cancer models UHRF1 knock-out selectively impaired growth and induced apoptosis only in KRAS mutant cells. Genome-wide methylation and gene expression analysis of UHRF1-depleted KRAS mutant cells revealed global DNA hypomethylation leading to upregulation of tumor suppressor genes (TSGs). A focused CRISPR/Cas9 screen validated several of these TSGs as mediators of UHRF1-driven tumorigenesis. In vivo, UHRF1 knock-out inhibited tumor growth of KRAS-driven mouse lung cancer models. Finally, in lung cancer patients high UHRF1 expression is anti-correlated with TSG expression and predicts worse outcomes for patients with KRAS mutant tumors. These results nominate UHRF1 as a KRAS-specific vulnerability and potential target for therapeutic intervention.


Conflict of interest statement

A.C. is a founder, equity holder, and consultant of DarwinHealth Inc., a company that has licensed some of the algorithms used in this manuscript from Columbia University. Columbia University is also an equity holder in DarwinHealth Inc. The remaining authors declare no competing interests.

Figures

Fig. 1
Fig. 1. Loss of Uhrf1 inhibits 3D growth of primary mouse NSCLC spheroids.
a Schematic representation of the pooled RNAi screens in primary spheroids and LKR10 cells. b Plot of shRNAs depleted from the cell population between T2 and T1 in primary mouse spheroids (y-axis) and murine LKR10 cells grown as monolayers (x-axis). Change in shRNA representation is shown as log2 fold change (log2FC). Uhrf1-specific shRNAs are indicated in red.
Fig. 2
Fig. 2. CRISPR/Cas9 knock-out of UHRF1 inhibits 3D growth of KRAS-dependent human lung cancer cells.
a Representative western blot images showing loss of the UHRF1 protein with CRISPR/Cas9 knock-out of the UHRF1 gene. Safe-cutting control sgRNA indicated with -, two sgRNAs against UHRF1 indicated with #1 and #2. Cell lines with a KRAS mutation indicated in red, KRAS wild-type cell lines in gray font. The experiment was repeated six times. b Representative images of GFP-expressing spheroids from three NSCLC cell lines (H2009, H358, H1437) and one HBEC cell line (NL20) expressing Cas9 and the indicated sgRNAs. Control - safe-cutting control sgRNA, UHRF1 #1 – UHRF1 sgRNA #1, and UHRF #2 – UHRF1 sgRNA #2. The experiment was repeated seven times. c Quantification of sphere number (left) and size (right) in KRAS mutant (H23, H358, H2009, A549) and KRAS wild-type (H1568, H1437, H1299) cell lines. Bars represent means, points represent n = 12 (KRAS mutant cells) or n = 8 (KRAS wild-type cells) individual biological replicates; *p < 0.05, ***p < 0.001, ns - not significant by anova followed by Dunnett’s multiple comparisons test between the indicated UHRF1 sgRNA and the control sgRNA. d Correlation between sphere numbers (left) and size (right) with UHRF1 knock-out and viability with KRAS knock-out. Correlation coefficient and p-value computed using Pearson’s product-moment correlation test. Linear trend lines were generated using a linear model, shaded confidence regions represent CI = 0.95. Source data are provided as a Source data file.
Fig. 3
Fig. 3. Loss of UHRF1 leads to apoptosis in cells expressing oncogenic KRAS cells.
a Flow cytometry of KRAS mutant (H2009) and KRAS wild-type (H1437) cells expressing Cas9 and transduced with lentiviral vectors expressing the indicated sgRNAs. Cells were co-stained with Annexin V-APC and propidium iodide (PI). b Quantification of apoptosis in a panel of lung cancer cell lines. Red bars – KRAS mutant cells (H2009, H358, H23); gray bars – KRAS wt cells (H1568, H1437, H1299). Bars represent means of n = 3 of biological replicates; **p = 0.007954, ***p = 0.000206, not significant (ns) p > 0.05 by anova followed by Dunnett’s multiple comparisons test between the indicated UHRF1 sgRNA and the control sgRNA. c Images of spheroids from H358 cells expressing Cas9 and the indicated sgRNAs treated with either DMSO or 4 nM of Sotorasib. d Quantification of spheroid area in two cell lines (left – H358, right – A549) expressing Cas9 and the indicated sgRNAs. Cells were treated with DMSO, 10 nM of DNMT1i GSK3685032, 4 nM of Sotorasib, 3 nM of MEKi Trametinib, or 15 nM of PI3Ki Copanlisib. Bars represent mean of n = 4 (H358 sgNeg+DMSO, H358 sgUHRF1+DMSO), n = 3 (A549 sgNeg+DMSO, A549 sgUHRF1+DMSO), or n = 1 biological replicates (all remaining conditions) performed in n = 3 technical replicates. Bars represent means and are presented as fold change relative to control (sgNeg); *p < 0.05, **p < 0.01, ***p < 0.001, ns - not significant by unpaired two-sided Student’s t test. Source data are provided as a Source data file.
Fig. 4
Fig. 4. UHRF1 loss leads to re-expression of tumor suppressor genes.
a Hierarchical clustering of differentially methylated regions in two KRAS mutant NSCLC cell lines (H358, A549) transfected with siRNAs against UHRF1, KRAS, or a negative control siRNA (siNeg). b Gene set enrichment analysis (GSEA) using GO terms, KEGG and Reactome gene sets on CpGs differentially methylated between cells treated with siUHRF1 compared to control cells. Plots show the top aggregated pathways enriched in hypomethylated genes (“down”) ranked by gene ratio (gene/total gene) for a given pathway. c Hierarchical clustering of differential gene expression in two KRAS mutant NSCLC cell lines (H358, A549) transfected with siRNAs against UHRF1, KRAS, or siNeg. d Volcano plot of differential gene expression between siUHRF1 and siNeg in two KRAS mutant NSCLC cell lines (H358, A549). Green points – examples of significantly overexpressed tumor suppressor genes (TSGs), blue point – UHRF1 and KRAS. e Venn diagrams of significantly (FDR < 0.05) downregulated (left) or upregulated (right) genes in cell treated with siUHRF1 or siKRAS. Both up- and downregulated genes show significant overlap (p < 0.00001, hypergeometric test) between siUHRF1 and siKRAS. f Venn diagram of tumor suppressor genes (TSGs) hypomethylated with siUHRF1 (EPIC methylation array dataset) and TSGs upregulated with siUHRF1 (RNAseq dataset) in A549 and H358 cells.
Fig. 5
Fig. 5. CRISPR screen for UHRF1-dependent tumor suppressor genes.
a Screen setup in A549 Cas9-expressing cells. b Screen results in control (sgNeg, left) cells and UHRF knock-out cells (sgUHRF1, right). Genes ranked by increasing z-score. Genes labeled in green – positive control, blue – UHRF1 and DNMT1, red – statistically significant hits (p-value < 0.05). In red frames – genes with positive effect on growth in UHRF1 knock-out cells but with negative or no effect in control (sgNeg) cells. c Scatterplot of z-scores in control (sgNeg) samples versus z-scores in UHRF1 knock-out (sgUHRF1) samples. Green – positive control genes, blue – UHRF1 and DNMT1, red – genes with p-value < 0.05 in UHRF1 knock-out cells. d Venn diagram of positive hits identified in sgUHRF1 and in sgNeg conditions (excluding control genes). Only hits with p-value < 0.05 were included. Hits in UHRF1-depleted cells are listed. e RNA expression of four UHRF1-specific tumor suppressor genes identified in the minipool CRISPR screen in two KRAS mutant cell lines (red bars – H358, A549) and two KRAS wild-type cell lines (gray bars – H1437, NL20) treated with control (siNeg) or UHRF1 siRNA (siUHRF1). Expression of UHRF1 is shown as control of knock-down efficiency. Bars represent mean fold expression of the indicated gene in siUHRF1-treated cells relative to cells treated with a negative control siRNA (siNeg); error bars represent standard deviation; points represent technical replicates (n = 3) from two biological replicates. f Plots show probes in the EPIC methylation array with statistically significant hypomethylation (adjusted p-value < 0.05) in regions related to the promoter (annotated as promoter-associated, 5′ UTR, 3′ UTR, TSS, and/or related to the 1st exon of the gene). The y-axis represents beta values color-coded by siRNA treatment (blue – siUHRF1, gray – siNeg). Shape of the data points represents cell line. Source data are provided as a Source data file.
Fig. 6
Fig. 6. Uhrf1 is essential for tumor growth in a mouse model of Kras-driven lung cancer.
a, b H&E images of representative tumor-bearing lungs from UKP and KP mice (a) and UK and K mice (b). c Quantification of tumor burden from the (U)KP (left) and (U)K (right) cohort. Horizontal lines represent mean values with one standard deviation error bars. Significance is calculated using two-sided unpaired Student’s t test; **p = 0.0061, ***p = 0.0003. The experiment has been performed twice in (U)KP and once in (U)K mice. d Survival analysis of KP (n = 18), U + /-KP (n = 14) and UKP mice (n = 17). Day 0 denotes the day of AdCre administration. Significance calculated using log-rang test, p = 3.4454e-07. e Immunohistochemistry for Uhrf1 expression in lung sections from representative KP (top) and UKP (bottom) mice. Arrows point to examples of Uhrf1-positive nuclei. Representative images of n = 7 (KP) and n = 16 (UKP) animals. f EdU and Uhrf1 co-immunostaining of a KP mouse tumor 11 weeks post Cre treated with EdU. Arrows point to a double-positive nucleus. g Quantification of Uhrf1 and EdU double-positive cells from EdU treated mice. Number of individual images quantified: n = 15 (KP, UKP), n = 5 (control no-virus mouse). Bars represent means with standard deviation error bars; *p = 0.031, **p = 0.0086, ns - not significant by Kruskal–Wallis test. h Western blot for UHRF1 protein expression in UKP mouse lung cancer cell line infected with the indicated adenovirus and control A549 cells treated with the indicated siRNAs. AdEmpty – empty adenovirus, AdCre – Cre-expressing adenovirus. The experiment was repeated twice. Source data are provided as a Source data file.
Fig. 7
Fig. 7. Loss of UHRF1 impairs tumor growth in a xenograft model of human KRAS mutant lung adenocarcinoma.
a Flow cytometry analysis of the in vivo competitive-growth assay in A549 xenografts. Top - day 1 cell populations, bottom – example of endpoint (day 30) tumor cell populations. b Fold change in GFP/mCherry ratio between A549 tumor cell populations at endpoint and day 1 (D1) cell populations; n = 8 individual tumors assessed for control (ctrl+ctrl) and sgUHRF1-2 (ctrl+UHRF1#2) arms, n = 9 individual tumors assessed for sgUHRF1-1 (ctrl+UHRF1 #1). Lines represent means; *p = 0.0234, ***p = 6.31e-10 by anova followed by Dunnett’s test between the indicated UHRF1 sgRNA and the control sgRNA. Source data are provided as a Source data file.
Fig. 8
Fig. 8. High UHRF1 expression is predictive of poor survival in human KRAS mutant lung adenocarcinoma.
a Kaplan–Meier plots of disease specific survival (DSS) in the lung adenocarcinoma (LUAD) cohort from TCGA. Blue solid line represents the normal UHRF1 expression group (expression <75th percentile) and red solid line represents the high UHRF1 expression group ( > 75th percentile). Left - KRAS mutant patients, HR = 2.85, p-value = 0.01; middle - KRAS wild-type patients, HR = 1.53, p-value = 0.092, right – distribution of UHRF1 log2 (CPM) counts by sample and color-coded by high or low group assignments based on 75th percentile. Two-tailed Student’s t test used to calculate the p-value. b Left pie chart – Correlation between UHRF1 expression and TSG expression. Right pie chart – Correlation between KRAS expression and expression of 323 TSGs (out of 450 TSGs anticorrelated with UHRF1) which significantly correlate with KRAS expression. Only significantly correlated TSGs (FDR < 0.05) were plotted for both datasets. Rho Direction: TSGs negatively (neg) or positively (pos) correlated with UHRF1 or KRAS expression. c Four examples of TSGs negatively correlated with UHRF1 in the LUAD dataset. Expression represented in log2 (CPM). Correlation coefficient and p-value computed using Spearman rank correlation test. Linear trend lines were generated using a linear model, shaded confidence regions represent CI = 0.95. d Kaplan–Meier plots of overall survival (OS) in the lung adenocarcinoma (LUAD) cohort from TCGA. Patient samples were divided based on the expression of 16 TSGs whose expression is anticorrelated with both UHRF1 expression and KRAS expression in the LUAD dataset samples. Blue solid line represents normal expression of the 16 TSGs (expression <75th percentile) and red solid line represents high expression (>75th percentile). Left - KRAS mutant patients, HR = 0.172, p-value < 0.001; right - KRAS wild-type patients, HR = 0.794, p-value = 0.357.

References

    1. Prior IA, Hood FE, Hartley JL. The frequency of Ras mutations in cancer. Cancer Res. 2020;80:2969–2974. - PMC - PubMed
    1. Ostrem JM, Peters U, Sos ML, Wells JA, Shokat KM. K-Ras(G12C) inhibitors allosterically control GTP affinity and effector interactions. Nature. 2013;503:548–551. - PMC - PubMed
    1. Skoulidis F, et al. Sotorasib for lung cancers with KRAS p.G12C mutation. N. Engl. J. Med. 2021;384:2371–2381. - PMC - PubMed
    1. Awad MM, et al. Acquired resistance to KRAS G12C inhibition in cancer. N. Engl. J. Med. 2021;384:2382–2393. - PMC - PubMed
    1. Liu J, Kang R, Tang D. The KRAS-G12C inhibitor: activity and resistance. Cancer Gene Ther. 2021;2021:1–4. - PubMed

Publication types

MeSH terms