. 2023 Jul 5;9(1):226.
doi: 10.1038/s41420-023-01507-w.

STAT3 and HIF1α cooperatively mediate the transcriptional and physiological responses to hypoxia

Affiliations

STAT3 and HIF1α cooperatively mediate the transcriptional and physiological responses to hypoxia

Alberto Dinarello et al. Cell Death Discov. .

Abstract

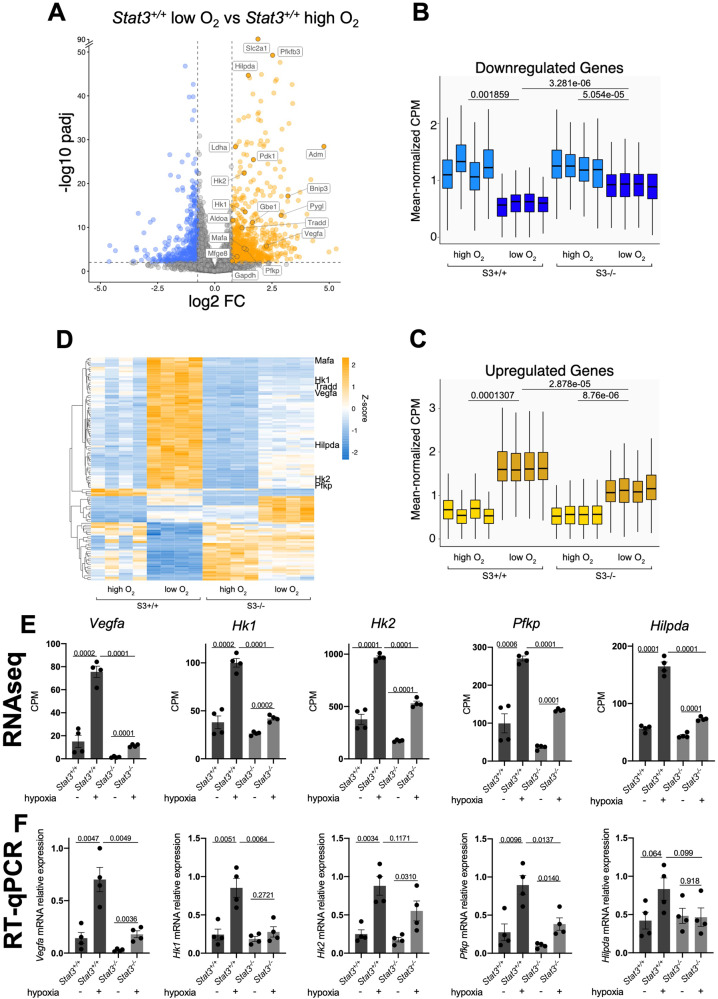
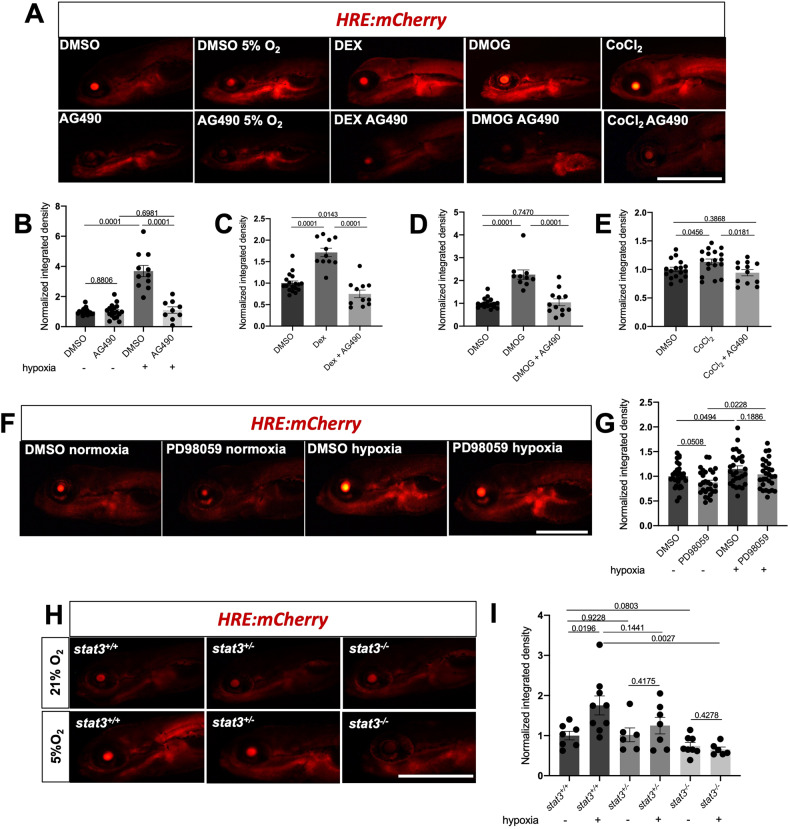
STAT3 and HIF1α are two fundamental transcription factors involved in many merging processes, like angiogenesis, metabolism, and cell differentiation. Notably, under pathological conditions, the two factors have been shown to interact genetically, but both the molecular mechanisms underlying such interactions and their relevance under physiological conditions remain unclear. In mouse embryonic stem cells (ESCs) we manage to determine the specific subset of hypoxia-induced genes that need STAT3 to be properly transcribed and, among them, fundamental genes like Vegfa, Hk1, Hk2, Pfkp and Hilpda are worth mentioning. Unexpectedly, we also demonstrated that the absence of STAT3 does not affect the expression of Hif1α mRNA nor the stabilization of HIF1α protein, but the STAT3-driven regulation of the hypoxia-dependent subset of gene could rely on the physical interaction between STAT3 and HIF1α. To further elucidate the physiological roles of this STAT3 non-canonical nuclear activity, we used a CRISPR/Cas9 zebrafish stat3 knock-out line. Notably, hypoxia-related fluorescence of the hypoxia zebrafish reporter line (HRE:mCherry) cannot be induced when Stat3 is not active and, while Stat3 Y705 phosphorylation seems to have a pivotal role in this process, S727 does not affect the Stat3-dependent hypoxia response. Hypoxia is fundamental for vascularization, angiogenesis and immune cells mobilization; all processes that, surprisingly, cannot be induced by low oxygen levels when Stat3 is genetically ablated. All in all, here we report the specific STAT3/HIF1α-dependent subset of genes in vitro and, for the first time with an in vivo model, we determined some of the physiological roles of STAT3-hypoxia crosstalk.


Conflict of interest statement

The authors declare no competing interests.

Figures

Fig. 1
Fig. 1. STAT3 regulates a subset of hypoxia-dependent genes.
AD Transcriptome analysis by RNA-seq. A: Genes that were differentially expressed (log2[fold change (FC)] > + 0.75 or <−0.75; q-value < 0.01, Benjamini–Hochberg adjustment, as indicated by dashed lines) between Stat3 +/+ cells in normoxia and Stat3+/+ cells in hypoxia; n = 4 biological replicates. Expression levels of genes that were down- (B) and upregulated (C) in Stat3 +/+ in hypoxia relative to Stat3+/+ cells in normoxia. Each boxplot shows the 1st, 2nd and 3rd quartiles; the whiskers show the minimum and maximum values. D heatmap of RNAseq data reporting the expression of genes that are affected by hypoxia in Stat3+/+ cells compared to Stat3+/+ normoxic cells, but that require STAT3 to be properly altered in their expression. E expression level of Vegfa, Hk1, Hk2, Pfkp and Hilpda in normoxic and hypoxic Stat3+/+ and Stat3−/− mESCs taken from RNAseq data. F Gene expression analysis by RT–qPCR of Stat3+/+ and Stat3−/− cells treated in normoxic and hypoxic mESCs of the same genes shown for the RNAseq. Mean ± SEM of n = 4 experiments, with each replica shown as a dot.
Fig. 2
Fig. 2. STAT3 physically interacts with HIF1α.
A RT-qPCR analysis of Hif1α mRNA expression on murine Stat3+/+ and Stat3−/− murine ESCs incubated either in low and in high oxygen tensions. B, C western blot analysis of HIF1α and STAT3 from protein extracts of Stat3+/+ and Stat3−/− murine ESCs incubated either in low and in high oxygen tensions. Representative pictures (B) and quantifications (C). β-Actin was used as an internal control. 3 independent biological replicates were used. D PLA with anti-STAT3 and anti-HIF1α antibodies. Scale bar = 200 μm. Quantification of dots divided for the number of nuclei detected with DAPI (blue). n = 3 independent biological replicas were used. Scale bar = 200 μm. Mean ± SEM.
Fig. 3
Fig. 3. Stat3 is necessary for Hif1α transcriptional activity.
A Representative pictures of HRE:mCherry reporter zebrafish treated with AG490 in combination with low oxygen tension, DMOG, and Dex from 3-6 dpf and CoCl2 from 5-6 dpf. Scale bar 500 μm. n = 18 DMSO normoxia, 11 DMSO hypoxia, 18 AG490, 9 AG490 hypoxia, 11 Dex, 11 Dex AG490, 12 DMOG, 12 DMOG AG490, 18 CoCl2, 12 CoCl2 AG490 (larvae used for this experiment came from three independent breeding between wild type zebrafish). B Fluorescence quantification of HRE:mCherry reporter zebrafish treated with AG490 in combination with low oxygen tension. C Fluorescence quantification of HRE:mCherry reporter zebrafish treated with AG490 in combination with 10 μM Dex. D Fluorescence quantification of HRE:mCherry reporter zebrafish treated with AG490 in combination with 50 μM DMOG from 3–6 dpf. E Fluorescence quantification of HRE:mCherry reporter zebrafish treated with AG490 in combination with 0.1 mM CoCl2 from 5-6 dpf. F, G Representative pictures and fluorescence quantification of HRE-mCHerry reporter zebrafish larvae treated with 12.5 μM PD98059 in combination with low oxygen tension. n = 31 DMSO normoxia, 29 PD98059 normoxia, 28 DMSO hypoxia, 29 PD98059 hypoxia (larvae used for this experiment came from three independent breeding between wild type zebrafish). Scale bar = 500 μm. H, I Representative pictures and fluorescence quantification of stat3+/+, stat3+/− and stat3−/− sibling larvae in HRE:mCherry transgenic background treated with low oxygen tension from 3–6 dpf. n = 7 stat3+/+ normoxia, 9 stat3+/+ hypoxia, 6 stat3+/− normoxia, 7 stat3+/− hypoxia, 8 stat3−/− normoxia, 6 stat3−/− hypoxia (larvae used for this experiment came from three independent breeding between stat3+/− zebrafish). Scale bar = 500 μm. Mean ± SEM.
Fig. 4
Fig. 4. Stat3 and Hif1α cooperate in the nucleus for the transcription of Hif1α target genes.
A, B Representative pictures and fluorescence quantification of 4-dpf HRE:mCherry reporter larvae treated with either DMSO or 50 μM AG490 for 24 h after injection of hif1ab DA mRNA. n = 3 independent biological replicates; 10 DMSO, 20 DMSO hif1ab DA mRNA, 19 AG490, 24 AG490 hif1ab DA mRNA (larvae used for this experiment came from three independent breeding between wild type zebrafish). Scale bar 500 μm. C RT-qPCR analysis of vegfa of 4-dpf larvae injected with hif1ab DA mRNA and treated with AG490 (n = 4 independent biological replicates composed by pool of 15 larvae, each dot represents a pool of larvae). D RT-qPCR analysis of hk1 of 4-dpf larvae injected with hif1αb DA mRNA and treated with AG490 (n = 4 independent biological replicates composed by pool of 15 larvae, each dot represents a pool of larvae). E RT-qPCR analysis of vegfa, hk1, egln3, and hif1αb on EGFP-positive and EGFP-negative cells sorted from SBE:EGFP transgenic adult intestines (three adult intestines were pooled together in two biological replicas). Mean ± SEM.
Fig. 5
Fig. 5. stat3 genetic ablation affects angiogenesis, and macrophage migration.
A, B Representative pictures and fluorescence quantification of the trunk of 54-hpf stat3+/+, stat3+/− and stat3−/− in Tg(Fli1:EGFP)y1 transgenic background incubated in normoxia and hypoxia for 6 h. Scale bar: 1 mm. n = 15 stat3+/+ normoxia; 17 stat3+/+ hypoxia; 21 stat3+/− normoxia; 20 stat3+/− hypoxia; 14 stat3−/− normoxia; 14 stat3−/− hypoxia (larvae used for this experiment came from three independent breeding between stat3+/− zebrafish). C, D Representative pictures and fluorescence quantification of the tail of 54-hpf stat3+/+, stat3+/− and stat3−/− larvae in Tg(gata1:dsRed)sd2 transgenic background incubated in normoxia and hypoxia. Scale bar: 1 mm. n = 18 stat3+/+ normoxia; 14 stat3+/+ hypoxia; 41 stat3+/− normoxia; 44 stat3+/− hypoxia; 17 stat3−/− normoxia; 20 stat3−/− hypoxia (larvae used for this experiment came from four independent breeding between stat3+/− zebrafish). E, F Representative pictures of 54-hpf control (ctrl inj) and hif1α morphants (MO-hif1α) in Tg(LysC:dsRed)nz50 transgenic background incubated in normoxia and hypoxia for 6 h (scale bar: 500 μm) quantification of the ratio of dsRed-positive cells in region A and in region B. Area B between dashed lines. Arrowheads point at fluorescent cells in Area A. n = 8 ctrl inj normoxia; 9 ctrl inj hypoxia; 7 MO-hif1α normoxia; 8 MO-hif1α hypoxia (larvae used for this experiment came from three independent breeding between wild type zebrafish) G, H Representative pictures of 54-hpf stat3+/+, stat3+/− and stat3−/− larvae in Tg(LysC:dsRed)nz50 transgenic background incubated in normoxia and hypoxia for 6 h (scale bar: 500 μm); quantification of the ratio of dsRed-positive cells in region A and in region B. Area B between dashed lines. Arrowheads point at fluorescent cells in Area A. n = 11 stat3+/+ normoxia; 16 stat3+/+ hypoxia; 22 stat3+/− normoxia; 23 stat3+/− hypoxia; 11 stat3−/− normoxia; 17 stat3−/− hypoxia (larvae used for this experiment came from three independent breeding between stat3+/− zebrafish). Mean ± SEM.

References

    1. Semenza GL. Hypoxia-inducible factors in physiology and medicine. Cell. 2012;148:399–408. doi: 10.1016/j.cell.2012.01.021. - DOI - PMC - PubMed
    1. Zhou W, Choi M, Margineantu D, Margaretha L, Hesson J, Cavanaugh C, et al. HIF1α induced switch from bivalent to exclusively glycolytic metabolism during ESC-to-EpiSC/hESC transition. EMBO J. 2012;31:2103–16. doi: 10.1038/emboj.2012.71. - DOI - PMC - PubMed
    1. Masson N, Ratcliffe PJ. HIF prolyl and asparaginyl hydroxylases in the biological response to intracellular O2 levels. J Cell Sci. 2003;116:3041–9. doi: 10.1242/jcs.00655. - DOI - PubMed
    1. Kaelin WG., Jr The VHL Tumor Suppressor Gene: Insights into Oxygen Sensing and Cancer. Trans Am Clin Climatol Assoc. 2017;2017:298–307. - PMC - PubMed
    1. Semenza GL. HIF-1 and mechanisms of hypoxia sensing. Curr Opin Cell Biol. 2001;13:167–71. doi: 10.1016/S0955-0674(00)00194-0. - DOI - PubMed