. 2023 Jul 5;14(1):3980.
doi: 10.1038/s41467-023-39659-z.

Structure of engineered hepatitis C virus E1E2 ectodomain in complex with neutralizing antibodies

Affiliations

Structure of engineered hepatitis C virus E1E2 ectodomain in complex with neutralizing antibodies

Matthew C Metcalf et al. Nat Commun. .

Abstract

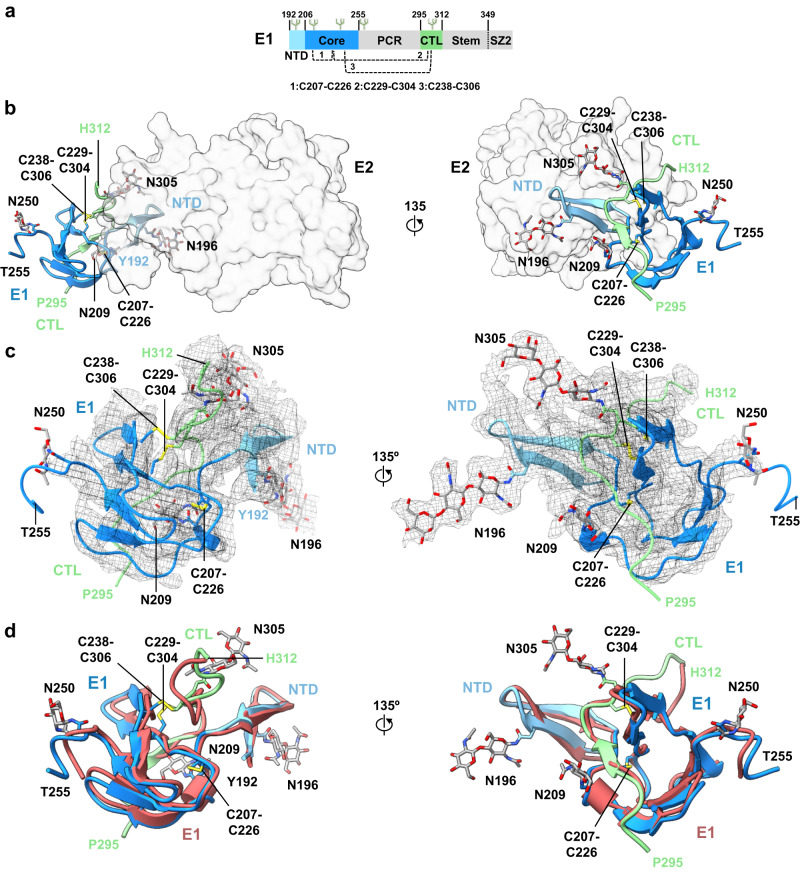
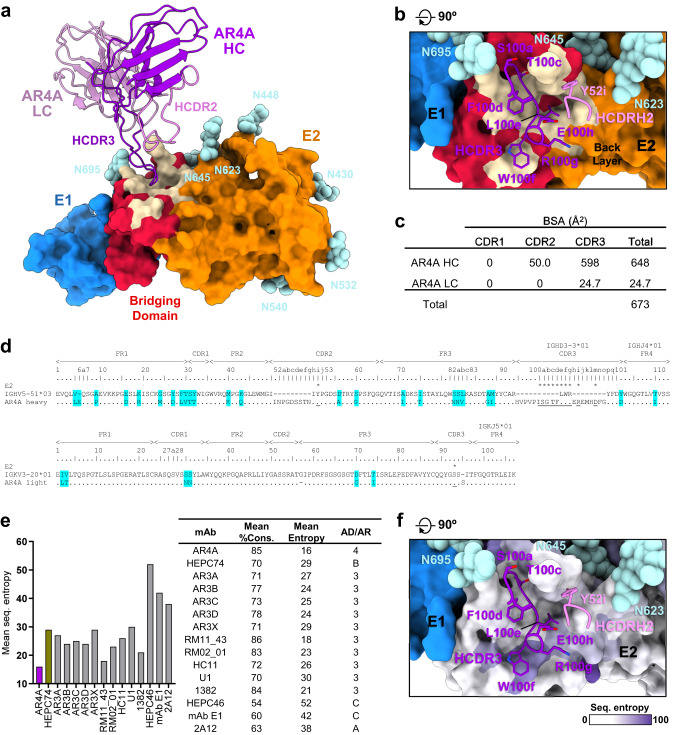
Hepatitis C virus (HCV) is a major global health burden as the leading causative agent of chronic liver disease and hepatocellular carcinoma. While the main antigenic target for HCV-neutralizing antibodies is the membrane-associated E1E2 surface glycoprotein, the development of effective vaccines has been hindered by complications in the biochemical preparation of soluble E1E2 ectodomains. Here, we present a cryo-EM structure of an engineered, secreted E1E2 ectodomain of genotype 1b in complex with neutralizing antibodies AR4A, HEPC74, and IGH520. Structural characterization of the E1 subunit and C-terminal regions of E2 reveal an overall architecture of E1E2 that concurs with that observed for non-engineered full-length E1E2. Analysis of the AR4A epitope within a region of E2 that bridges between the E2 core and E1 defines the structural basis for its broad neutralization. Our study presents the structure of an E1E2 complex liberated from membrane via a designed scaffold, one that maintains all essential structural features of native E1E2. The study advances the understanding of the E1E2 heterodimer structure, crucial for the rational design of secreted E1E2 antigens in vaccine development.


Conflict of interest statement

The authors declare the following competing interests: B.G.P., T.R.F., E.A.T., and J.D.G. are co-inventors on a pending patent application (US application 18/252800) filed by the University of Maryland based on the secreted E1E2 design used in this study. T.R.F. is a co-founder and holds stock in NeuImmune, Inc., a company focused on glycoprotein-based vaccines and therapeutics. All the other authors declare no competing interests.

Figures

Fig. 1
Fig. 1. Cryo-EM structure of HCV sE1E2.SZ ectodomain in complex with antibodies.
a Schematic representation of sE1E2.SZ heterodimer ectodomain. Respective leucine zipper SYNZIP (SZ) scaffolds, SZ1 and SZ2, are labeled along with disulfide bonds, N-linked glycans, and the furin cleavage site. b Overall cryo-EM structure of sE1E2.SZ (E1, blue; E2, orange) bound by antibodies AR4A (heavy chain, purple; light chain, pink) and HEPC74 (heavy chain, green; light chain, light green). HC heavy chain, LC light chain. c 3.65 Å cryo-EM map used for structure determination. d Structure of E2 (orange) shown against a surface representation of E1 (blue). e Structure of E1 (blue) rotated by 180° relative to (d) and shown against a surface representation of E2 (orange). N-linked glycans are colored gray.
Fig. 2
Fig. 2. Structural features of E2.
a Schematic representation of E2 colored by subregion. Listed subregions include the front layer (FL, residues 420–458), variable region 2 (VR2, residues 459–483), β-sandwich core (residues 484–517 and 535–568), CD81 binding loop (CD81 BL, residues 518–534), variable region 3 (VR3, residues 569–579), post-variable 3 region (pVR3, residues 580–595), back layer (BL, residues 596–645), and the bridging (or base) domain (BD, residues 646–701). b Cryo-EM density for bridging domain, shown in 180° orientations. c Surface representation of E2 colored by subregion, shown in 90° orientations. The bridging domain and AR4A HCDR3 loop apex are shown in cartoon representation, red and purple, respectively, with surface representations of E1 shown in gray (left). d Cartoon representation of E2 colored by subregion as in (c) (left) and rotated 180° (right). N-linked glycans and disulfides are shown as gray sticks and yellow spheres, respectively.
Fig. 3
Fig. 3. Structural features of E1.
a Schematic representation of E1 colored by subregion. Listed subregions include the N-terminal domain (NTD, residues 192–205), E1 core (residues 206–255 and 295–299), pFP-containing region (PCR, residues 256–298), C-terminal loop (CTL, residues 300–314), and stem (residues 315–351). Regions that were not resolved in the structure are depicted in gray. b E1 structure colored by subregion and shown against a semi-transparent surface representation of E2 (light gray), shown in 135° orientations. c Cryo-EM map density for E1 structure shown in same orientations as in (b). d Overlay of E1 structure (colored and oriented as in (b)) against an AlphaFold2-generated E1 model (raspberry). N-linked glycans and disulfide bonds are shown as gray and yellow sticks, respectively.
Fig. 4
Fig. 4. E1E2 interface.
a Surface representation of the sE1E2.SZ heterodimer, middle panel, with 90° open-book views of E1 (left, blue) and E2 (right, orange). E1 and E2 interface residues are colored gray and yellow, respectively. b Depiction of the sE1E2.SZ heterodimer as in (a), with surfaces colored by electrostatic potential. c Depiction of the sE1E2.SZ heterodimer as in (a), with surfaces colored by Shannon sequence entropy, scaled on a gradient from 0 (conserved, white) to 100 (variable, purple). d E1 N-linked glycans, N196 and N305, that form part of the interface with E2 are shown in cyan sticks along with their respective footprints on E2, yellow. e E1 and E2 subregion sequence alignments across HCV genotypes. Sequence Weblogo, scaled sequence entropy, and interface buried surface areas (BSA) at each residue position are plotted above. E1, blue bars; E2, orange bars; BSA contributions of N-linked glycans are shown as light green bars. The GT.1b sequence represents isolate 54-v03 (1b09), which was structurally characterized in this study. Raw sequence entropies were calculated in units of nats. Source data are provided as a Source Data file.
Fig. 5
Fig. 5. Structural basis for breadth of AR4A recognition.
a Surface representation of sE1E2.SZ bound by AR4A variable region (cartoon). Molecules are colored as in Fig. 1, with the bridging domain colored red and the AR4A epitope on E2 colored wheat. N-linked glycans are shown as cyan spheres. b Closeup view of AR4A epitope on E2, rotated by 90° relative to (a). AR4A HCDR3 and HCDR2 residues that interact with E2 are shown as sticks and colored purple and magenta, respectively. c AR4A heavy chain (HC) and light chain (LC) paratope buried surface areas (BSA), parsed by CDR. d Sequence alignment of AR4A heavy and light chains against their respective germline precursors. Residues that interact with E2 are labeled with asterisks and underlined, and somatically matured residues are shaded cyan. e Weighted mean scaled Shannon sequence entropy and mean percent sequence conservation of structurally characterized antibody epitopes that target E2 (antigenic domains, AD; antigenic regions, AR). f Closeup view of AR4A epitope on E2, rotated by 90° relative to (a), with the E2 surface colored by residue sequence entropy on a scale from 0 (conserved, white) to 100 (variable, purple). AR4A residues are depicted as in (b). Raw sequence entropies were calculated in units of nats. Source data are provided as a Source Data file.
Fig. 6
Fig. 6. Glycan shield and antigenic targets.
a Surface representation of sE1E2.SZ with bound AR4A and HEPC74 variable regions (cartoon), shown in three orientations and colored as in Fig. 1 with N-linked glycans shown as cyan spheres. b Sequence entropy mapped onto the surface of sE1E2.SZ, scaled on a gradient from 0 (conserved, white) to 100 (variable, purple), shown in the same orientations as in (a). c Mapped footprints of antibodies AR4A (purple), HEPC74 (green), and collectively of antibodies that target the neutralizing face (gray), antigenic domain C (salmon), and antigenic domain A (pink), shown in same orientations as in (a) with N-linked glycans colored cyan. d Contribution of E2 N-linked glycan N695 (cyan) to the interface with antibody AR4A, with closeup view shown. e Contribution of E2 N-linked glycans N430 and N448 to the interface with HEPC74, with closeup view shown. HC heavy chain, LC light chain, AD antigenic domain. Source data are provided as a Source Data file.

References

    1. WHO. Hepatitis C Key Facts (WHO, 2022).
    1. Bailey JR, Barnes E, Cox AL. Approaches, progress, and challenges to hepatitis C vaccine development. Gastroenterology. 2019;156:418–430. doi: 10.1053/j.gastro.2018.08.060. - DOI - PMC - PubMed
    1. Bartenschlager R, et al. Critical challenges and emerging opportunities in hepatitis C virus research in an era of potent antiviral therapy: considerations for scientists and funding agencies. Virus Res. 2018;248:53–62. doi: 10.1016/j.virusres.2018.02.016. - DOI - PubMed
    1. Cox AL. Challenges and promise of a hepatitis C virus vaccine. Cold Spring Harb. Perspect. Med. 2020;10:a036947. doi: 10.1101/cshperspect.a036947. - DOI - PMC - PubMed
    1. Khan AG, et al. Structure of the core ectodomain of the hepatitis C virus envelope glycoprotein 2. Nature. 2014;509:381–384. doi: 10.1038/nature13117. - DOI - PMC - PubMed

Publication types