. 2023 Jul 5;13(1):10835.
doi: 10.1038/s41598-023-37140-x.

Multi-landmark alignment of genomic signals reveals conserved expression patterns across transcription start sites

Affiliations

Multi-landmark alignment of genomic signals reveals conserved expression patterns across transcription start sites

Jose M G Vilar et al. Sci Rep. .

Abstract

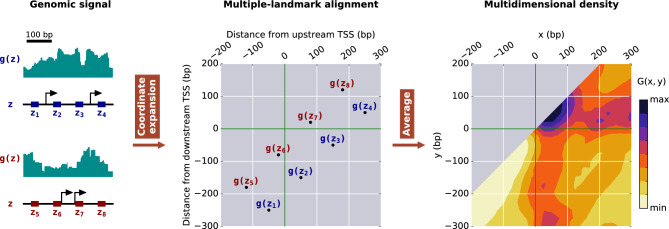
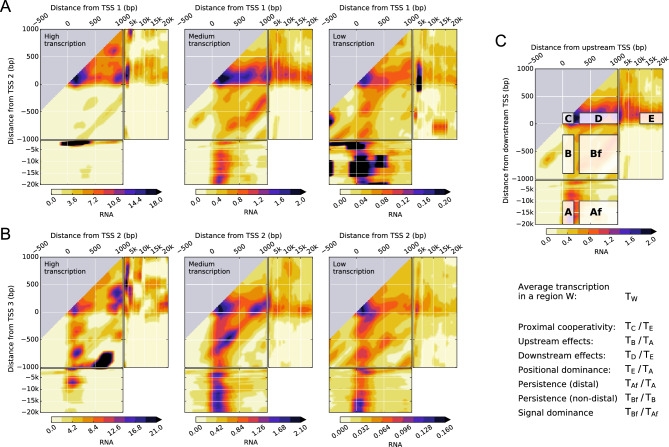
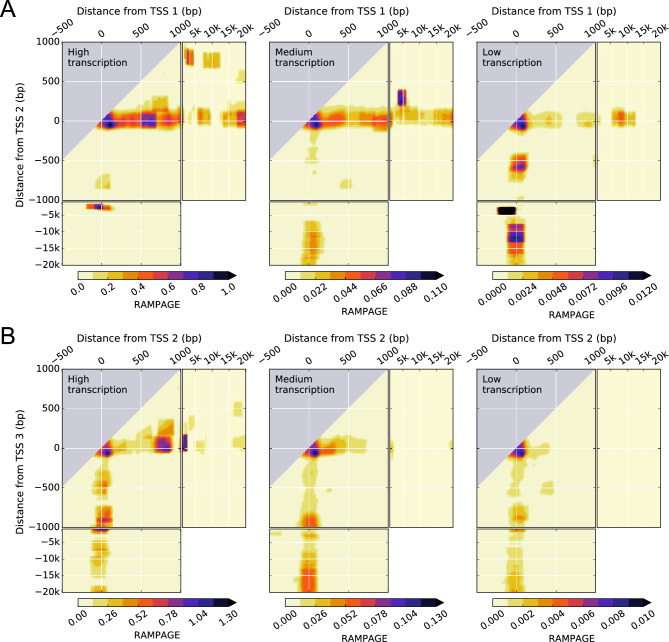
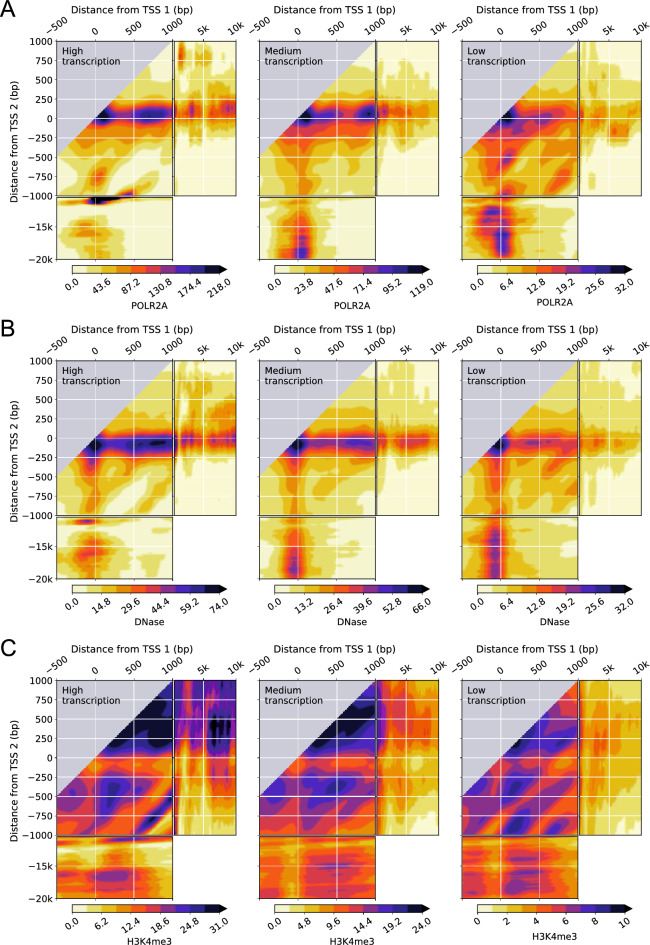
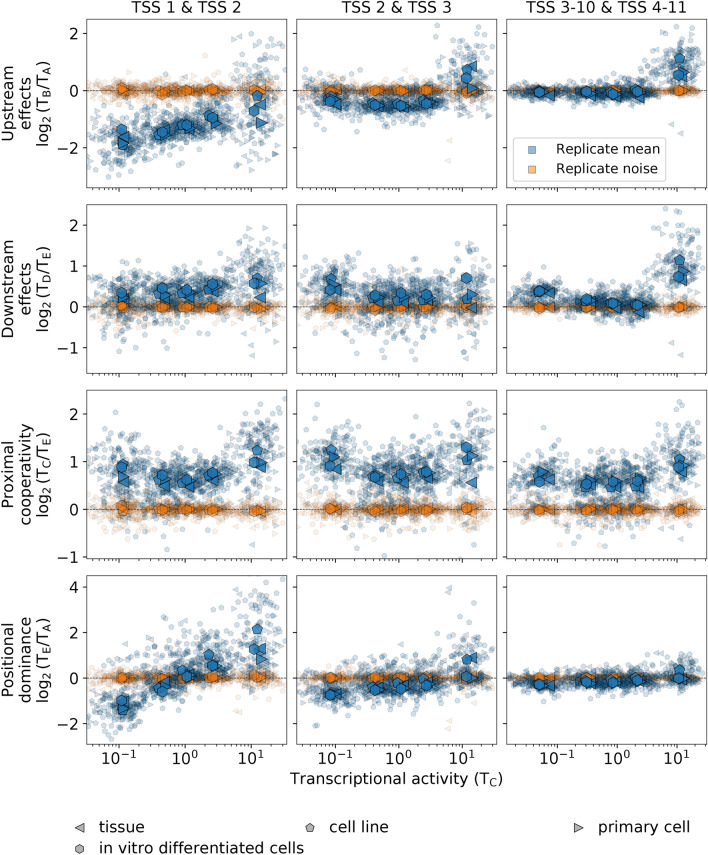
The prevalent one-dimensional alignment of genomic signals to a reference landmark is a cornerstone of current methods to study transcription and its DNA-dependent processes but it is prone to mask potential relations among multiple DNA elements. We developed a systematic approach to align genomic signals to multiple locations simultaneously by expanding the dimensionality of the genomic-coordinate space. We analyzed transcription in human and uncovered a complex dependence on the relative position of neighboring transcription start sites (TSSs) that is consistently conserved among cell types. The dependence ranges from enhancement to suppression of transcription depending on the relative distances to the TSSs, their intragenic position, and the transcriptional activity of the gene. Our results reveal a conserved hierarchy of alternative TSS usage within a previously unrecognized level of genomic organization and provide a general methodology to analyze complex functional relationships among multiple types of DNA elements.


Conflict of interest statement

The authors declare no competing interests.

Figures

Figure 1
Figure 1
Constructing multidimensional representations of genomic signals. Starting with a genomic signal gz along the genomic coordinate z, we perform a coordinate expansion using multiple landmarks, such as TSSs (depicted by black arrows), to obtain a multiple-landmark alignment of the signal. For pairs of landmarks, genomic locations in the neighborhood of two landmarks, such as those in the intervals z1-z4 and z5-z8, are mapped into a two-dimensional representation with respect to the distances from each of the landmarks. Taking the average of gz in the expanded space in windows centered at x,y=z-zU,z-zD for all the relevant pairs of landmarks zU,zD provides a multidimensional signal density, depicted by Gx,y in two dimensions.
Figure 2
Figure 2
Transcription in K562 leukemia cell lines shows a complex dependence on the distance from pairs of TSSs, their intragenic position, and the transcriptional activity of the gene. (A, B), two-dimensional density of normalized RNA-seq signal for pairs of the first (TSS 1) and second (TSS 2) TSSs (A) and the second (TSS 2) and third (TSS 3) TSSs (B) of genes with high, medium, and low levels of transcription. (C), seven representative regions of the two-dimensional (density) signal used to characterize the interdependence on pairs of TSSs. TSSs are ordered according to their genomic position. Regions A and B correspond to transcription at the upstream TSS (0x200) when the downstream TSS is far away (-20ky-10k) and at an intermediate distance (-900y-200), respectively. Regions Af and Bf correspond to transcription at intermediate distances from the upstream TSS (300x1k) when the downstream TSS is far away (-20ky-10k) and at an intermediate distance (-900y-200), respectively. Regions C, D, and E correspond to transcription at the downstream TSS (0y200) when the upstream TSS is nearby (0x200), at an intermediate distance (300x1k), and far away (10kx20k), respectively. For the quantification of proximal, intermediate, and distal effects between TSSs, we define the average transcription TW in a given region W as TW=gx+zUδy,x+zU-zDzU,zD,x,y with x,yW (see “Materials and Methods” section). Selecting W as one of the representative regions leads to the definitions of proximal cooperativity as TC/TE; upstream effects as TB/TA; downstream effects as TD/TE; positional dominance as TE/TA; persistence with a distal downstream TSS as TAf/TA; persistence with a non-distal downstream TSS as TBf/TB; and signal dominance as TBf/TAf. Data is available from the ENCODE consortium (experiment accession number ENCSR000AEL, Thomas Gingeras lab, CSHL). The accession numbers of the minus and plus strand RNA-seq signals and gene quantifications are ENCFF652ZSN, ENCFF091RAW, and ENCFF782PCD, respectively.
Figure 3
Figure 3
Transcription initiation in K562 leukemia cell line shows a complex dependence on the distance from pairs of TSSs, their intragenic position, and the transcriptional activity of the gene. (A, B), two-dimensional density of RAMPAGE signal for pairs of the first (TSS 1) and second (TSS 2) TSSs (A) and the second (TSS 2) and third (TSS 3) TSSs (B) of genes with high, medium, and low levels of transcription. Data is available from the ENCODE consortium (experiment accession number ENCSR000AER, Thomas Gingeras lab, CSHL). The accession numbers of the minus and plus strand RAMPAGE signals and gene quantifications are ENCFF198YEH, ENCFF707TAV, and ENCFF782PCD, respectively.
Figure 4
Figure 4
RNA polymerase II occupancy, DNA accessibility, and H3K4me3 epigenetic chemical modification of the histone H3 protein in K562 leukemia cell lines shows a complex dependence on the distance from pairs of TSSs and the transcriptional activity of the gene. (A, B, C), two-dimensional density of POLR2A ChIP-seq signal (A), DNase-seq signal (B), H3K4me3 ChIP-seq signal (C) for pairs of the first (TSS 1) and second (TSS 2) TSSs of genes with high, medium, and low levels of transcription. Data is available from the ENCODE consortium (experiment accession numbers ENCSR000FAJ, Sherman Weissman lab, Yale; ENCSR000EKS, Gregory Crawford lab, Duke; ENCSR000AKU and Bradley Bernstein, Broad). The accession numbers of the POLR2A ChIP-seq signal, DNase-seq signal, H3K4me3 ChIP-seq signal, and gene quantifications are ENCFF000YWY, ENCFF000SVL, ENCFF000BYB, and ENCFF782PCD, respectively.
Figure 5
Figure 5
The complex interdependence of transcription at multiple TSSs is conserved across human cell types. The replicate mean and noise of the log2 values of upstream effects, downstream effects, proximal cooperativity, and positional dominance are shown in terms of the transcriptional activity in region C stratified in five groups for the first and second TSSs, for the second and third TSSs, and for the average of all subsequent pairs of consecutive TSS up to the 10th and 11th TSSs for all experiments in ENCODE with Spearman correlation > 0.8 among replicates. In total, there are 191 experiments (indicated by small symbols) comprising 122 different cell types. Different symbols indicate different biosample types, which include primary cell (62 experiments), cell line (93 experiments), tissue (27 experiments), and in vitro differentiated cells (9 experiments). Large symbols indicate the average of experiments within a biosample type. The replicate mean, represented in blue color, corresponds to the average of the log2 values of two replicates [i.e., 1/2log2TC1/TA1+log2TC2/TA2, where the superscript indicates the replicate number]. The replicate noise, represented in orange color, corresponds to the difference of the log2 value of replicate 1 from the replicate mean [i.e.,1/2log2TC1/TA1-log2TC2/TA2]. Data is available from the ENCODE consortium (Brenton Graveley lab, UConn; Eric Lécuyer lab, IRCM; Michael Snyder lab, Stanford; and Thomas Gingeras lab, CSHL). For ENCODE accession numbers, see Table S1.
Figure 6
Figure 6
Transcription initiation parallels the conserved interdependence patterns of transcription at multiple TSSs. The same quantities as in Fig. 5 are shown computed with RAMPAGE data instead of with RNA-seq data. In total, there are 65 experiments comprising 56 different cell types, which include, as biosample types, primary cell (11 experiments), cell line (25 experiments), tissue (24 experiments), and in vitro differentiated cells (5 experiments). Data is available from the ENCODE consortium (Thomas Gingeras lab, CSHL). For ENCODE accession numbers, see Table S2.
Figure 7
Figure 7
The complex interdependence of transcription between multiple TSSs is conserved across human cell types. The replicate mean and noise of the log2 values of transcription persistence with a distal downstream TSS, persistence with a non-distal downstream TSS, signal dominance, and persistence dominance are shown in terms of the transcriptional activity in region C for the same cases and conditions as in Fig. 5.

References

    1. Mayer A, et al. Native elongating transcript sequencing reveals human transcriptional activity at nucleotide resolution. Cell. 2015;161:541–554. doi: 10.1016/j.cell.2015.03.010. - DOI - PMC - PubMed
    1. Ernst J, et al. Mapping and analysis of chromatin state dynamics in nine human cell types. Nature. 2011;473:43–49. doi: 10.1038/nature09906. - DOI - PMC - PubMed
    1. Rhee HS, Pugh BF. Comprehensive genome-wide protein-DNA interactions detected at single-nucleotide resolution. Cell. 2011;147:1408–1419. doi: 10.1016/j.cell.2011.11.013. - DOI - PMC - PubMed
    1. Kuscu C, Arslan S, Singh R, Thorpe J, Adli M. Genome-wide analysis reveals characteristics of off-target sites bound by the Cas9 endonuclease. Nat. Biotechnol. 2014;32:677–683. doi: 10.1038/nbt.2916. - DOI - PubMed
    1. Andersson R, et al. An atlas of active enhancers across human cell types and tissues. Nature. 2014;507:455–461. doi: 10.1038/nature12787. - DOI - PMC - PubMed

Publication types