. 2023 Jul 5;13(1):10882.
doi: 10.1038/s41598-023-37760-3.

Persistent homological cell tracking technology

Affiliations

Persistent homological cell tracking technology

Haruhisa Oda et al. Sci Rep. .

Abstract

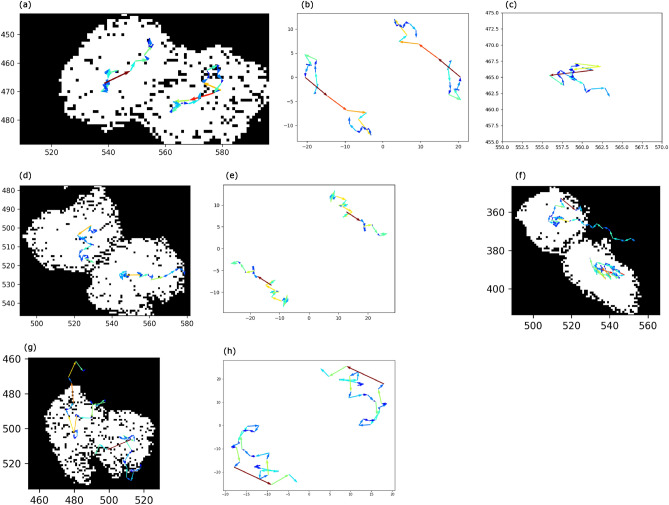
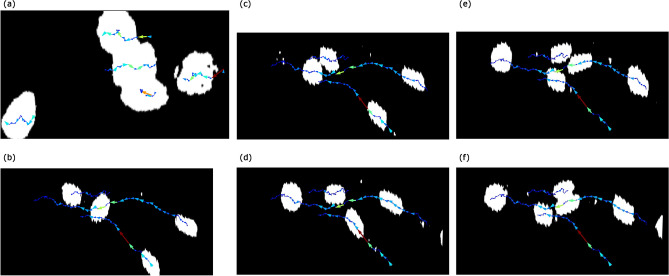
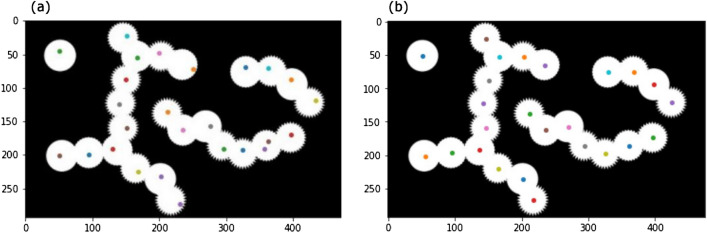
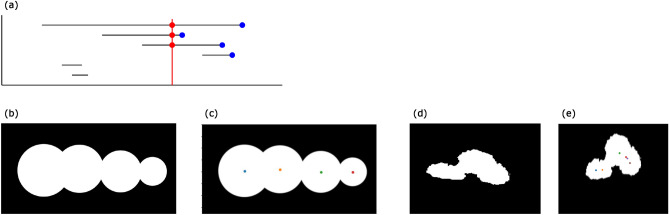
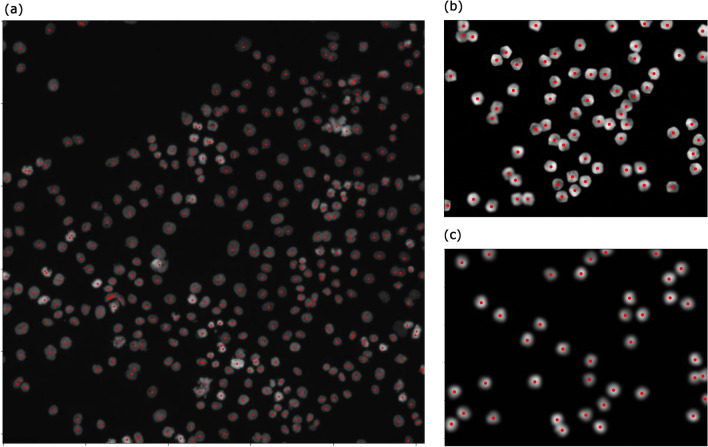
In this paper, we develop a cell tracking method based on persistent homological figure detection technology. We apply our tracking method to 9 different time-series cell images and extract several kinds of cell movements. Being able to analyze various images with a single method allows researchers to systematically understand and compare different tracking data. Persistent homological cell tracking technology's 9 parameters all have clear meanings. Thus, researchers can decide the parameters not by black box trial-and-error but by the purpose of their analysis. We use model data with ground truth to see our method's performance. We compare persistent homological figure detection and cell tracking technology with Image-Pro, sure-foreground in watershed method, and cell detection methods in previous studies. We see that there are some cases where Image-Pro's tracking stops and requires manual plots, while our method does not require manual plots. We show that our technology includes sure-foreground and has more information, and can be applied to different types of data that previously needed different methods. We also show that our technology is powerful as a detection technology by applying the technology to 5 different types of cell images.


Conflict of interest statement

The authors declare no competing interests.

Figures

Figure 1
Figure 1
(a) The analysis of cell movements. Persistent homological cell tracking technology can detect the rotation movement of two cells. The velocities of cells get larger at the time of rotation. (b) The movements from the barycenter. We can see the rotation movement clearly in this data. (c) The movement of the barycenter. (d) The analysis of cell movements. The left cell moves down and the right cell moves right, resulting in a rotation-like movement. (e) The movements observed from the barycenter. This shows a rotation-like movement. (f) The analysis of cell movements. The left cell moves left and then changes its direction to the right. The right cell does not move very much. (g) The analysis of cell movements. The movement of the cells might not be obvious from this image. (h) The movements from the barycenter. If we observe the movements from the barycenter, the rotation movements become clear.
Figure 2
Figure 2
(a) The analysis of cell movements. If we focus on the three overlapping cells in the center, the upper cell is moving forward, while the center cell is moving backward. The lower cell is not moving very much. (b), (c), (d), (e), (f) The result of tracking four cells. The leftmost cell in (b) is overtaken by the second left cell in (c) and then overtaken by the other 2 cells in (d), (e), and (f). The rightmost cell in (b) moves forward to get near the place where the second left cell existed in (b). Also, the rightmost cell in (f), which is not tracked here, follows the trajectory of the rightmost cell in (b).
Figure 3
Figure 3
The comparison between barycenter and circumcenter. We use the model image in Oda. (a) If we use barycenter for the plots, then some points are plotted far from the center of the figures. (b) If we use circumcenter for the plots, the plotted points are close to the center of the figures.
Figure 4
Figure 4
(a) The comparison between watershed and persistent homological figure detection. Watershed can be thought of as drawing a vertical line on persistent barcodes and counting the number of intersections (red points). Persistent homological figure detection detects the barcodes whose death points (right ends) are greater than or equal to the threshold value (blue points). (b) The model image of 4 overlapping figures. If we use watershed, the rightmost figure disappears before the left two figures are divided into two connected components. Thus, we cannot detect four figures in this image using watershed. (c) The result of detecting figures with persistent homological figure detection. We can detect four figures in the model image. (d) The image of 3 overlapping cells. If we use watershed, the leftmost cell disappears before the right two cells are divided into two connected components. Thus, we cannot detect three cells in this image using watershed. (e) The result of detecting figures with persistent homological figure detection. We can detect three cells in the image.
Figure 5
Figure 5
(a) Figure 2 in Meijering. (b), (c) The result of detecting cells in the leftmost and rightmost images in (a). Although we sometimes overcount or ignore a figure which is at the edge of the image and much of which cannot be seen, we can detect other figures successfully. This shows that persistent homological figure detection technology can be applied to different images which previously needed different detection technologies.
Figure 6
Figure 6
(a) The result of detecting cell nuclei in the first image in the image set BBBC001v1 from the Broad Bioimage Benchmark Collection. We detected more cells than the suggested manual counts. A cell in the bottom left part of the image is obviously overcounted. This is because of the distorted shape of the cell. However, we do not find other obvious overcounts. The programs might be detecting overlapping cells in more detail than humans. (b) The result of detecting cell nuclei in SIMCEPImages_A17_C70_F1_s09_w1.tif from the image set BBBC005v1 from the Broad Bioimage Benchmark Collection. We successfully counted 70 cells. (c) The result of detecting cell nuclei in SIMCEPImages_G10_C40_F20_s09_w1.tif from the image set BBBC005v1 from the Broad Bioimage Benchmark Collection. We successfully counted 40 cells.

References

    1. Meijering E. Cell segmentation: 50 years down the road. IEEE Signal Process. Mag. 2012;29:140–145. doi: 10.1109/MSP.2012.2204190. - DOI
    1. Takubo N, et al. Cohesive and anisotropic vascular endothelial cell motility driving angiogenic morphogenesis. Sci. Rep. 2019;9:9304. doi: 10.1038/s41598-019-45666-2. - DOI - PMC - PubMed
    1. Ljosa V, Sokolnicki KL, Carpenter AE. Annotated high-throughput microscopy image sets for validation. Nat. Methods. 2012;9:637. doi: 10.1038/nmeth.2083. - DOI - PMC - PubMed
    1. Oda H. Counting and detecting figures using persistent homology. JSIAM Lett. 2023;15:33–36. doi: 10.14495/jsiaml.15.33. - DOI
    1. Collins A, Zomorodian A, Carlsson G, Guibas LJ. A barcode shape descriptor for curve point cloud data. Comput. Graph. 2004;28:881–894. doi: 10.1016/j.cag.2004.08.015. - DOI

Publication types