. 2023 Jul;619(7970):563-571.
doi: 10.1038/s41586-023-06271-6. Epub 2023 Jul 5.

A rise-to-threshold process for a relative-value decision

Affiliations

A rise-to-threshold process for a relative-value decision

Vikram Vijayan et al. Nature. 2023 Jul.

Abstract

Whereas progress has been made in the identification of neural signals related to rapid, cued decisions1-3, less is known about how brains guide and terminate more ethologically relevant decisions in which an animal's own behaviour governs the options experienced over minutes4-6. Drosophila search for many seconds to minutes for egg-laying sites with high relative value7,8 and have neurons, called oviDNs, whose activity fulfills necessity and sufficiency criteria for initiating the egg-deposition motor programme9. Here we show that oviDNs express a calcium signal that (1) dips when an egg is internally prepared (ovulated), (2) drifts up and down over seconds to minutes-in a manner influenced by the relative value of substrates-as a fly determines whether to lay an egg and (3) reaches a consistent peak level just before the abdomen bend for egg deposition. This signal is apparent in the cell bodies of oviDNs in the brain and it probably reflects a behaviourally relevant rise-to-threshold process in the ventral nerve cord, where the synaptic terminals of oviDNs are located and where their output can influence behaviour. We provide perturbational evidence that the egg-deposition motor programme is initiated once this process hits a threshold and that subthreshold variation in this process regulates the time spent considering options and, ultimately, the choice taken. Finally, we identify a small recurrent circuit that feeds into oviDNs and show that activity in each of its constituent cell types is required for laying an egg. These results argue that a rise-to-threshold process regulates a relative-value, self-paced decision and provide initial insight into the underlying circuit mechanism for building this process.


Conflict of interest statement

The authors declare no competing interests.

Figures

Fig. 1
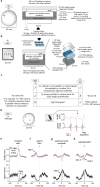
Fig. 1. oviDN [Ca2+] dips during ovulation, rises for seconds to minutes and peaks immediately before the abdomen bend for egg deposition.
a, Behavioural sequence of egg laying. b, Egg expressing GCaMP3 in the body. Steps correspond to a. Insets show close-ups, with over/undersaturated pixels in red/blue; main panels show over/undersaturated pixels in white/black. c, Behavioural progression. Lines connect single egg-laying sequences. d, Schematic of wheel. e, Single oviDNb traced from light microscopy images. Blue arrow indicates soma in brain, green arrow indicates outputs in the abdominal ganglion. f, oviDN somas on the right side of the brain labelled by oviDN-SS1. g, oviDN ∆F/F and behaviour during laying of two eggs by the same fly. ∆F/F is smoothed with a 2 s boxcar filter. Images are z-projection of selected imaging slices, with labels referring to oviDNa and oviDNb (oviDNa is partially obscured by oviDNb). h, Population-averaged oviDNb ∆F/F aligned to the end of the abdomen bend for egg laying. Light grey shading represents ±s.e.m. throughout; 43 imaging traces from 41 egg-laying events associated with nine cells in eight flies. The number of traces exceeds the number of egg-laying events because for two eggs we imaged oviDNb on both sides of the brain. Behavioural events shown below. i, Schematic of abdomen bend. θ denotes ‘body angle’ and length is neck–ovipositor distance. jl, Mean oviDN ∆F/F and behaviour aligned to events in h: ‘ovulation start’ (j), ‘search start’ (k) and completion of abdomen bend (l). ‘Normalized length’ is the length given in i divided by its median (Methods). Shorter, thicker arrows indicate when abdomen bend for egg deposition is complete. A subsequent (stronger) bend is, presumably, for cleaning the ovipositor. m, oviDN ∆F/F during individual egg-laying events, smoothed with a 5 s boxcar filter. Black line, mean. n, Mean oviDN ∆F/F during egg laying for all seven flies that laid three or more eggs, smoothed with a 5 s boxcar filter. A single GCaMP7b fly is shown in grey. NP, Nippon Project; Ave., average; 2-p, two-photon; Ephys, electrophysiology; Max., maximum.
Fig. 2
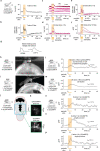
Fig. 2. Evidence for a threshold in the ability of oviDNs to trigger the egg-deposition motor programme.
a, oviDN ∆F/F and behaviour during high-intensity 5 s CsChrimson stimulation. ∆F/F is smoothed with a 2 s boxcar filter. b, High-intensity stimulations separated on the basis of whether ovulation was observed previously. Stimulations resulting in eggs were defined as those in which egg deposition occurred within 60 s of light onset. All four eggs without ovulation observed previously were from the first stimulation of a fly, and ovulation may have occurred before the session. c, Mean oviDN ∆F/F and behaviour for manually triggered, high-intensity stimulations that resulted in eggs. Light grey shading represents ±s.e.m. throughout. Behaviour, 32 stimulations in nine flies; ∆F/F, 18 stimulations in five flies. Differences in number of traces are explained in Methods. The peak in oviDN ∆F/F slightly lags behind initiation of the abdomen bend, potentially because [Ca2+] at the synaptic active zones rises faster than at the soma with optogenetic stimulation. d, Mean oviDN ∆F/F and behaviour for periodically triggered, high-intensity stimulations that did not result in eggs. Five of 88 stimulations that resulted in eggs are not shown so that changes independent of egg deposition could be analysed. e, Same as d but with flies not expressing CsChrimson (0 of 84 stimulations → eggs). f, oviDN ∆F/F during stimulation binned by maximum ∆F/F 1–3 s after start of stimulation. Four light intensities were triggered periodically. Stimulations were included regardless of whether egg deposition occurred (nine of 334 stimulations → eggs). The first and last bins include data below 0.02 and above 0.52, respectively. g,h, Change in mean body length (g) and body angle (h) for each of the bins in f. Mean behavioural signal 2–4 s after start of stimulation was subtracted from mean behavioural signal 0–2 s before stimulation. Two-sided Wilcoxon rank-sum test, P = 7.2 × 10–4 and 5.0 × 10–4. LED, light-emitting diode.
Fig. 3
Fig. 3. Flies search for an egg-deposition site with high relative value in the time period when the oviDN [Ca2+] signal rises.
a, Y position and egg-deposition events from a fly in a high-throughput egg-laying choice chamber. b, Fraction of eggs on the lower-sucrose option with 95% confidence interval. X axis indicates sucrose concentration (mM). One dot represents one fly. c, Eggs laid per fly. Mean ±s.e.m. indicated. One dot represents one fly. d, Each row represents a single egg-laying event in a 0 versus 500 mM sucrose chamber, aligned to egg deposition, with the fly’s speed indicated by colour intensity. Rows have been ordered based on the search duration; start of the search period is in magenta. Eighteen flies were tested, one of which did not lay eggs. e, Same data as in d, but the substrate on which the fly was residing is indicated by white and black pixels. fh, Mean egg-laying rate during the search period aligned to a transition from higher to lower sucrose (lighter blues) or lower to higher sucrose (darker blues) in three separate choice conditions (0 versus 500 mM (f), 0 versus 200 mM (g) and 200 versus 500 mM (h)), with 90% confidence intervals (Methods): 771 eggs from 17 flies (f, 18 flies tested of which one did not lay eggs), 1,863 eggs from 42 flies (g, 47 flies tested of which five did not lay eggs) and 1,345 eggs from 30 flies (h, 30 flies tested). Egg-laying rate requires around 10 s to reach maximum after a fly transitions to the higher-relative-value option, at least partially because flies do not lay eggs on the (approximately) 2.5 mm plastic boundary between substrates (Extended Data Fig. 7e,f) and because there is a delay of about 3 s between when the fly bends its abdomen and deposits the egg (Extended Data Fig. 7g and Fig. 1c). Thus, the fly’s internal sense of relative value probably changes more rapidly after a transition than the slowly increasing egg-laying-rate curve would suggest.
Fig. 4
Fig. 4. Relative value of the current egg-laying option influences the subthreshold physiology of oviDNs to impact when threshold is reached.
a, Schematic model relating oviDN signal to substrate decisions. b, Mean oviDN ∆F/F during substrate transitions. Light grey shading denotes ±s.e.m. throughout. In total, 2,459 and 2,460 traces from 70 cells in 53 flies (1,911 and 1,922 transitions); 1,911 transitions yielded 2,459 traces because we sometimes imaged oviDNb on both sides of the brain. c, Mean oviDN Vm during transitions; 74 and 72 traces from eight cells in eight flies (74 and 72 transitions). Traces were smoothed using a 666 ms boxcar filter to aid comparison to ∆F/F, which was acquired at around 1.5 Hz. d, Mean oviDN ∆F/F during transitions split based on the amount of time the fly spent on 500 mM before entering 0 mM; 1,197, 430, 637 and 176 traces from 70 cells in 53 flies (914, 347, 486 and 148 transitions, respectively). e, Mean oviDN ∆F/F for egg-laying events where the fly remained on 0 or 500 mM for the 80 s window before and including egg deposition. An increased ∆F/F baseline of roughly 0.02 exists for 0 mM before ovulation; 0 mM, 21 traces from five cells in five flies (21 eggs); 500 mM, nine traces from four cells in three flies (seven eggs). f, Probability densities of individual oviDN ∆F/F slopes from traces averaged in e. Individual ∆F/F values were smoothed with a 5 s boxcar filter before calculating the net slope from when ∆F/F first reached 0 after the signal minimum (which occurs during ovulation) to 3.3 s before abdomen bend was complete—which is when, on average, abdomen bend starts (Fig. 1l). P values were calculated using the two-sided Wilcoxon rank-sum test. For additional information on these calculations see Methods.
Fig. 5
Fig. 5. Gentle hyperpolarization of oviDNs increases search duration and results in more eggs laid on the preferred option.
ac, Eggs laid per fly (mean ± s.e.m.). Each dot represents one fly. Inhibition of oviDNs with Kir2.1 (a), GtACR1 (b), or Kir2.1* (c). d, oviDN (or oviDN-like neuron) Vm at rest (mean ± s.e.m.). Five cells in five flies and five cells in four flies, respectively. P value was calculated using two-sided Wilcoxon rank-sum test. e,f, oviDN-GAL4>Kir2.1*Mut (e) and oviDN-GAL4>Kir2.1* (f) flies. Each row represents a single egg-laying event in a 0 versus 200 mM sucrose chamber, aligned to egg deposition, with the fly’s speed indicated by intensity of black shading. Rows ordered based on the search duration; 1,377 eggs from 40 flies (45 flies tested, of which five did not lay eggs) and 346 eggs from 17 flies (40 flies tested, of which 23 did not lay eggs), respectively. g, Median duration of search for individual flies from e,f that laid five or more eggs. Mean ± s.e.m., P = 9.6 × 10–7. h, Fraction of time spent walking during non-egg-laying periods for flies shown in g. Non-egg-laying periods were defined as periods of over 10 min from egg deposition. i, Fraction of eggs on the lower-sucrose option with 95% confidence interval. Each dot represents one fly. Individual flies laid an average of 38, 38, 32, 16, six and seven eggs each. If the plot is reworked by examining only flies that laid at least five eggs, P = 1.9 × 10–6 (rather than 6.3 × 10–4) for the middle set of bars and is not significant (NS) for the others. gi, P values calculated using two-sided Wilcoxon rank-sum test. ci, Tubulin>GAL80ts was present in all flies, to limit the time window in which Kir2.1* or Kir2.1*Mut transgenes were expressed (Methods). The 18 °C control was not shifted to 31 °C before the assay and thus expression of Kir2.1* or Kir2.1*Mut was not induced. All egg-laying experiments were conducted at 24 °C.
Fig. 6
Fig. 6. An anatomically recurrent neuronal circuit whose activity is required for egg laying provides direct synaptic input to oviDNs.
a, Eggs laid per fly (mean ± s.e.m.). Each dot represents one fly and each pair of bars represents a split-GAL4 line (Supplementary Table 1). Estimate of number of pairs of oviDN input neurons and number of synapses onto oviDNs is explained in Methods. Labelling of oviENs in second split-GAL4 is stochastic (Extended Data Fig. 11b), explaining why some flies still lay eggs. b, Hemibrain-derived connectivity of indicated neurons on one side of the brain. Numbers adjacent to arrows indicate total synapse counts. Green arrows indicate excitatory (oviENs are cholinergic); black arrows are of unknown sign but are posited to be excitatory. Arrows drawn only if connection has more than two synapses. Arrows with filled arrowheads indicate that there exists a single neuron–single neuron connection with at least ten synapses. c, Recurrent-circuit neurons on the right side of the brain using Neuroglancer and the hemibrain connectome. d, Hemibrain-derived connectivity of indicated neurons on either side of the brain. Filled arrows indicate a single neuron–single neuron connection with at least ten synapses. X indicates that the diagrammed connection does not exist at a threshold of ten or more synapses. e, Hemibrain-derived connectivity. Green and black arrows are as in b, and red arrows are inhibitory (oviINs are GABAergic); arrows with filled arrowheads are as in b (see Supplementary Tables 3 and 4 for all synapse counts). Light blue circles represent three oviDNs on the right side and one on the left. Only one oviDN on the left side of the brain is annotated in the hemibrain, and was used to capture connectivity on that side. OviINs receive input from, and send output to, each individual neuron within the box. Arrow marked by * indicates that no individual group G (right) synapses onto oviIN (right) with ten or more synapses.
Extended Data Fig. 1
Extended Data Fig. 1. Free behavior chambers and characterization of the egg-laying behavioral sequence.
a, Schematic of free behavior egg-laying chamber with sloped ceiling. b, Schematic of high-throughput free behavior egg-laying choice chamber. c, Comparison of the two free behavior chamber types. d, Length (neck to ovipositor distance) and locomotor speed over 3 consecutive egg-laying events, smoothed with a 5 s boxcar filter, for a single fly in a sloped ceiling egg-laying chamber (Supplementary Video 2). e-h, Mean length and locomotor speed aligned to annotated events in the egg-laying behavioral sequence. Light grey shading is ± s.e.m. Prominent features of steps from Fig. 1a are labeled. These features (e.g., the pause or increase in locomotion) were not considered when annotating the event used for alignment.
Extended Data Fig. 2
Extended Data Fig. 2. Egg-laying wheel and tethered egg-laying behavioral sequence with oviDN [Ca2+].
a, Schematic of egg-laying wheel. b, Schematic of agarose-injecting mold, which is used to load agarose onto the wheel with a pipette. c, Schematic of egg-laying wheel assembly secured in a custom humidification chamber under the microscope objective. d, Fraction of eggs on the lower sucrose option for control substrates: colored dye infused substrates and 3D-printer material (VisiJet M3 Crystal) bases vs. acrylic bases. Error bars represent 95% confidence intervals. Each dot is one fly. These data suggest that the dyes and plastics involved in fabricating the egg-laying wheel should not cause abnormal substrate choice behavior. e, Fraction of eggs on the lower sucrose option for flies expressing GCaMP7f in oviDNs and by those pre-treated for tethered wheel experiments. Error bars represent 95% confidence intervals. Each dot is one fly. These data show that the flies we used in our imaging experiments exhibit normal substrate choice during free-behavior egg laying. f, Behavioral sequence of tethered egg laying as in Fig. 1a. Stills from a single egg-laying event. Overlaid and zoomed-in schematics of the tip of the abdomen from 3 frames is shown at the bottom right. g, Mean oviDN ∆F/F aligned to the moment abdomen bending to lay an egg is complete. 43 traces from 9 cells in 8 flies (41 eggs). Light grey shading is ± s.e.m. for all panels in this figure. Behavior shown below. h–n, Mean oviDN ∆F/F and behavior aligned to events in the behavioral sequence shown in panel g. Locomotor speed is smoothed with a 5 s boxcar filter. o, Mean oviDN ∆F/F aligned to when abdomen bend is complete with all data points before the start of the search omitted from the average.
Extended Data Fig. 3
Extended Data Fig. 3. Anatomy and physiology of different oviDN types.
a, Electron-microscopy (EM) skeletons and characterization of the 3 oviDN and 2 oviDN-like neurons per side. The branch labeled in grey is sometimes present in oviDNb and sometimes not (Fig. 1e). The 3 other arrows indicate neurites that are unique to either oviDNa or oviDNb. Visualization generated using Neuroglancer. Neuropil to left is only to schematize the approximate ROI shown in the EM. b, Average z-projection of oviDN-GAL4 in the brain (top) and ventral nerve cord (bottom). Green shows UAS-mCD8GFP expression in the targeted neurons and magenta represents a neuropil counterstain (Methods). c, Anatomy of oviDN-SS1 driving expression of GCaMP7f. The brighter of the two oviDN cell bodies was filled with Texas Red (Methods). The neurite labeled with a pink arrow in panel a was used to determine if the cell was oviDNb. All 6 of the brighter cells filled with Texas Red (from 6 separate flies) were oviDNb. Two examples are shown (representative individual z-slices). d, Mean oviDNa ∆F/F during individual egg-laying events. 29 traces from 7 cells in 6 flies (28 eggs). These data did not contribute to the traces in Fig. 1 (or any other figure), which were exclusively from oviDNb. Light grey shading is ± s.e.m. for all panels in this figure. e, Mean cross-correlation of ∆F/F between ipsilateral oviDNa and oviDNb cells imaged simultaneously. Traces from multiple, individual cell pairs are averaged. f, Mean cross-correlation of ∆F/F between contralateral oviDNb cells imaged simultaneously. Traces from multiple, individual cell pairs are averaged.
Extended Data Fig. 4
Extended Data Fig. 4. oviDN [Ca2+] traces from individual egg-laying events.
a, OviDN ∆F/F showing all individual traces that were averaged in Fig. 1h (43 imaging traces from 41 egg-laying events associated with 9 cells in 8 flies). Grey lines are individual traces smoothed with a 5 s boxcar filter. Black line is the average of the non-smoothed individual traces. b, Each row represents a single egg-laying event. Rows have been ordered based on the search duration. Individual traces are smoothed as in panel a and behavioral annotations are overlayed. Individual traces corresponding to Fig. 1g and Fig. 1m (fly 3) are highlighted. Individual eggs that are part of the analysis in Fig. 4e, f are marked with an asterisk. c, Same as panel b but with a colormap where white is centered on a ∆F/F of 0 which is the average baseline in our normalization (Methods). Individual traces tend to (1) dip below baseline during ovulation (blue color after light pink/magenta line); (2) return to baseline around the time of search start (white color near dark pink/purple line); and (3) increase past baseline around or after the search start (red color after dark pink/purple line). These trends are captured by the average analysis presented in Fig. 1j–l. d, Normalized oviDN ∆F/F showing all individual traces in Fig. 1h (43 imaging traces from 41 egg-laying events associated with 9 cells in 8 flies). Grey lines are individual traces smoothed with a 5 s boxcar filter and then normalized such that the maximum and minimum ∆F/F in the 100 s window preceding the abdomen bend are set to 1 and 0, respectively. Black line is the average of the smoothed individual traces. e, Same as panel b but displaying ∆F/F normalized as in panel d.
Extended Data Fig. 5
Extended Data Fig. 5. OviDN ∆F/F and fly behavior during non-egg-laying periods and during optogenetic stimulation.
a, Standard deviation of oviDN ∆F/F for all data points > 5 min. away from egg deposition, i.e., ‘non-egg-laying periods’. b, Example trace of wheel position and oviDN ∆F/F during a non-egg-laying period (smoothed with a 2 s boxcar filter). This cell had a standard deviation in ∆F/F of 0.15. c, Mean cross-correlation of oviDN ∆F/F versus varied behavioral measures during non-egg-laying periods. Light grey shading is ± s.e.m. for all panels in this figure. For sucrose concentration correlations, only 0 vs. 500 mM sucrose wheels were analyzed (excluding 0 mM only wheels, for example), leaving 53/104 flies for analysis. d, Same as panel c, but including time periods near egg deposition (~372 additional minutes—i.e., ~4% additional sample points—are included compared to panel c). e, Mean oviDN ∆F/F and behavior during peaks in ∆F/F that occurred in non-egg-laying periods. We smoothed the ∆F/F signal with a 5 s boxcar filter and extracted peaks in the ∆F/F trace that exceeded 0.35 for > 1 s. We aligned these traces to the moment the ∆F/F signal crossed 0.35 in the 10 s before the peak. f, Change in mean body angle, replotted from Fig. 2h. Arrow indicates first bin with an abdomen angle change greater than 2.5° (indicated by dotted line). g, Same as panel f but with coarser binning. h, i, Same as panel f but with finer binning. j-n, Same as panel f but bins are shifted progressively by 0.02 leftward. In panels f to n, the first and last bin always include all the data points below and above that bin, respectively. The curve in panel l appears less step-like than the others; however, it is expected that as one progressively shifts the center point of the bins, one will find a position where the central bin straddles the putative threshold, yielding an intermediate y value for that bin. The fact that panels k and m appear more step like supports this explanation for panel l. o, Example traces of oviDN ∆F/F during prolonged, gentle CsChrimson stimulation (protocol described in Methods), smoothed with a 2.5 s boxcar filter. Traces are clipped once they reach a ∆F/F of 0.275. We used 0.275 as the threshold because it is slightly higher than the center of the 4th bin in Fig. 2g, h (i.e., a conservative lower-bound estimate of the threshold). We use a conservative estimate for this analysis to capture as many relevant traces as possible. Note that for a variety of reasons, CsChrimson expressing flies may have a different threshold in terms of ∆F/F than flies not expressing CsChrimson (Methods). OviDN ∆F/F traces occasionally rise to threshold with this protocol. p, OviDN ∆F/F smoothed with a 2.5 s boxcar filter for all 27 stimulations (out of 127 total) that brought ∆F/F to threshold during the stimulation interval (the other 100 stimulations that did not bring ∆F/F to the threshold are not shown). The beginning of each trace is the beginning of stimulation. Colored lines are traces from panel o. A similar analysis in the inter-stimulation-interval (starting 10 s after the CsChrimson stimulation ended) only identifies 2 threshold crossing events indicating that the observed threshold crossing during stimulation was predominantly caused by the stimulation (data not shown). A similar analysis using data with the strongest 5 s stimulation intensity in Fig. 2f identifies 46 (out of 88 total) threshold crossing events indicating that is harder to achieve threshold crossing with the gentle prolonged stimulation despite the longer interval (data not shown). q, r, Change in mean body length and body angle for data shown in panel p, indicating that flies, on average, bend their abdomen proximal to the time of threshold crossing. s, Remaining ∆F/F until threshold is reached (y-axis) as a function of remaining time until threshold is reached (x-axis). The traces in panel p are sampled at 100 ms intervals to populate bin counts of the histogram. The negative correlation indicates that CsChrimson stimulation gradually brings the ∆F/F to threshold, rather than by inducing a spontaneous event, independent of the current ∆F/F, that brings ∆F/F to threshold.
Extended Data Fig. 6
Extended Data Fig. 6. [Ca2+] changes in the oviDN soma and presynaptic terminals lag changes in electrical activity.
a, Mean oviDN Vm during periodically triggered high-intensity 5 s CsChrimson stimulations. Light grey shading is ± s.e.m. for all panels in this figure. b, Mean oviDN spike rate during periodically triggered high-intensity 5 s CsChrimson stimulations. c, OviDN single-trial Vm traces during periodically triggered 5 s CsChrimson stimulations at four different intensities in the same fly. Intensities are the same as in Fig. 2f–h. Traces have been shifted on the y-axis for clarity, with –50 mV indicated for each trace (black arrowhead). d, Mean oviDN Vm during periodically triggered 5 s CsChrimson stimulations at four different intensities (same fly as panel c). e, Mean oviDN spike rate during periodically triggered 5 s CsChrimson stimulations at four different intensities (same fly as panel c). f, Mean oviDN ∆F/F during periodically triggered 5 s CsChrimson stimulations at four different intensities (same data as Fig. 2f). g, Graphical model of the link between voltage and calcium in oviDN somas using evidence from panels a to f. Increases in voltage lead to slower increases in calcium and decreases in voltage lead to slower decreases in calcium. To first order calcium ∆F/F signals appear to be a low-pass filtered, delayed version of the voltage changes observed. Since CsChrimson does not permeate calcium, changes in [Ca2+] observed during stimulation are likely due to opening of voltage-gated calcium channels. h, Preparation to image oviDN presynaptic terminals in the abdominal ganglion of the ventral nerve cord (Methods). i, Standard preparation for imaging the oviDN cell body in brain. j, Schematic (top view) of the holder in panel h. An outline of the hole in which the thorax, head, and anterior abdomen are inserted is shown in red. The dissected region is indicated in blue. A typical calcium imaging region is shown in green. k, Z-projections of representative calcium imaging regions. Compare to region indicated by green arrow in Fig. 1e. sytGCaMP7f, was used to bias GCaMP expression to presynaptic compartments for bulk imaging of presynaptic terminals. Note that sytGCaMP biases GCaMP expression to terminals, but not necessarily to active zones. Red arrow points to the punctum quantified in panel n. l, Mean oviDN ∆F/F in bulk presynaptic compartments during periodically triggered CsChrimson stimulation, using 2nd lowest intensity from panels c to f. A low stimulation intensity was applied such that subthreshold calcium accumulation could be investigated. Presynaptic compartments from oviDNa and oviDNb could not be distinguished and are thus averaged together. m, Mean oviDN ∆F/F in cell bodies during periodically triggered CsChrimson stimulation. To aide comparison with panel l, this experiment was done at a similar time, with similar conditions (Methods), and with ROIs encompassing both oviDNa and oviDNb cell bodies. n–p, Mean oviDN ∆F/F in selected single presynaptic compartments, from three different flies, during periodically triggered CsChrimson stimulation using the subthreshold intensity in panels l and m. ROIs were drawn around individual puncta in GCaMP7f expressing flies, which had a stronger florescence signal than sytGCaMP7f flies.
Extended Data Fig. 7
Extended Data Fig. 7. Evidence against flies using spatial information in substrate search and against a feeding-on-higher-sucrose related explanation for substrate preferences in our free behavior chambers, alongside controls for the egg-laying rate function.
a, Schematic of a fly searching for an egg deposition site in a 0 vs. 500 mM chamber. ∆T0mM and ∆T500mM are all the intervals of time that a fly spent on 0 or 500 mM, respectively, during an egg-laying search period. ∆Tlast_500mM is the last transit interval through 500 mM for eggs deposited on 0 mM. If a fly were positionally avoiding sucrose, ∆T500mM would be less than ∆T0mM. If a fly were to use spatial information during the search period—by taking a shortcut to get to the preferred 0 mM substrate at the end of a search—∆Tlast_500mM would be less than ∆T0mM and ∆T500mM. If a fly were feeding on the higher sucrose substrate—and pausing as flies do when they feed—∆T500mM would be larger than ∆T0mM. b-d, ∆Tlower_sucrose, ∆Thigher_sucrose, and ∆Tlast_higher_sucrose distributions for three different sucrose choice chambers. ∆Thigher_sucrose is not less than ∆Tlower_sucrose suggesting that flies are not positionally avoiding the higher sucrose option. ∆Tlast_higher_sucrose is not detectably smaller than ∆T0mM or ∆T500mM suggesting that flies are not taking a shortcut—and thus not manifesting use of spatial information—at the end of the search. It is possible that flies use spatial information to guide the search in conditions with visible landmarks or where they perform less thigmotaxis (edge-hugging); our flies largely edge-hugged as they traversed the chamber. All experiments in this study were conducted in darkness. Note that our time-domain model for egg laying (Fig. 4a) could be readily augmented with spatial knowledge in that flies could putatively use their spatial sense to control which substrate they visit which would then impact their egg-laying drive. ∆Thigher_sucrose is not larger than ∆Tlower_sucrose indicating that flies are not pausing only on the higher sucrose substrate. We interpret this result to mean that flies are not suppressing egg deposition because of extensive feeding on the sucrose substrates. In addition, we did not notice additional proboscis extension on higher sucrose when we spent hours inspecting each video to annotate the egg deposition times. Note that our flies were very well fed before entering the chamber, which could have minimized this effect (Methods). 771 eggs from 17 flies (18 flies tested and 1 did not lay eggs), 1863 eggs from 42 flies (47 flies tested and 5 did not lay eggs), and 1345 eggs from 30 flies (30 flies tested), respectively. e, Mean egg-laying rates during the search period after a fly transitions across the plastic barrier in a single-option chamber, meaning that there is either 0 mM sucrose on both sides, 200 mM sucrose on both sides, or 500 mM sucrose on both sides. 90% confidence interval shaded. Egg-laying rates on the three different sucrose concentrations are similar in single-option chambers. The slightly higher egg-laying rates on lower sucrose is consistent with a possible, slight, innate preference for lower sucrose, which interacts with a much more prominent relative-value assessment of sucrose that governs egg laying rates (Fig. 3f–h). 895 eggs from 23 flies (24 flies tested and 1 laid no eggs), 1253 eggs from 27 flies (27 flies tested), and 528 eggs from 16 flies (17 flies tested and 1 laid no eggs) for 0 vs. 0, 200 vs. 200, and 500 vs. 500 mM chambers, respectively. f, Mean egg-laying rate during the search after a fly transitions across a mock vertical line. 90% confidence interval shaded. Same data as in panel e. The 5–10 s bin in this analysis has a higher egg laying rate than in the analysis from panel e, suggesting that part of the delay in egg laying after a transition is due to flies not laying eggs on the plastic barrier. g, Mean locomotor speed with ± s.e.m. shaded. A ~3 s delay exists between when a fly pauses and bends its abdomen to lay an egg till when an egg is deposited. This ~3 s latency is at least part of the reason why even the data in panel f do not show high egg laying rates in the 0–5 s bin. Analyzing the same data as in panels e-f.
Extended Data Fig. 8
Extended Data Fig. 8. Changes in oviDN ∆F/F during substrate transitions are not due to consistent, detectable, changes in behavior.
a, We detected substrate crossing moments on the egg-laying wheel, and aligned behavioral data to these moments: 2459 and 2460 traces from 70 cells in 53 flies (1911 and 1922 transitions). Plotted here is the probability that a fly’s centroid is located > 2 mm away from the boundary between two substrates (y axis), as a function of time from the substrate crossing (x axis). For a 2.5 mm fly, not being in the 2 mm region surrounding the boundary corresponds to the front or back of the fly being 0.75 mm away from the midpoint of the 1 mm plastic barrier between substrates. These traces highlight that it takes flies ~10–20 s, on average, to completely cross the midline which is important to keep in mind when interpreting neural signals aligned to substrate crossing events. b, Mean neck to proboscis length during substrate transitions. Light grey shading is ± s.e.m. for all panels in this figure. c, Mean locomotor speed during substrate transitions. d, Mean body length during substrate transitions. e, Mean body angle during substrate transitions. f, Mean body length, body angle, and oviDN ∆F/F during the subset of substrate transitions where there was a small change in body length. The mean body length in the 4 s after and before a substrate transition were subtracted. If the absolute value of this difference was less than 0.01, then the change was considered small. g, Same as panel f, except selecting for substrate transitions where the difference was greater than 0.01. h, Same as panel f, except selecting for substrate transitions where the difference was less than −0.01. The sum of the number of traces in panels f-h is less than panel a because during some substrate transitions the body length and/or angle was not possible to accurately calculate using DeepLabCut (Methods). i–k, Same as panels f-h, except comparing body angle and using a threshold of 0.5°. Proboscis length and fly speed (panels b-c) do not consistently change during substrate transitions and therefore do not explain the changes in oviDN ∆F/F. Body length and body angle do change, on average, during substrate transitions (panels d-e). However, these changes cannot fully explain the changes in oviDN ∆F/F (panels f-k). That is, regardless of the change in body length or body angle, the oviDN ∆F/F consistently changes with sucrose concentration (albeit with some modulations related to body length and angle).
Extended Data Fig. 9
Extended Data Fig. 9. OviDN electrical activity during substrate transitions and additional evidence for oviDN ∆F/F tracking relative value during substrate transitions.
a, oviDN spike rate versus Vm at rest. b, Vm during two substrate transitions from the same fly. These sample traces have more pronounced Vm changes than is typical. c, Mean oviDN Vm after removal of spikes during substrate transitions (Methods). 74 and 72 traces from 8 cells in 8 flies (74 and 72 transitions). Light grey shading is ± s.e.m. for all panels in this figure. d, Mean oviDN spike rate during substrate transitions. e, Same as Extended Data Fig. 8a but for the behavior of the fly during this electrophysiology dataset. f, Mean oviDN ∆F/F during substrate transitions from 500 to 0 mM and 0 to 500 mM. 2459 and 2460 traces from 70 cells in 53 flies (1911 and 1922 transitions). g, Mean oviDN ∆F/F during substrate transitions from 500 to 200 mM and 200 to 500 mM. 167 and 170 traces from 5 cells in 3 flies (105 and 109 transitions). h, Mean oviDN ∆F/F during substrate transitions from 200 to 0 mM and 0 to 200 mM. 443 and 446 traces from 20 cells in 20 flies (443 and 446 transitions). In panels f-h, note that all changes are on the order of 0.05 ∆F/F regardless of the absolute sucrose concentration, consistent with a relative value calculation. i–k, Same as Extended Data Fig. 8a but for the behavior of the fly during the datasets in panels f-h, shown to the left.
Extended Data Fig. 10
Extended Data Fig. 10. Strong and gentle inhibition of oviDNs.
a-c, Eggs laid per fly. Each dot is one fly. ± s.e.m. indicated. d, The Vm of a single, representative oviDN (or oviDN-like neuron) expressing Kir2.1*Mut or Kir2.1* during current injection. Four out of five Kir2.1* expressing cells showed spikes with sufficient amounts of current injection; one cell did not (not shown). e, Mean locomotor speed aligned to egg deposition with ± s.e.m. shaded. A higher average speed before egg laying in oviDN>Kir2.1* flies is indicative of the longer search duration in these flies. However, other aspects like the pause to lay an egg and post-egg-laying speed remain similar in oviDN>Kir2.1*Mut and oviDN>Kir2.1* flies. 1377 eggs from 40 flies (45 flies tested and 5 laid no eggs), 346 eggs from 17 flies (40 flies tested and 23 laid no eggs) for oviDN>Kir2.1*Mut and oviDN>Kir2.1*, respectively. f, Normalized inter-egg interval histograms. 1340 intervals from 40 oviDN>Kir2.1*Mut flies (45 flies tested and 5 laid < 2 eggs and thus did not have at least one interval). 333 intervals from 15 oviDN>Kir2.1* flies (40 flies tested and 25 flies laid < 2 eggs and thus did not have at least one interval). Note that the similar inter-egg interval distribution for oviDN>Kir2.1* and control flies does not mean that oviDN>Kir2.1* flies searched for the same amount of time for an egg-laying substrate as controls; rather, oviDN>Kir2.1* flies searched longer than controls (Fig. 5g). What is going on, remarkably, is that oviDN>Kir2.1* flies perform their next ovulation sooner after laying an egg than controls, such that despite searching longer before laying an egg, these flies ended up expressing nearly identical inter-ovulation and inter-egg intervals as control flies. The inter-ovulation interval (as estimated with locomotor speed) was not statistically different in oviDN>Kir2.1* and control flies (P = 0.36) (data not shown). P-values were calculated using two-sided Wilcoxon rank sum test.
Extended Data Fig. 11
Extended Data Fig. 11. Spilt-GAL4 lines targeting oviDN input neurons and analysis of oviDN inputs in the hemibrain connectome.
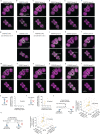
a-r, Average z-projection of oviDN input split-GAL4 lines in the brain (top) and ventral nerve cord (bottom) in order of x-axis in Fig. 6a (see Supplementary Table 3 for additional information). Green shows UAS-CsChrimson-mVenus expression in the targeted neurons and magenta represents a neuropil counterstain (Methods). s, In panels s-v, we show circuit motifs that are not supported by our analysis of the hemibrain connectome, in contrast to the motif reported in Fig. 6e, which is supported (see Methods for more discussion). This panel shows that no chemical-synapse-based recurrent circuit is observed between the oviDNs themselves in the hemibrain connectome at a threshold of ≥ 10 synapses per connection (even true at a threshold of ≥ 2 synapses here). (For reference on the potential functional significance of a 10 synapse threshold, ~15-20 neurons make ≥ 10 synapses onto an individual oviDN in the hemibrain.) Scatter plot of connections between pairs of neurons is shown to right. Both data points are from a single pair of oviDNs. t, We found in the hemibrain connectome all pairs of cells that fulfilled the circuit diagram shown on the left at a threshold of ≥ 1 synapse per connection. No direct, bidirectional, chemical-synapse-based recurrent circuit could be detected between individual oviDNs and any oviDN input neuron in the hemibrain connectome at a threshold of ≥ 10 synapses per connection (even true at a threshold of ≥ 4 synapses per connection here). Scatter plot of connections shown to right; each dot represents the connections between two neurons. Orange points represent pairs of connected neurons diagrammed in the recurrent circuit in Fig. 6e, but assayed for participation in a different circuit motif here. u, We found in the hemibrain connectome all sets of four cells that fulfilled the circuit diagram shown on the left at a threshold of ≥ 1 synapse per connection. None of these putative circuits had ≥ 10 synapses for all four connections, which we interpret to mean that no chemical-synapse-based, disynaptic recurrent circuit exists between individual oviDNs and a single class of oviDN input neuron. Cell classes (types) were based on the hemibrain v1.2.1 connectome annotation. Scatter plot of connections is shown to right; each dot represents the connections between a set of four neurons. Orange points represent sets of four neurons diagrammed in the recurrent circuit in Fig. 6e, but assayed for participation in a different circuit motif here. For example, the orange dot indicated by an arrow represents the following connections between single cells: oviDNa(right)←groupU(right)↔groupU(left)→oviDNb(left). v, Same as panel u, but for a different circuit architecture. Each point, once again, represents the connections between a set of four neurons. None of these putative circuits had ≥ 10 synapses for all four connections.
Extended Data Fig. 12
Extended Data Fig. 12. Neurotransmitter identity of recurrently connected neurons.
a–e, Average z-projection of 5 z-slices (1 µm z-intervals) centered around the cell of interest. oviEN cells are ChAT positive (panel a); group U cells are TH positive (panel b); and the staining of the 3 group G cells (assigned to cell 1, cell 2, or cell 3 with decreasing brightness of 2xEGFP immunostaining) yielded one cell with unclear transmitter assignment (panel c, cell 1 of 3), one TH positive cell (panel d, cell 2 of 3), and one ChAT positive cell (panel e, cell 3 of 3), respectively. The three group G cells consistently had three qualitatively different levels of brightness (2xEGFP in panels c-e).

Comment in

References

    1. Gold JI, Shadlen MN. The neural basis of decision making. Annu. Rev. Neurosci. 2007;30:535–574. doi: 10.1146/annurev.neuro.29.051605.113038. - DOI - PubMed
    1. Hanks TD, Summerfield C. Perceptual decision making in rodents, monkeys, and humans. Neuron. 2017;93:15–31. doi: 10.1016/j.neuron.2016.12.003. - DOI - PubMed
    1. Shadlen MN, Newsome WT. Motion perception: seeing and deciding. Proc. Natl Acad. Sci. USA. 1996;93:628–633. doi: 10.1073/pnas.93.2.628. - DOI - PMC - PubMed
    1. Daw ND, O’Doherty JP, Dayan P, Seymour B, Dolan RJ. Cortical substrates for exploratory decisions in humans. Nature. 2006;441:876–879. doi: 10.1038/nature04766. - DOI - PMC - PubMed
    1. Hayden BY. Economic choice: the foraging perspective. Curr. Opin. Behav. Sci. 2018;24:1–6. doi: 10.1016/j.cobeha.2017.12.002. - DOI

Publication types

LinkOut - more resources