. 2023 Jul;619(7969):363-370.
doi: 10.1038/s41586-023-06274-3. Epub 2023 Jul 5.

Loss of CDK4/6 activity in S/G2 phase leads to cell cycle reversal

Affiliations

Loss of CDK4/6 activity in S/G2 phase leads to cell cycle reversal

James A Cornwell et al. Nature. 2023 Jul.

Erratum in

Abstract

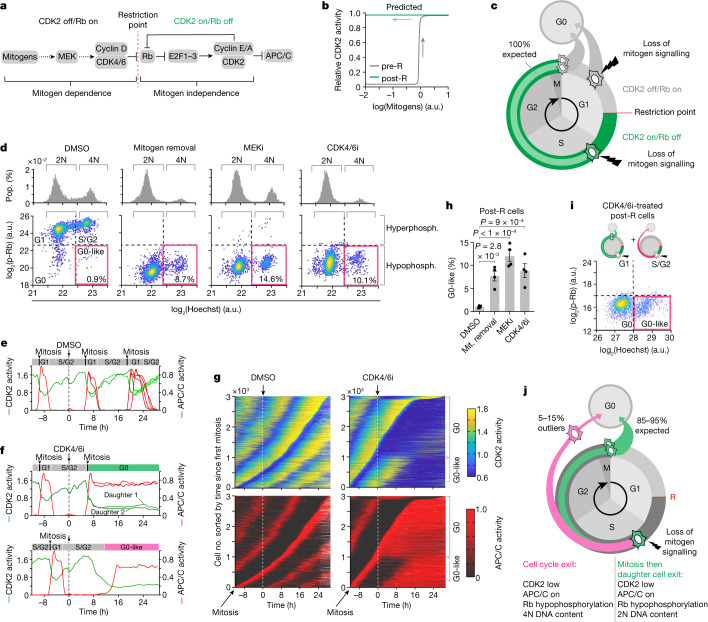
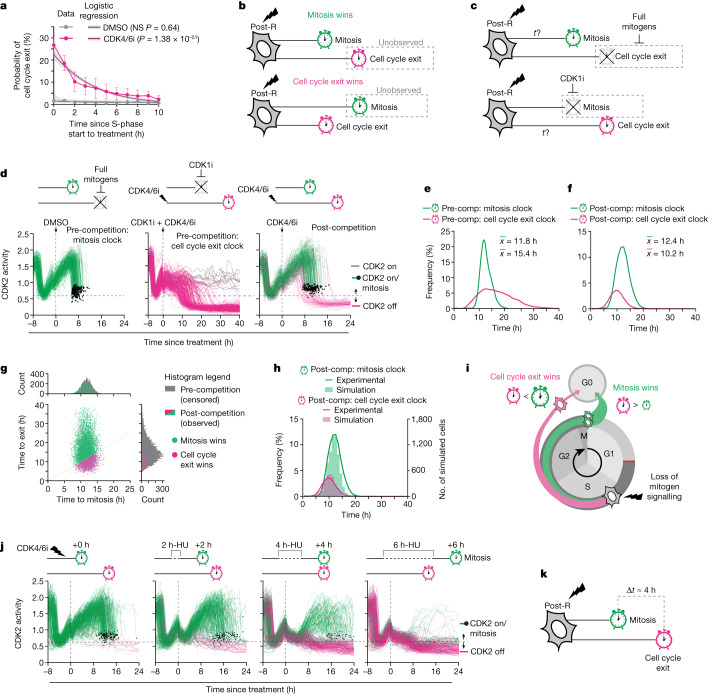
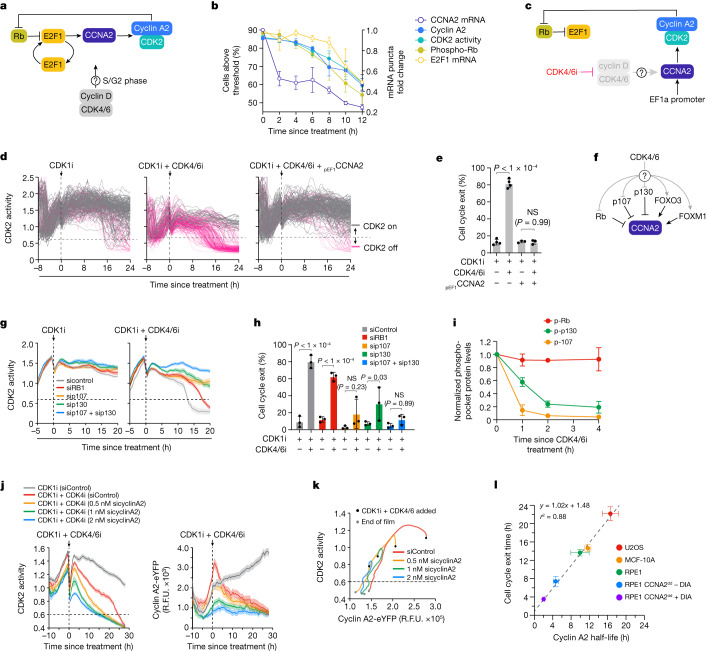
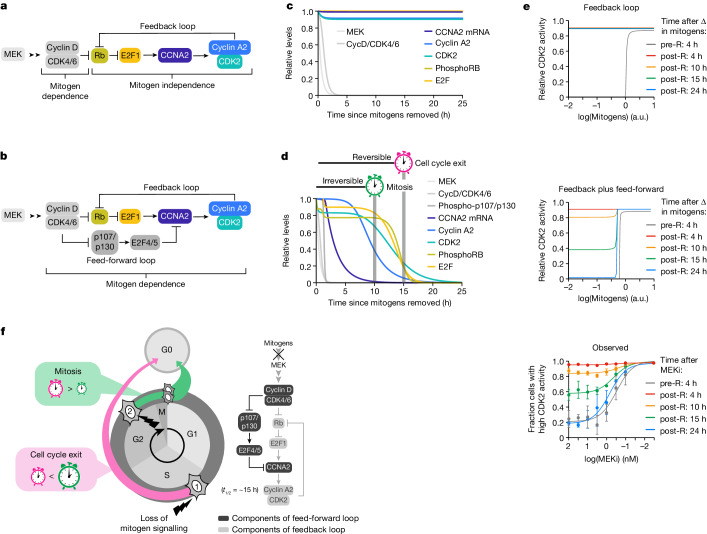
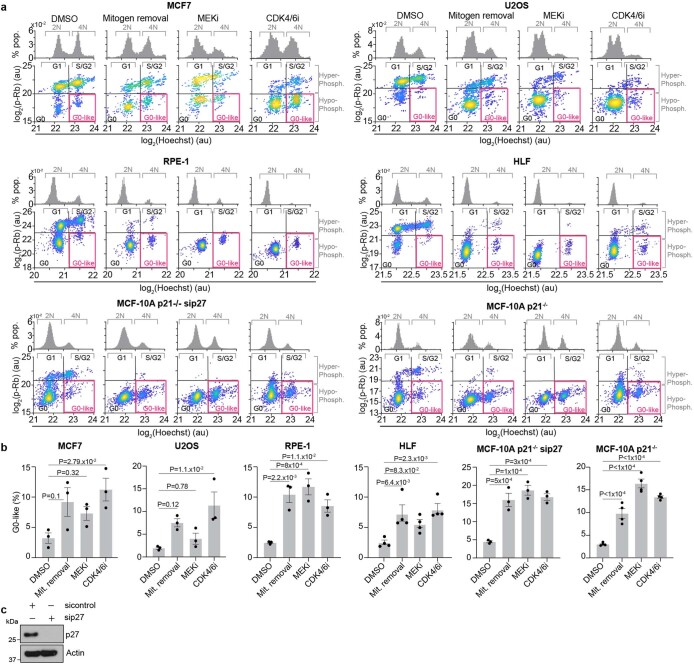
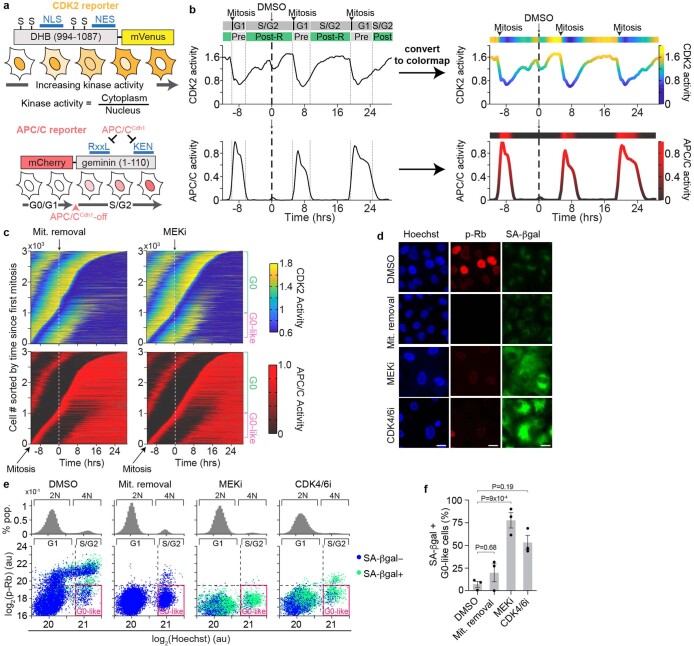
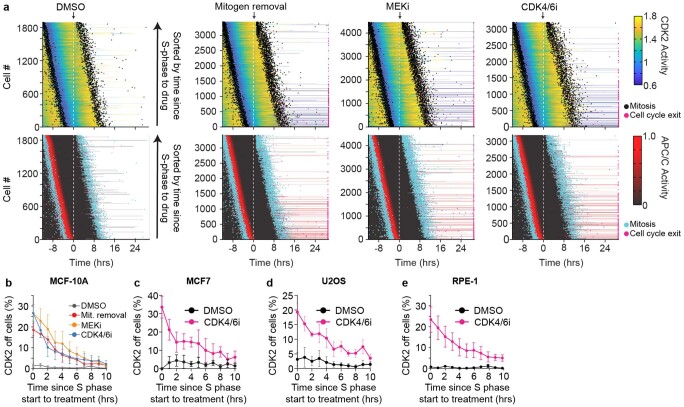
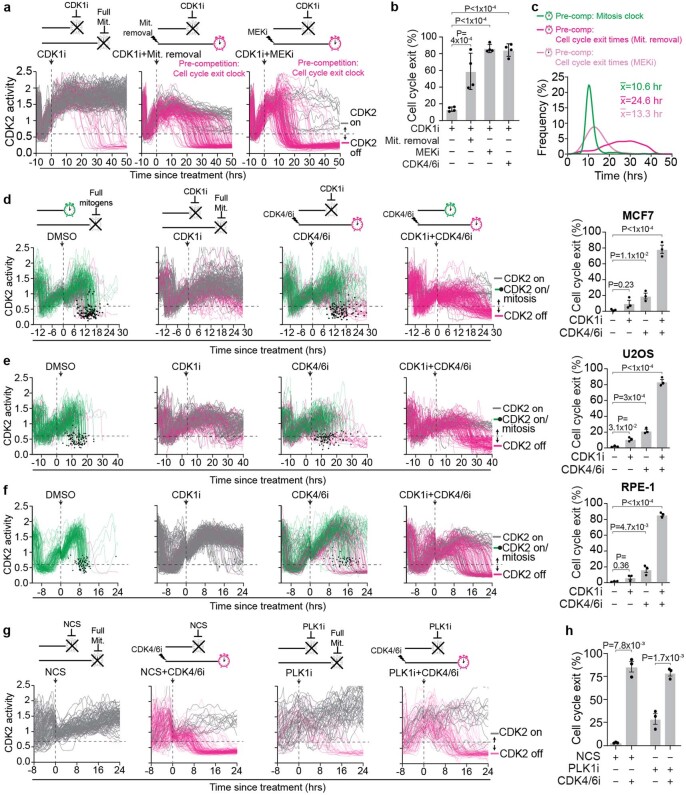
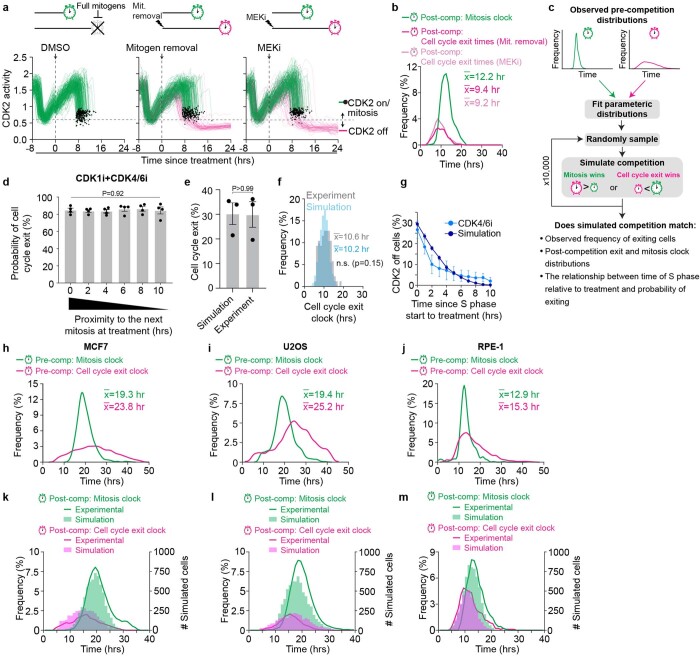
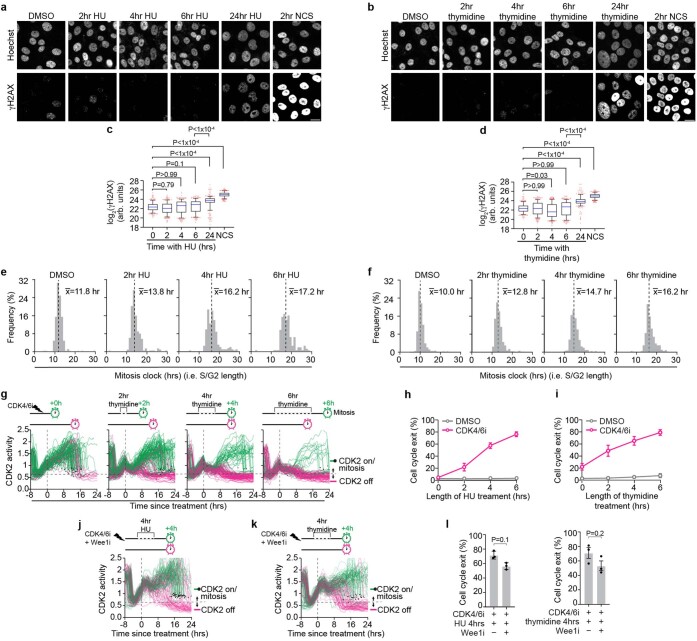
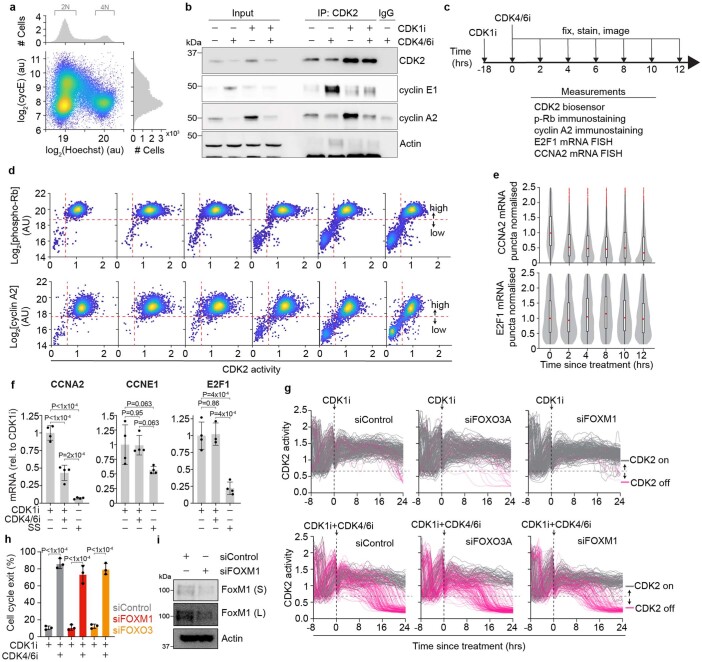
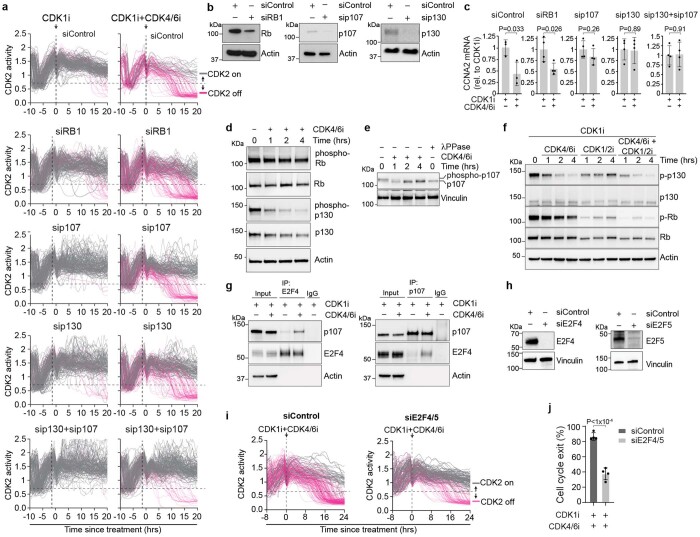
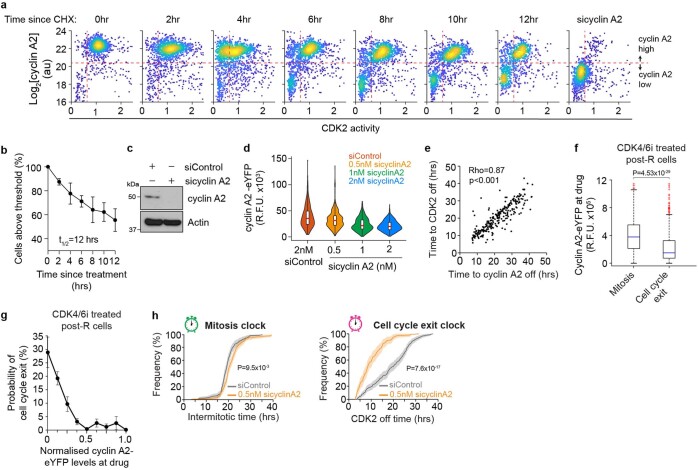
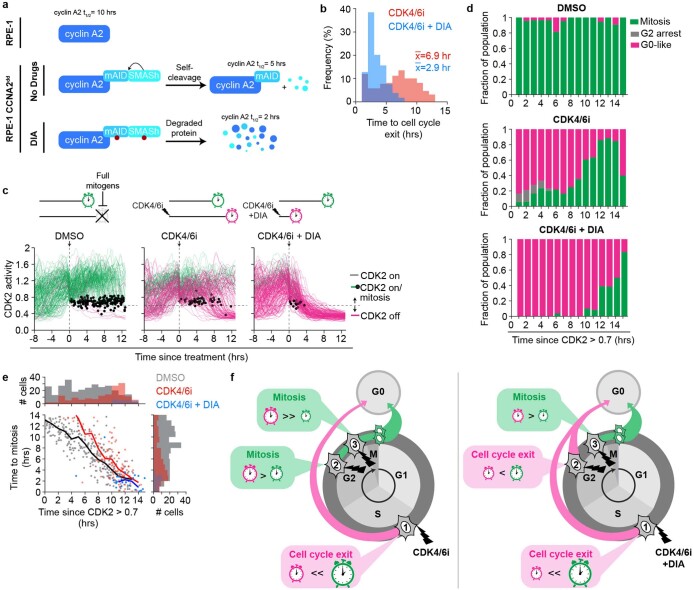
In mammalian cells, the decision to proliferate is thought to be irreversibly made at the restriction point of the cell cycle1,2, when mitogen signalling engages a positive feedback loop between cyclin A2/cyclin-dependent kinase 2 (CDK2) and the retinoblastoma protein3-5. Contrary to this textbook model, here we show that the decision to proliferate is actually fully reversible. Instead, we find that all cycling cells will exit the cell cycle in the absence of mitogens unless they make it to mitosis and divide first. This temporal competition between two fates, mitosis and cell cycle exit, arises because cyclin A2/CDK2 activity depends upon CDK4/6 activity throughout the cell cycle, not just in G1 phase. Without mitogens, mitosis is only observed when the half-life of cyclin A2 protein is long enough to sustain CDK2 activity throughout G2/M. Thus, cells are dependent on mitogens and CDK4/6 activity to maintain CDK2 activity and retinoblastoma protein phosphorylation throughout interphase. Consequently, even a 2-h delay in a cell's progression towards mitosis can induce cell cycle exit if mitogen signalling is lost. Our results uncover the molecular mechanism underlying the restriction point phenomenon, reveal an unexpected role for CDK4/6 activity in S and G2 phases and explain the behaviour of all cells following loss of mitogen signalling.


Conflict of interest statement

The authors declare no competing interests.

Figures

Fig. 1
Fig. 1. Mitogen signalling maintains CDK2 activity in S/G2.
a, Textbook signalling pathway indicating that the R point marks the switch from mitogen dependence to independence. b, Mathematical model adapted from Yao et al. showing bistability and hysteresis in CDK2 activity with respect to mitogen signalling. c, Predicted fates for pre- and post-R cells made by the R-point model. d, Histograms show DNA content (upper panels). Scatterplots of Rb phosphorylation versus DNA content (lower panels). Pink boxes mark the G0-like state (hypophosphorylated Rb and 4N DNA content). The percentage of G0-like cells is indicated. N = 2,000 cells per condition. e, CDK2 and APC/C activity from an example MCF-10A cell treated with DMSO at the indicated time. The cell divides multiple times, giving rise to four granddaughter cells (Supplementary Video 1). f, CDK2 and APC/C activity from two example MCF-10A cells treated with CDK4/6i at the indicated time. In the upper panel, the cell divides, and its daughters arrest in G0. In the lower panel, the cell exits the cell cycle to a G0-like state without dividing (Supplementary Videos 2 and 3). g, Heat maps show CDK2 and APC/C activity sorted by time of mitosis for cells treated with DMSO (left panels) or a CDK4/6i (right panels). Extended Data Fig. 2b demonstrates how CDK2 and APC/C activities are converted to the heat map. h, Percentages of post-R cells that exit to the G0-like state after mitogen (Mit.) removal, MEKi or CDK4/6i. Error bars represent s.e.m. from n = 4 independent experiments. P values were calculated using a one-way analysis of variance. P values from top to bottom are 9 × 10−4, less than 1 × 10−4 and 2.8 × 10−3. i, Scatterplot of Rb phosphorylation versus DNA content for CDK4/6i-treated post-R cells from g showing two distinct cell cycle trajectories for post-R cells after loss of mitogen signalling. The pink box indicates the G0-like state, and cartoons (upper panel) show cell cycle trajectories. N = 3,621 cells. j, Schematic showing observed fate outcomes for post-R cells after loss of mitogen signalling. a.u., arbitrary unit. phosph., phosphorylation. Source Data
Fig. 2
Fig. 2. Competition between mitosis and exit determines cell fate.
a, The observed percentages of post-R cells exiting in each bin for DMSO (grey circles) and CDK4/6i treatment (pink circles) are shown. Error bars represent s.e.m. from n = 3 experiments. A logistic regression model was fitted to the data. Shaded regions represent 95% confidence intervals. P values were calculated from a logistic regression model using a two-tailed Wald test: DMSO (P = 0.64) and CDK4/6i (P = 1.38 × 10−51). b, Schematic illustrating temporal competition between mitosis and cell cycle exit for a post-R cell that lost mitogen signalling in S/G2 phase. c, Schematic illustrating that inhibition of either the mitosis clock or the cell cycle exit clock enables measurement of the pre-competition cell cycle exit clock or mitosis clock, respectively. d, Single-cell traces of CDK2 activity aligned to time of treatment. Green lines depict cells that entered mitosis (indicated by black dots). Grey lines depict cells that remain committed to the cell cycle with high CDK2 activity (greater than 0.6). Pink lines depict cells that lost CDK2 activity (less than 0.6) and exited the cell cycle. N = 232, 299 and 242 cells, respectively. e, Histograms showing pre-competition distributions of the mitosis and cell cycle exit clocks measured from the left and middle panels of d, respectively. f, Histograms showing post-competition distributions of the mitosis and cell cycle exit clocks measured from the right panel of d. g, Monte Carlo simulation showing post-competition distributions for mitosis (green histogram) and cell cycle exit (pink histogram) overlaid over their respective pre-competition distributions (grey histograms). The scatterplot shows simulated times for cell cycle exit and mitosis colour coded by whether mitosis (green dots) or cell cycle exit (pink dots) won the competition. h, Histograms of post-competition times for cell cycle exit and mitosis. Lines represent experimentally measured distributions, and solid bars represent simulated distributions from g. i, Schematic showing that after loss of mitogen signalling, the difference in timing of the cell cycle exit and mitosis clocks determines whether a cell will exit the cell cycle or reach mitosis. j, CDK2 activity traces from MCF-10A p21−/− cells aligned to the time of treatment with hydroxyurea (HU) and CDK4/6i coloured as in d. N = 300, 286, 300 and 297 cells, respectively. k, Schematic illustrating that after loss of mitogen signalling in post-R cells, CDK2 activity can be maintained for approximately 15 h, which is approximately 4 h longer than the median time to enter mitosis. NS, not significant. Source Data
Fig. 3
Fig. 3. CDK4/6 promotes cyclin A2 synthesis in S/G2.
a, Proposed CDK2–Rb feedback loop model. b, Measurements of each component in a taken after treatment with CDK1i + CDK4/6i. n = 2 for CCNA2 mRNA and E2F1 mRNA, n = 3 for cyclin A2 protein and CDK2 activity and n = 4 for phospho-Rb levels. Error bars represent s.e.m. c, Experimental design to test if cyclin A2 expression from an unregulated promoter can rescue loss of CDK2 activity after CDK4/6i treatment. d, CDK2 activity traces for cells treated as indicated. Grey and pink traces represent cells with CDK2 greater than 0.6 and CDK less than 0.6 activity at 24 h, respectively. N = 200, 209 and 200 cells, respectively. e, Percentages of cells that exited the cell cycle from d. Error bars represent s.e.m. from n = 4 independent experiments. P values were calculated using a one-way analysis of variance. P values from top to bottom are less than 1 × 10−4 and 0.99. f, CDK4/6 substrates that are proposed regulators of CCNA2 transcription. g, Median CDK2 activity traces for cells aligned to time since treatment for the indicated conditions. Shaded regions represent 95% confidence intervals. N > 1,000 cells per condition. Dotted horizontal lines represent CDK2 activity below the threshold required for Rb phosphorylation (CDK2 less than 0.6). h, Percentages of cells that exited the cell cycle from g. Error bars represent s.e.m. from n = 3 independent experiments. P values were calculated using a one-way analysis of variance. P values from left to right are less than 1 × 10−4, less than 1 × 10−4, 0.23, 0.03 and 0.89. i, Quantification of phosphorylated pocket proteins after CDK4/6i treatment. Levels of each phosphoprotein were normalized to the total levels of the respective protein. Error bars represent s.e.m. (Rb, n = 5; p107, n = 2; p130, n = 3 independent experiments). j, Median CDK2 activity traces (left panel) and endogenous cyclin A2 levels (right panel) aligned to time since treatment for U2OS-eYFP cells. Shaded regions indicate 95% confidence intervals. k, Phase plot of median CDK2 activity and median endogenous cyclin A2 levels. l, Cell cycle exit times as a function of cyclin A2 half-life for indicated cell lines. Equations for the best-fit line and r2 value are shown. Error bars represent s.e.m. (U2OS, n = 5; MCF-10A, n = 6; RPE-1, n = 4; RPE-1 CCNA2dd-DIA, n = 2; RPE CCNA2dd + DIA, n = 2 independent experiments). R.F.U., relative fluorescence units. Source Data
Fig. 4
Fig. 4. A feed-forward loop underlies CDK2 reversibility.
a, Textbook model of the signalling pathway showing that cyclin A2 levels and CDK2 activity can be continuously maintained independent of mitogen signalling due to the proposed CDK2–Rb feedback loop. b, Revised model showing a feed-forward signalling pathway where mitogen signalling continuously maintains cyclin A2 and CDK2 activity in post-R cells. c, Output from mathematical modelling of the feedback loop model in a after mitogen removal. Cyclin A2 levels and CDK2 activity remain high. d, Output from mathematical modelling of the feed-forward pathway model in b after mitogen removal. Cyclin A2 levels and CDK2 activity appear irreversible at the time cells normally enter mitosis, although they eventually reach a steady state of zero, explaining why cells exit the cell cycle. e, CDK2 activity levels for pre- and post-R cells with respect to mitogen concentration for the feedback loop model (top panel) and the feed-forward pathway model (middle panel) at the indicated times after simulated change in mitogens. The observed (bottom panel) dose response relationship between CDK2 activity and MEKi concentration for pre- and post-R cells is shown. CDK2 activity was evaluated after MEKi treatment at the times indicated. Mitosis was blocked using a CDK1i. Error bars are s.e.m. from n = 2 replicates. f, For MCF-10A cells, in the absence of mitogens, competition between mitosis and cell cycle exit determines the fate of the cell due to a feed-forward loop regulating cyclin A2. A cell that is greater than approximately 15 h away from mitosis at the time mitogen signalling is blocked (cell 1) will lose cyclin A2 and exit, while a cell further along the cell cycle (cell 2) will reach mitosis before it will lose cyclin A2 and divide into two daughter cells. Source Data
Extended Data Fig. 1
Extended Data Fig. 1. Diverse cell types rely on mitogens in S/G2.
a, Effect of loss of mitogen signalling on Rb phosphorylation and DNA content in diverse cell types: MCF7, transformed breast epithelial cells; U2OS, transformed osteosarcoma cells; RPE-1, non-transformed hTERT-immortalized retina pigmented epithelial cells; HLF, primary human lung fibroblasts; MCF-10A, non-transformed breast epithelial cells. Histograms show DNA content for each treatment (top). Scatter plots of Rb phosphorylation vs DNA content for each treatment (bottom). Pink boxes mark the G0-like state (hypo-phosphorylated Rb and 4N DNA content). All treatments were for 48 hrs. N = 2,000 cells are plotted per condition. b, The percentage of G0-like cells for each condition from (a) is indicated. Error bars are SEM from at least n = 3 biological replicates. P-values were calculated using a one-way ANOVA. P-values from top to bottom; MCF7: 2.79 × 10⁻², 0.32, 0.1, U2OS: 1.1 × 10⁻², 0.78, 0.12, RPE-1: 1.1 × 10⁻², 8 × 10⁻⁴, 2.2 × 10⁻³, HLF: 2.3 × 10⁻³, 8.3 × 10⁻², 6.4 × 10⁻³, MCF-10A p21−/− sip27: 3 × 10⁻⁴, 1 × 10⁻⁴, 5 × 10⁻⁴, MCF-10A p21−/−: <1 × 10⁻⁴, <1 × 10⁻⁴, <1 × 10⁻⁴. c, Western blot validation of p27 knockdown using siRNA. Representative image of n = 2 independent experiments. Source Data
Extended Data Fig. 2
Extended Data Fig. 2. CDK2 and APC/C activity measured in live cells.
a, Schematic of the fluorescent biosensors used for CDK2 activity (left) and APC/C activity (right). A detailed description of how the sensors work can be found in,,. b, Example single-cell trace shows CDK2 (top) and APC/C (bottom) activity before and after DMSO treatment. Vertical grey lines indicate phase transitions and green bars show the region we considered cells to be post-Restriction Point (Post-R). Raw activity traces (left) are converted to a colormap format (right) to allow for analysing thousands of time series from asynchronous cells in one graph (see Figs. 1g and 2a and Extended Data Figs. 2c and 3a). c, Heatmaps showing CDK2 and APC/C activity aligned to mitosis for three thousands of cells treated as indicated. Mit, Mitogens. d, Representative fluorescent microscopy images of cells treated as indicated for 7 days and stained for DAPI to visualize nuclei, phospho-Rb, and a fluorescent probe to detect senescence-associated beta-galactosidase activity (SA-βgal; left). Scale bar is 20 μm. Images are representative cells from n = 3 independent experiments. e, Histograms show DNA content for each treatment (top). Scatter plots of Rb phosphorylation vs DNA content for each treatment (bottom). Each dot represents a single-cell and is coloured based on the status of SA-βgal staining. Pink boxes mark the G0-like state (hypho-phosphorylated Rb and 4N DNA content). Each plot contains N > 22,000 cells. f, Quantification of percent of cells that have high SA-βgal staining, 4N DNA content, and hypo-phosphorylated Rb from (e). Error bars represent SEM from n = 3 experiments. P-values were calculated using a one-way ANOVA. P-values from top to bottom: 0.19, 9 × 10⁻⁴, 0.68. Source Data
Extended Data Fig. 3
Extended Data Fig. 3. Proximity to S-phase start determines cell fate.
a, Heatmaps of CDK2 activity (top) and APC/C activity (bottom) for post-R cells sorted by time since S-phase entry at treatment. When treated with DMSO all post-R cells divide within 24 hrs indicated by black/cyan dots. Upon mitogen removal or MEKi treatment some cells divide (black/cyan dots) and others lose CDK2 activity and exit the cell cycle (pink dots). b, Probability of cell cycle exit as a function of the time since the start of S phase at treatment for each treatment as indicated. Error bars represent SEM from n = 3 experiments. c–e, Probability of cell cycle exit as a function of the time since the start of S phase at treatment as indicated in MCF7 cells (c), U2OS cells (d), or RPE-1 cells (e). Error bars represent SEM from n = 3 experiments (c,d) or n = 5 experiments (e). Source Data
Extended Data Fig. 4
Extended Data Fig. 4. Cells require mitogen signalling if mitosis is blocked.
a, Single cell traces of CDK2 activity aligned with respect to time of treatment for cells treated as indicated. Grey and pink traces represent cells with CDK2 > 0.6 and CDK2 < 0.6 at the end of the observation period, respectively. N = 200 cells per condition. b, Percentage of cells that exit the cell cycle after blocking the mitosis clock with a CDK1i and combining that with mitogen removal, MEKi, or CDK4/6i treatment. Error bars represent SEM n = 4 experiments. P-values were calculated using a one-way ANOVA. P-values from top to bottom: <1 × 10⁻⁴, <1 × 10⁻⁴, 4 × 10⁻⁴. c, Histograms showing the pre-competition distribution of cell cycle exit times, measured from (a) and the pre-competition distribution of mitosis times, measured from Fig. 2e. d–f, Right, single cell traces of CDK2 activity aligned with respect to time of treatment for cells treated as indicated in MCF7 cells (d), U2OS cells (e), or RPE-1 cells (f). Green traces depict cells that remained committed to the cell cycle and entered mitosis (indicated by black dot). Grey and pink traces represent cells with CDK2 > 0.6 and CDK2 < 0.6 at the end of the observation period, respectively. N = 200 cells per plot, with the exception of the DMSO condition in (f), which contains N = 117 cells. Left, quantification of the percent of cells exiting the cell cycle. Error bars represent SEM from n = 3 experiments. P-values were calculated using a one-way ANOVA. P-values from top to bottom; MCF7: <1 × 10⁻⁴, 1.1 × 10⁻², 0.23, U2OS: <1 × 10⁻⁴, 3 × 10⁻⁴, 3.1 × 10⁻², RPE-1: <1 × 10⁻⁴, 4.7 × 10⁻³, 0.36. g, CDK2 activity traces aligned to time of treatment for the indicated conditions in MCF-10A p21−/− cells. N = 99, 148, 67, and 85 cells respectively. h, Quantification of percent of cells that exit from (g). Error bars represent SEM from n = 3 experiments. P-values were calculated using a one-way ANOVA. P-values from top to bottom: 7.8 × 10⁻³, 1.7 × 10⁻³. Source Data
Extended Data Fig. 5
Extended Data Fig. 5. Simulated competition matches experimental data.
a, Single cell traces of CDK2 activity for DMSO, mitogen removal, and MEKi treatment aligned to time of treatment. Green traces depict cells that remained committed to the cell cycle and entered mitosis (indicated by black dot). Pink traces depict cells that lost CDK2 activity (CDK2 < 0.6) and exited the cell cycle. N = 232, 282, and 252 cells respectively. b, Histograms showing the post-competition distribution of S/G2 length (mitosis clock) and the post-competition distribution of times to lose CDK2 activity (cell cycle exit clock) as measured from (a). Median times for each distribution are shown. c, Schematic outlining the Monte Carlo algorithm used to simulate temporal competition between the mitosis and cell cycle exit clocks. d, Probability of cell cycle exit as a function of time since start of S phase at treatment. Error bars represent SEM from n = 4 experiments. One-way ANOVA show no significant effect of time since S phase at treatment on the probability of exiting the cell cycle. P = 0.92. e, Comparison of observed frequency of cell cycle exit for cells which received the CDK4/6i within 1 hr of entering S phase with results from the Monte Carlo simulation. Error bars represent SEM from n = 3 experiments. P-values were calculated using a two-tailed Mann-Whitney U test. P > 0.99. f, Comparison of observed distribution of cell cycle exit times for cells which received the CDK4/6i within 1 h of entering S phase with results from the Monte Carlo simulation. Median times for each distribution are indicated. A Wilcoxon Rank Sum test was used to test for statistical significance. Not significant (n.s.). g, Comparison of observed frequency of cell cycle exit as a function of time since the start of S phase at treatment with the results from the Monte Carlo simulation. Error bars represent SEM from n = 3 experiments. h–j, Histograms of the pre-competition times for cell cycle exit and mitosis from MCF7 (h), U2OS (i), and RPE-1 (j) cells. Data measured from single-cell data form Extended Data Fig. 4de,f. k–m, Histograms of the post-competition times for cell cycle exit and mitosis from MCF7 (k), U2OS (l), or RPE-1 (m) cells. Lines represent experimentally measured distributions and solid bars represent the simulated distributions from the Monte Carlo simulations. Source Data
Extended Data Fig. 6
Extended Data Fig. 6. CDK4/6 inhibition induces exit when S/G2 is stretched.
a,b, γH2AX staining in MCF-10A p21−/− cells treated with either DMSO, hydroxyurea (HU), thymidine, or neocarzinostatin (NCS) for the indicated time. NCS treatment was used as a positive control. 20 μm scale bar. c,d, Box and whisker plot showing quantification of γH2AX nuclear intensity from (a,b). Blue line represents population mean. Whiskers represent 5–95th percentiles. Red dots indicate cells outside the 5–95th percentiles. One-way ANOVA and Kruskal-Wallace was used to test for statistical significance. P-values from top to bottom for c: <1 × 10⁻⁴, <1 × 10⁻⁴, <1 × 10⁻⁴, 0.1, >0.99, 0.79. P-values from top to bottom for d: <1 × 10⁻⁴, <1 × 10⁻⁴, <1 × 10⁴, >0.99, 0.03, >0.99. N = 500 cells Per condition. e,f, Histograms showing S/G2 length of MCF-10A p21−/− cells after transient hydroxyurea (HU) or thymidine treatment. g, CDK2 activity traces from MCF-10A p21−/− cells aligned to time of treatment with thymidine and CDK4/6i. The length of increase in the mitosis clock is indicated above each plot. Green traces indicate cells which entered mitosis (black dots) and pink traces indicate cells which exited the cell cycle (CDK2 < 0.6). N = 129, 200, 157, or 119 cells in each condition. N = 130, 200, 158, and 120 cells respectively. h, Quantification of the percent of cells exiting the cell cycle after HU treatment from traces in Fig. 2j. Error bars represent SEM from n = 3 independent experiments. i, The percentage of MCF-10A p21−/− cells that exit the cell cycle after treatment with thymidine for various durations as a function of the increase in S/G2 length. Quantification from traces in (g). Error bars represent SEM from n = 3 independent experiments. j,k, CDK2 activity traces aligned to time of treatment with CDK4/6i and Wee1i plus a 4 h pulse of hydroxyurea (HU) or thymidine in MCF-10A p21−/− cells. Green traces indicate cells which entered mitosis (black dots) and pink traces indicate cells which exited the cell cycle (CDK2 < 0.6). Note that the Wee1i rescues the drop in CDK2 activity for both treatments (see Fig. 2j) but does not interfere with the ability of cells to exit the cell cycle. N = 200 cells. l, Quantification of the percent of cells that exited to the G0-like state after the indicated treatment. A two-tailed Mann-Whitney U test from n = 3 independent experiments shows no significant effect of Wee1 inhibitor on the ability of cells to exit to the G0-like state in response to a four hour pulse of either HU (left) or thymidine (right). P-values from left to right: 0.1, 0.2. Error bars represent SEM. Source Data
Extended Data Fig. 7
Extended Data Fig. 7. CDK4/6 activity maintains CCNA2 transcription.
a, Asynchronous HeLa cells were fixed and then stained with a cyclin E1 antibody. Histograms show DNA content (top) and cyclin E1 levels (right). Density scatter plot of cyclin E1 levels vs DNA content (bottom). N = 63,031 cells are plotted. b, Coimmunoprecipitation of CDK2 in either asynchronous cells or cells treated with a CDK1i overnight and then treated with and without a CDK4/6i for 4 hrs. Representative of n = 2 experiments. c, Schematic outlining the experimental design used for Fig. 3b and Extended Data Fig. 7d,e. Cells were first pre-treated with a CDK1i to enrich for post-R cells, and then treated with a CDK4/6i before being fixed, stained, and imaged at the indicated timepoints. d, Density scatter plots of cyclin A2 levels (top row) and phospho-Rb levels (bottom row) plotted against CDK2 activity measured in single-cells. The vertical dashed red line indicates the threshold of CDK2 activity that is required to maintain Rb phosphorylation (CDK2 = 0.6). The horizontal dashed red lines separate cells with hypo- vs hyper-phosphorylated Rb (bottom row) and cells with high vs low cyclin A2 protein levels (top row). N > 1,700 Cells per plot. e, Violin and box plots showing single-cell levels of CCNA2 mRNA puncta (top row) and E2F1 mRNA puncta as measured by mRNA FISH. mRNA puncta levels were normalized to the 0 hr treatment. Top: N = 3850, 0 hr; 1579, 2 hr; 2252, 4 hr; 2212, 8 hr; 2316, 10 hr; 2405, 12 hr cells. Bottom: N = 2908, 0hr; 1814, 2 hr; 2306, 4 hr; 1843, 8 hr; 2030, 10 hr; 2098, 12 hr cells. The box plots show the median (centre line), interquartile range (box limits), and minimum and maximum values (whiskers). f, qRT-PCR data showing mRNA levels normalized to CDK1i treated after treatment with a CDK4/6i for 2 hrs, or 24 hrs of mitogen removal as a positive control. Error bars represent SD from N = 3 replicates. Representative of n = 3 experiments. P-values were calculated using a one-way ANOVA. P-values from top to bottom; CCNA2: <1 × 10⁻⁴, <1 × 10⁻⁴, 2 × 10⁻⁴, CCNE1: 0.063, 0.95, 0.063, E2F1: 4 × 10⁻⁴, 0.86, 4 × 10⁻⁴. SS, serum starvation. g, Single-cell traces of CDK2 activity aligned to time of treatment for cells treated as indicated. Grey and pink traces represent cells with CDK2 > 0.6 and CDK2 < 0.6 at the end of the observation period, respectively. N = 200 Cells per plot. h, Quantification of the percent of cells that exit the cell cycle as in (g). Error bars represent SEM from n = 3 experiments. P-values were calculated using a one-way ANOVA. P-values from left to right: <1 × 10⁻⁴, <1 × 10⁻⁴, <1 × 10⁻⁴. i, Western blot validation of FoxM1 knockdown using siRNA. S, short exposure; L, long exposure. Representative of n = 2 experiments. Source Data
Extended Data Fig. 8
Extended Data Fig. 8. p107/p130 inhibit CDK2 activity after mitogen loss.
a, Single-cell traces of CDK2 activity aligned to time of treatment for the indicated conditions. Grey and pink traces represent cells with CDK2 > 0.6 and CDK2 < 0.6 at the end of the observation period, respectively. N > 117 Cells per plot. b, Western blot validation of Rb, p107, and p130 knockdown using siRNA. Representative image of n = 2 experiments. c, qRT-PCR data showing mRNA levels normalized to CDK1i treatment alone for cells treated with a CDK4/6i for 2 hrs. Error bars represent SD from N = 4 replicates (N = 3 for siControl). Representative of n = 3 experiments. P-values were calculated using a one-way ANOVA. P-values from left to right: 0.033, 0.026, 0.26, 0.89, 0.91. d, Western blot time-course of phospho-p130 (S672) and phospho-Rb (S807/811) after CDK4/6i treatment. Cells were pre-treated with a CDK1i for 24 hrs to arrest cells in a post-R state and then treated with either DMSO or a CDK4/6i for the indicated times. Representative image of n = 5 experiments. e, Western blot time-course showing a loss of p107 phosphorylation after CDK4/6i treatment. Arrows indicate the phosphorylated and unphosphorylated forms of p107. Representative image of n = 2 experiments. f, Western blot time-course in cells treated with a CDK1i and then either CDK4/6i alone, CDK1/2i Alone, or both. g, Coimmunoprecipitation of p107 and E2F4 in cells treated with a CDK1i overnight and then treated with and without a CDK4/6i for 4 hrs. Top: IP with E2F4 antibody. Bottom: IP with p107 antibody. Representative image of n = 2 experiments. h, Western blot validation of E2F4 and E2F5 knockdown using siRNA. Representative of n = 2 experiments. i, Single cell traces of CDK2 activity aligned to time of treatment for cells treated as indicated. Grey and pink traces represent cells with CDK2 > 0.6 and CDK2 < 0.6 at the end of the observation period, respectively. N = 197 and 167 cells respectively. j, Quantification of the percent of cells that exit the cell cycle as in (h). Error bars represent SEM from n = 4 experiments. P-values were calculated using a two-tailed Students T-test. P < 1 × 10⁻⁴. Source Data
Extended Data Fig. 9
Extended Data Fig. 9. Cyclin A2 stability determines the cell cycle exit clock.
a, Density scatter plots of cyclin A2 levels against CDK2 activity after treatment with cycloheximide at indicated timepoints. The vertical dashed red line indicates the threshold of CDK2 activity that is required to maintain Rb phosphorylation (CDK2 = 0.6). The horizontal dashed red lines separate cells with high vs low cyclin A2 protein levels (top row). The last panel shows cyclin A2 levels for cells treated with cyclin A2 siRNA to establish the threshold for high vs low cyclin A2 levels. N > 1,300 Cells per plot. b, Plot of percent of cyclin A2 low cells over time after treatment with cycloheximide. Error bars represent SEM from n = 3 experiments. t1/2 indicates the measured half-life. c, Western blot validation of cyclin A2 knockdown using siRNA. d, Violin and box plots showing single-cell cyclin A2-eYFP levels after treatment with various concentrations of siRNA targeting cyclin A2. Red line represents population mean. From left to right, N = 566, 479, 487, and 394 cells. The box plots show the median (centre line), interquartile range (box limits), and minimum and maximum values (whiskers). e, Scatter plot showing the correlation between the time to lose CDK2 activity (CDK2 < = 0.6) and cyclin A2 levels (cyclin A2 < = G1 levels of cyclin A2). Rho, pearson’s correlation coefficient. N > 396 cells per condition. f, Data are a box and whisker plot of the cyclin A2-eYFP levels at the time post-R U2OS cells were treated with CDK4/6i in cells that either reached mitosis or exited the cell cycle. Blue line represents the population mean. Whiskers represent 5–95th percentiles. Red dots indicate single-cell outliers beyond the 5–95th percentiles. A Mann Whitney U test was used to test for statistical significance. P = 4.53 × 10⁻²⁹. N = 915 (mitosis) and 333 (cell cycle exit) cells. g, Probability of cell cycle exit as a function of the cyclin A2-eYFP levels at the time the CDK4/6i was added. Error bars represent SEM from n = 4 experiments. h, Empirical cumulative distribution of intermitotic times (left panel) and cell cycle exit times (right panel) for cells treated with control siRNA and 0.5 nM cyclinA2 siRNA. P-values were calculated using a two-tailed Kolmogorov Smirnov test. Mitosis clock (P = 9.5 × 10⁻³) and cell cycle exit (P = 7.6 × 10⁻¹⁷). Source Data
Extended Data Fig. 10
Extended Data Fig. 10. Destabilizing cyclin A2 shortens the cell cycle exit clock.
a, Schematic of the inducible degron system used to de-stabilize cyclin A2. For details about the inducible-degron system, see Methods section. b, Histogram of the cell cycle exit times for RPE-1 CCNA2dd cells treated with a CDK4/6i or CDK4/6i plus DIA. c, Single cell traces of CDK2 activity aligned with respect to time of treatment for cells treated as indicated in RPE-1 CCNA2dd cells. Green traces depict cells that remained committed to the cell cycle and entered mitosis (indicated by black dot). Grey and pink traces represent cells with CDK2 > 0.6 and CDK2 < 0.6 at the end of the observation period, respectively. For each condition, N = 200 cells are shown. d, Cell fate of RPE-1 CCNA2dd cells from (c) binned by the time since CDK2 activity rose above 0.7 when the drug was added. Representative data from n = 2 independent experiments. e, Scatter plot of single cells comparing the time since CDK2 activity rose above 0.7 when the drug was added versus the time after treatment when cells reached mitosis. Single-component histograms shown above and to the right. Solid lines represent the average for each condition as indicated. DMSO, N = 280; CDK4/6i, N = 126; CDK4/6i + DIA, N = 26 cells. f, Left: Upon CDK4/6 inhibitor treatment, cells closer to the start of S phase, and therefore far away from mitosis (Cell 1), are more likely to exit the cell cycle, whereas cells close to mitosis (Cell 2 and 3) are more likely to reach mitosis. Right: Destabilizing cyclin A2 by treating cells with DIA shortens the cell cycle exit clock, which means that, relative to cells without DIA, cells closer to mitosis (Cell 2) when the CDK4/6 inhibitor is added are more likely to exit the cell cycle. Source Data

Comment in

References

    1. Pardee AB. A restriction point for control of normal animal cell proliferation. Proc. Natl Acad. Sci. USA. 1974;71:1286–1290. doi: 10.1073/pnas.71.4.1286. - DOI - PMC - PubMed
    1. Zetterberg A, Larsson O. Kinetic analysis of regulatory events in G1 leading to proliferation or quiescence of Swiss 3T3 cells. Proc. Natl Acad. Sci. USA. 1985;82:5365–5369. doi: 10.1073/pnas.82.16.5365. - DOI - PMC - PubMed
    1. Schwarz C, et al. A precise Cdk activity threshold determines passage through the restriction point. Mol. Cell. 2018;69:253–264.E5. doi: 10.1016/j.molcel.2017.12.017. - DOI - PMC - PubMed
    1. Spencer SL, et al. The proliferation-quiescence decision is controlled by a bifurcation in CDK2 activity at mitotic exit. Cell. 2013;155:369–383. doi: 10.1016/j.cell.2013.08.062. - DOI - PMC - PubMed
    1. Sherr CJ. Cancer cell cycles. Science. 1996;274:1672–1677. doi: 10.1126/science.274.5293.1672. - DOI - PubMed

Publication types