. 2023 Jul;619(7969):385-393.
doi: 10.1038/s41586-023-06282-3. Epub 2023 Jul 5.

Cooperation between bHLH transcription factors and histones for DNA access

Affiliations

Cooperation between bHLH transcription factors and histones for DNA access

Alicia K Michael et al. Nature. 2023 Jul.

Abstract

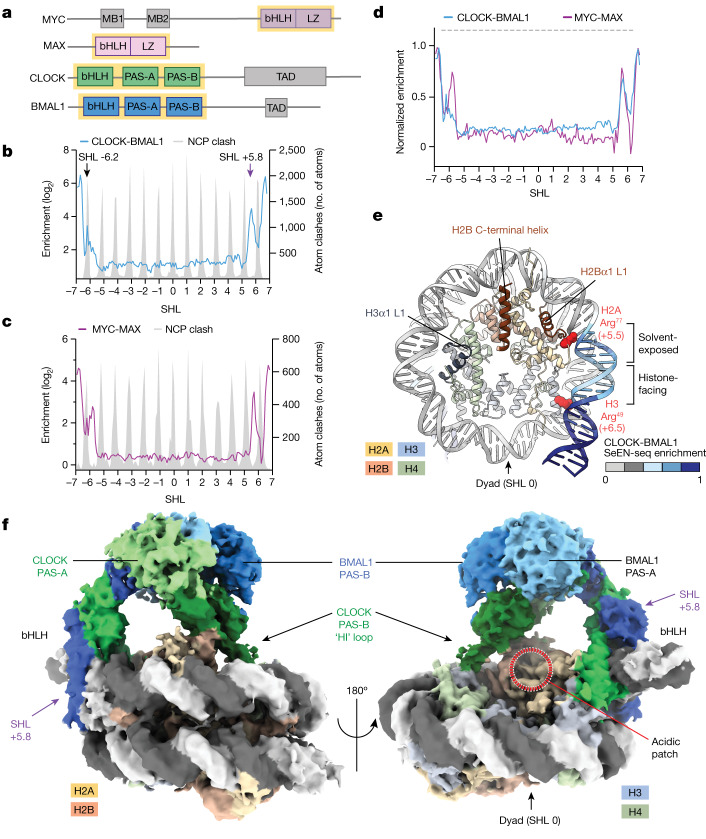
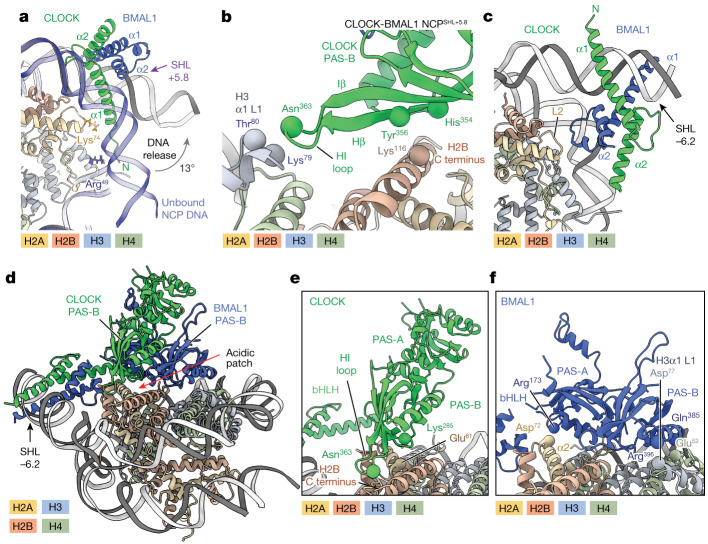
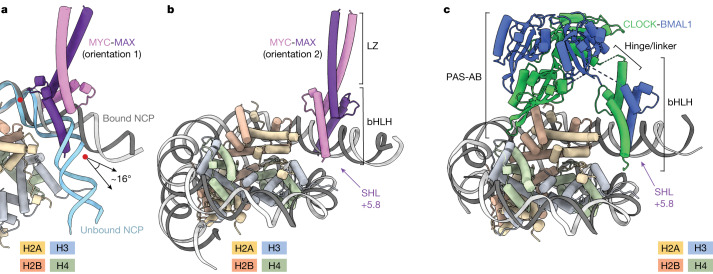
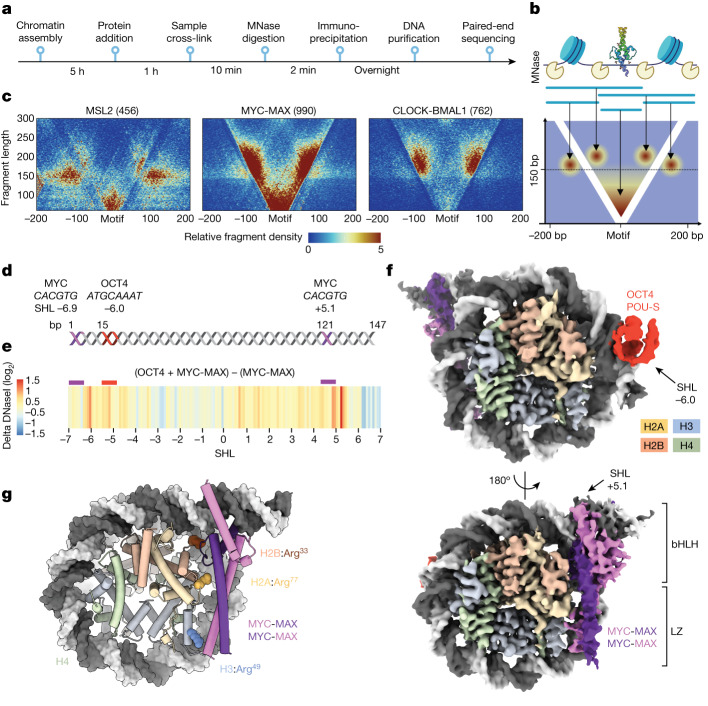
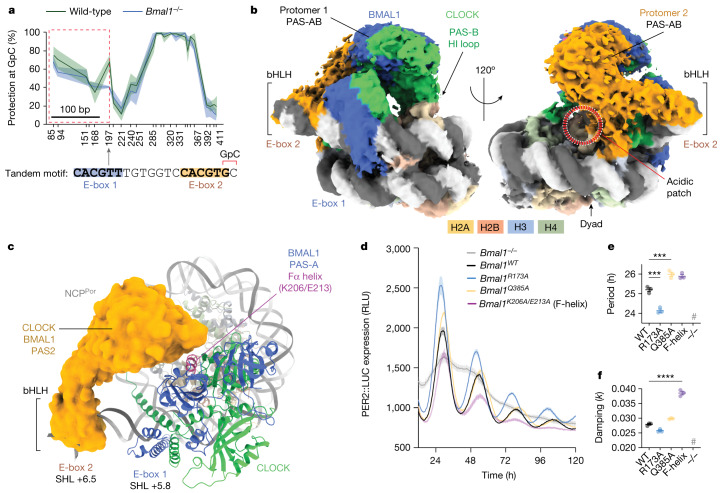
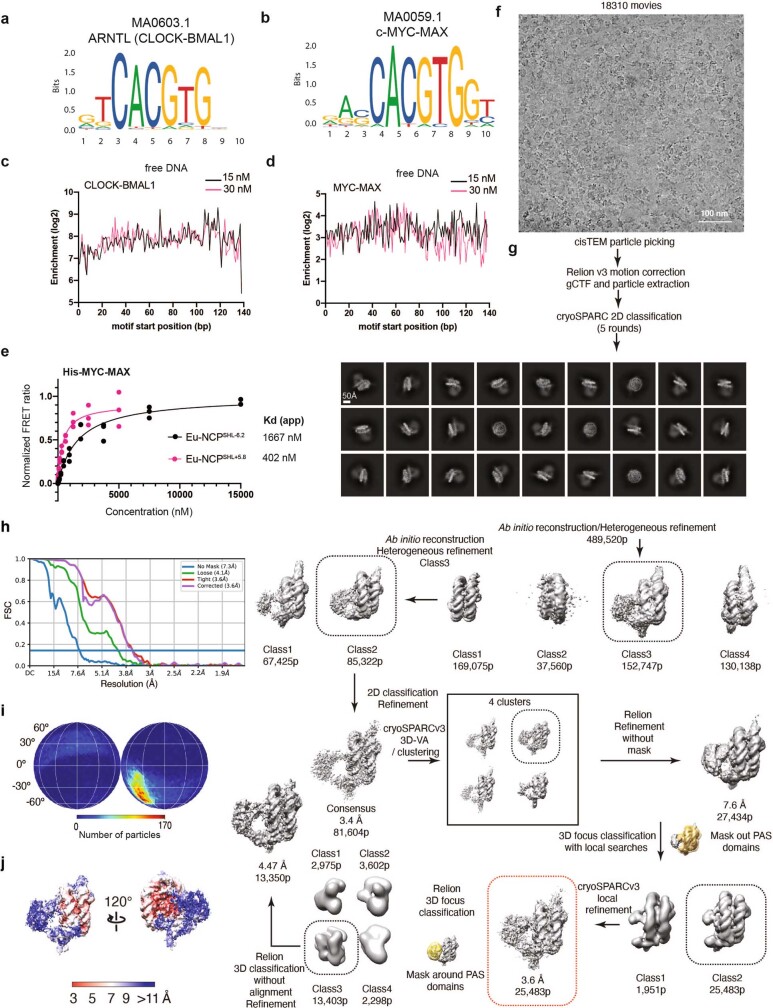
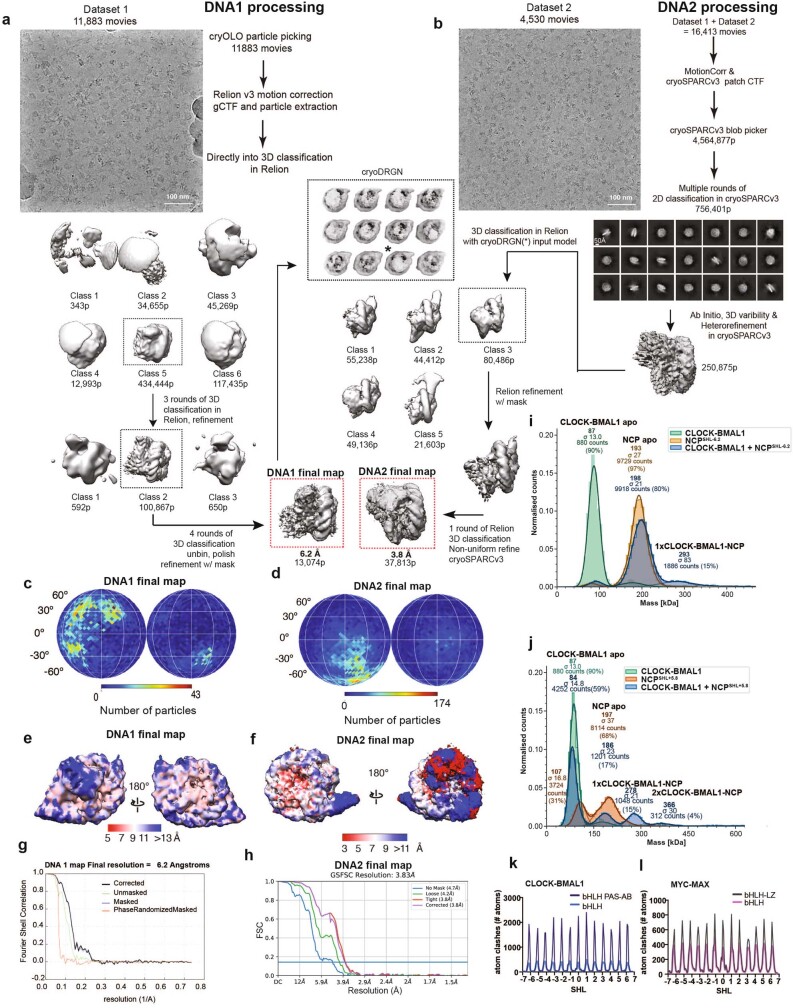
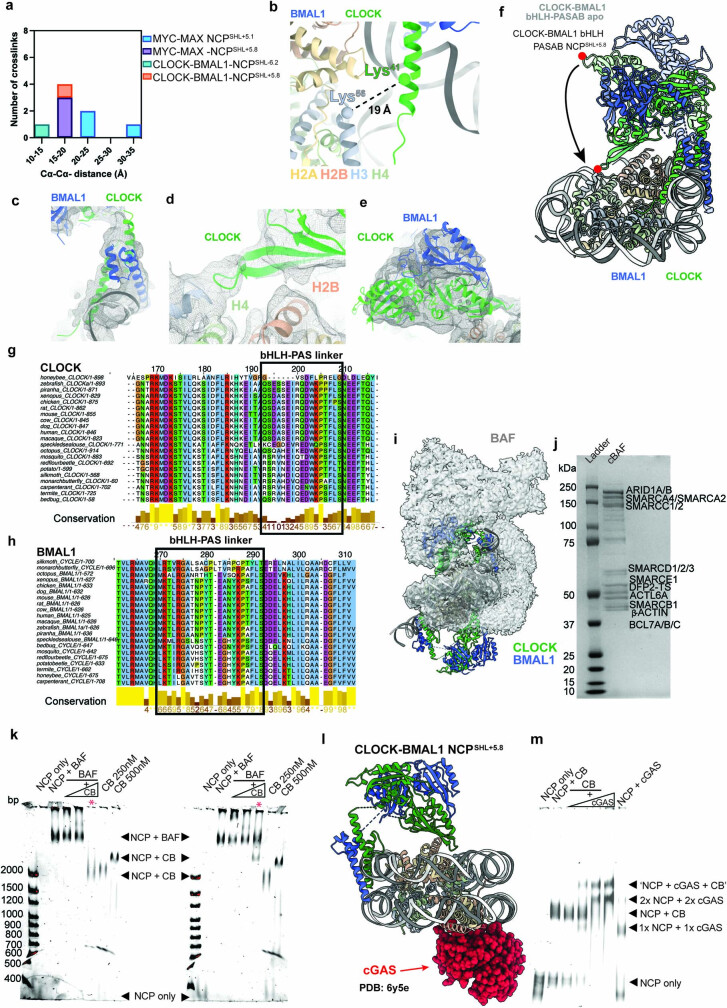
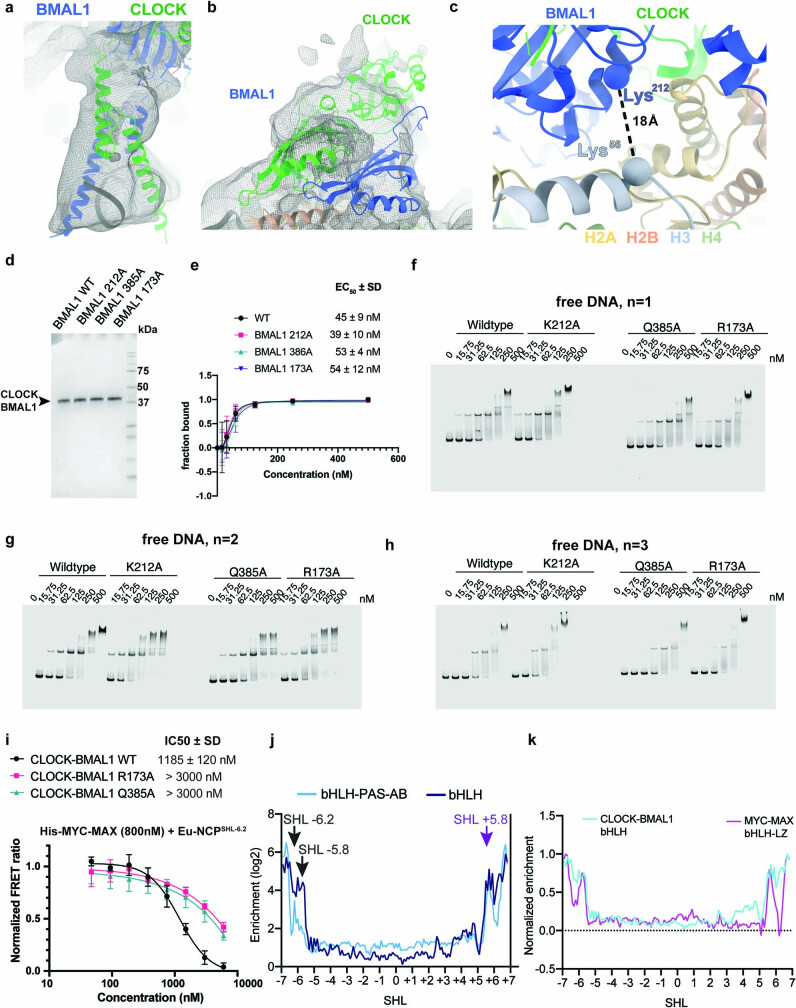
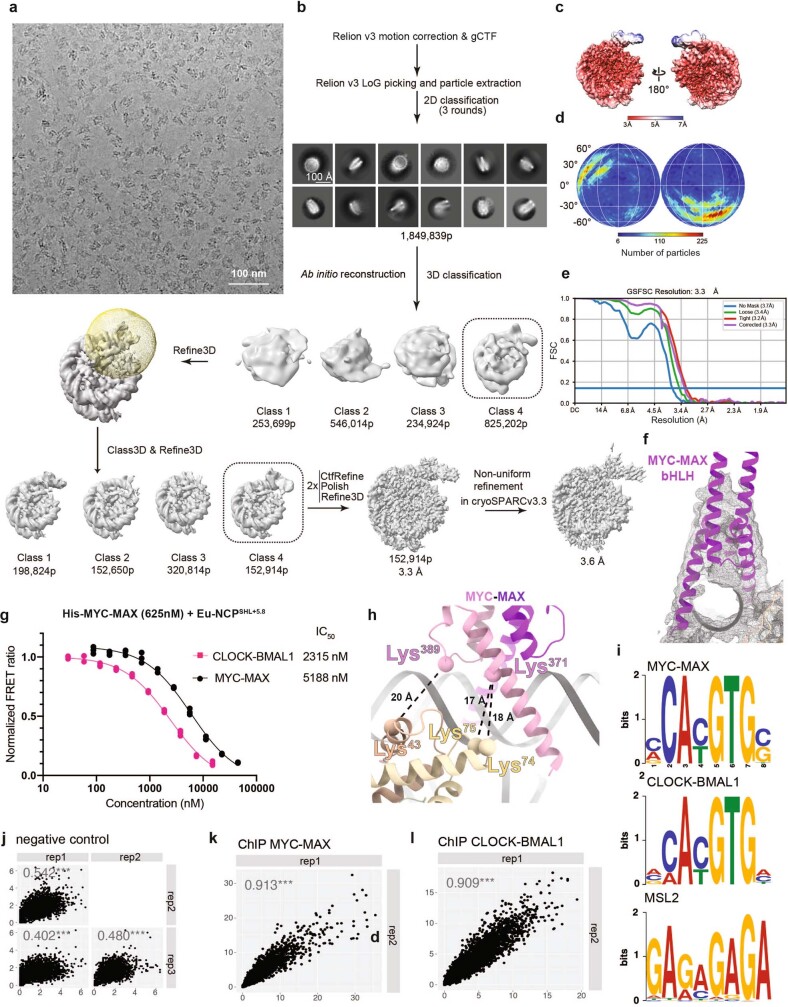
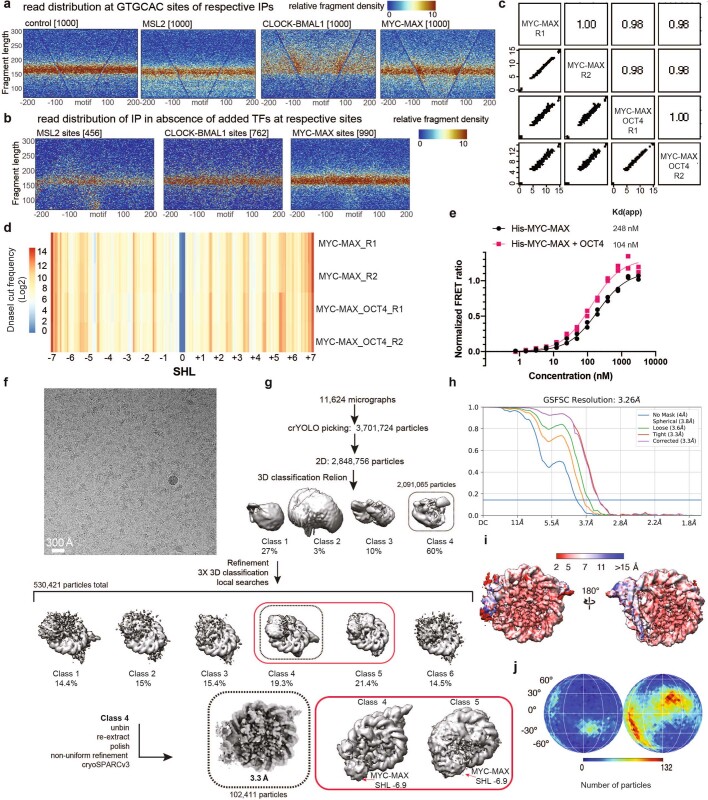
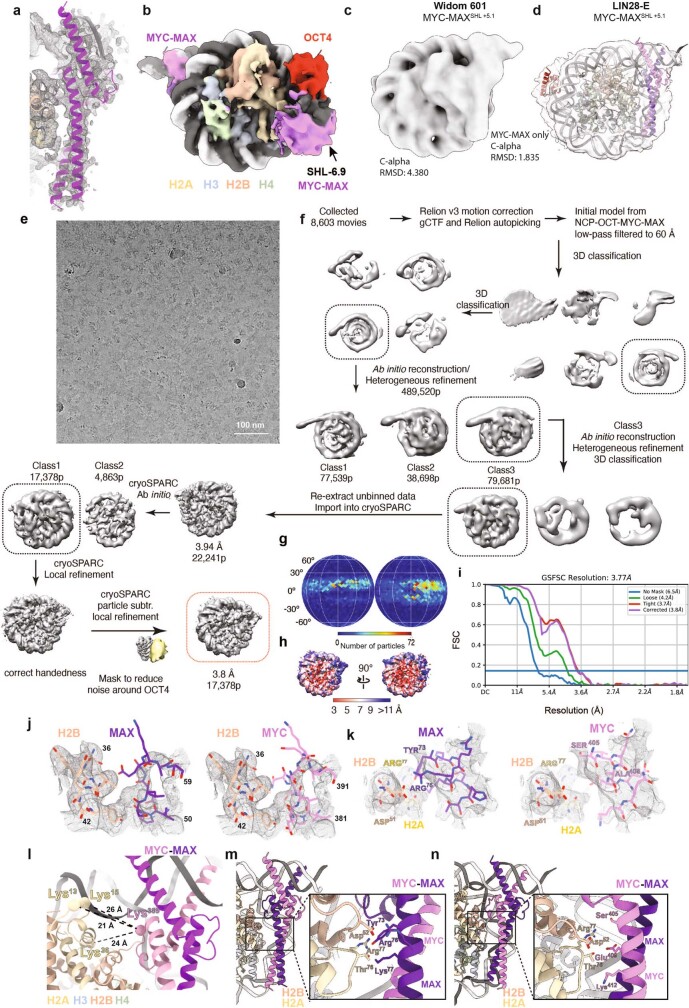
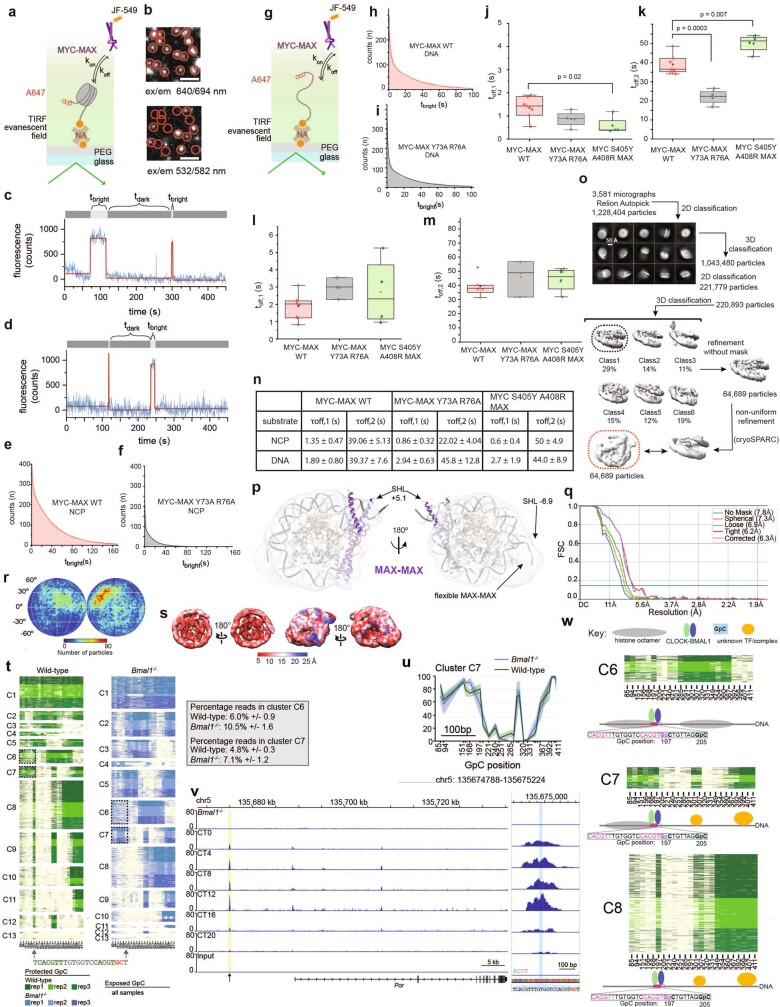
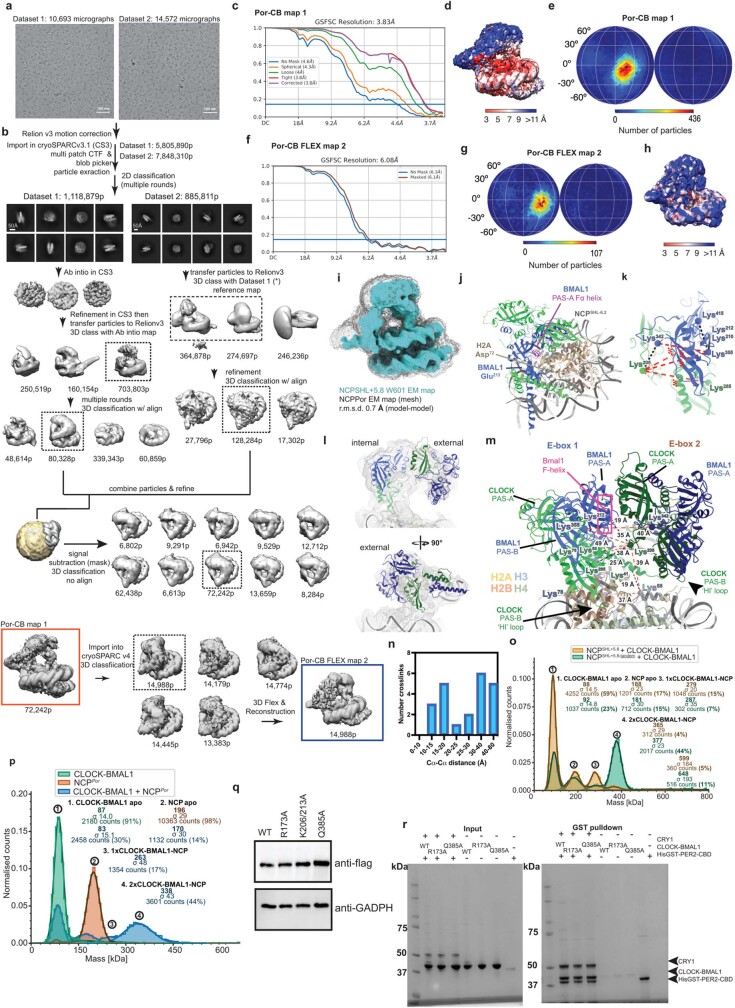
The basic helix-loop-helix (bHLH) family of transcription factors recognizes DNA motifs known as E-boxes (CANNTG) and includes 108 members1. Here we investigate how chromatinized E-boxes are engaged by two structurally diverse bHLH proteins: the proto-oncogene MYC-MAX and the circadian transcription factor CLOCK-BMAL1 (refs. 2,3). Both transcription factors bind to E-boxes preferentially near the nucleosomal entry-exit sites. Structural studies with engineered or native nucleosome sequences show that MYC-MAX or CLOCK-BMAL1 triggers the release of DNA from histones to gain access. Atop the H2A-H2B acidic patch4, the CLOCK-BMAL1 Per-Arnt-Sim (PAS) dimerization domains engage the histone octamer disc. Binding of tandem E-boxes5-7 at endogenous DNA sequences occurs through direct interactions between two CLOCK-BMAL1 protomers and histones and is important for circadian cycling. At internal E-boxes, the MYC-MAX leucine zipper can also interact with histones H2B and H3, and its binding is indirectly enhanced by OCT4 elsewhere on the nucleosome. The nucleosomal E-box position and the type of bHLH dimerization domain jointly determine the histone contact, the affinity and the degree of competition and cooperativity with other nucleosome-bound factors.


Conflict of interest statement

The authors declare no competing interests.

Figures

Fig. 1
Fig. 1. CLOCK-BMAL1 and MYC-MAX are nucleosome end-binders.
a, Domain schematic of bHLH TFs. The yellow box highlights the construct boundaries used in this study. MB1, MYC box 1; MB2, MYC box 2; TAD, transactivation domain. b,c, SeEN-seq profile of CLOCK-BMAL1 (mouse CLOCK residues 26–395; mouse BMAL1 residues 62–441) (b) or MYC-MAX (human MYC residues 351–437; human MAX residues 22–102) (c). The predicted atomic clash of the corresponding TF with the NCP is overlaid (grey). Values are shown as an average of independent replicates (n = 3). The SHLs indicate where the DNA major groove faces towards the histones. The indicated SHL of the E-box corresponds to the centroid of the motif CACGTG (see also Methods). Internal sites are defined as positions with a free energy of DNA unwrapping greater than around 1.2 kcal mol−1 between SHL−5 and SHL+5 (refs. ,). d, Overlay of CLOCK-BMAL1 SeEN-seq profile with MYC-MAX. The highest value of each enrichment profile is normalized to 1. Dashed grey lines indicate regions of high atomic clash for both TFs. e, Structure of a human NCP (Protein Data Bank (PDB): 6T93) with the DNA coloured according to the normalized CLOCK-BMAL1 SeEN-seq profile. ‘Hotspots’ of histone interaction are annotated,. f, Cryo-EM map of CLOCK-BMAL1 bound to an E-box motif at SHL+5.8.
Fig. 2
Fig. 2. The PAS domains of CLOCK-BMAL1 interface with the histones.
a, The CLOCK-BMAL1 bHLH domain bound to SHL+5.8 releases DNA. b, Magnified view of the PAS-B domain of CLOCK at the histone interface (see also Fig. 1f). c, CLOCK-BMAL1 bHLH domain bound at SHL−6.2. The CLOCK-BMAL1 PAS domains are removed for clarity. d, Atomic model of CLOCK-BMAL1 bound to a nucleosomal E-box at SHL−6.2. e, Magnified view of CLOCK bound at SHL−6.2. The BMAL1 chain is removed for clarity. f, Magnified view of BMAL1 at SHL−6.2. The CLOCK chain is removed.
Fig. 3
Fig. 3. MYC-MAX bound at a solvent-exposed E-box releases DNA to accommodate its bHLH domain.
a, Comparison of the DNA trajectory of an unbound (light blue) nucleosome to an MYC-MAX-bound (grey) nucleosome. b,c, Overall model of MYC-MAX bound to a nucleosome at SHL−6.2 (b) as compared to the model CLOCK-BMAL1 (c). MYC-MAX engages its motif without histone contacts, whereas CLOCK-BMAL1 interacts with histones H2B, H3 and H4 through the CLOCK PAS-B domain.
Fig. 4
Fig. 4. OCT4 facilitates MYC-MAX access at internal positions.
a, Timeline of the experiment. b, Schematic for interpretation of V-plots. Each dot represents a sequencing read where the location of its midpoint is plotted in relation to the motif (x axis) and its size (y axis). The graph cumulates all reads from each peak and represents them as a colour-coded density plot. c, V-plots of ChIP–seq experiments centred to their binding motif. Fragment sizes are plotted relative to their location around the motif. Numbers in brackets indicate the number of binding sites scored in each experiment. d, Schematic representation of the DNA sequence, containing two E-box sites (purple) and one OCT4 site (red). e, The difference in DNaseI digestion across the nucleosome, in the presence of OCT4 and MYC-MAX as compared to MYC-MAX alone. f, Cryo-EM map of OCT4 and MYC-MAX at a resolution of 3.8 Å. g, Model of MYC-MAX bound at SHL+5.1. Histone arginine residues (shown as spheres) engage DNA in the uncomplexed canonical nucleosome structure.
Fig. 5
Fig. 5. CLOCK-BMAL1 uses protein–protein interactions to engage an endogenous locus.
a, SMF was performed in mouse liver at the Por gene (chr. 5: 135674788–135675224). Sequencing reads were clustered on the basis of DNA protection profiles at every GpC. Two clusters (C6 and C7) showed increased DNA protection of a nucleosome-sized fragment encompassing tandem E-boxes targeted by CLOCK-BMAL1 (see also Extended Data Fig. 8t–w). The graph shows the percentage of protection at each GpC for cluster C6, with the lines and shaded area representing the average ± s.e.m. of three biological replicates for wild-type (green) and Bmal1−/− (blue) mice. The grey arrow at position 197 points to the GpC directly downstream of E-box 2, marked in red. The dashed red box illustrates an increase of DNA protection over 112 bp that is suggestive of a nucleosome and is the DNA sequence used for cryo-EM. b, Cryo-EM map of the Por nucleosome-bound by two protomers of CLOCK-BMAL1. c, The BMAL1 PAS-A Fα helix of the internal protomer (E-box 1) interfaces with the PAS domains of the external protomer at E-box 2. The E-box 2 protomer is depicted as a cryo-EM map segment (Segger, ChimeraX). df, PER2::LUC expression from Bmal1−/− Per2::Luc mouse fibroblast cells stably reconstituted with wild-type (WT) or mutant Bmal1 (d), presented as relative light units (RLU). There are significant differences in period (e) and damping (f) of the PER2 oscillation. n = 3 biological replicates, mean ± s.e.m. One-way ANOVA, Dunnett’s multiple comparisons test (two sided). *P ≤ 0.05, **P ≤ 0.01, ***P ≤ 0.001, ****P ≤ 0.0001. For period analysis (e), WT versus R173A is P = 0.0001, and WT versus Q385A is P = 0.0009. For damping analysis (f), WT versus F-helix is P < 0.0001.
Extended Data Fig. 1
Extended Data Fig. 1. Interactions between bHLH TFs and E-boxes are influenced by histones.
a, Motif logo for BMAL1 (ARNTL) from the Jaspar database. b, MYC motif logo from the Jaspar database. c,d, SeEN-seq enrichment profile of CLOCK-BMAL1 bHLH PAS-AB (c) and MYC-MAX (d) in the presence of the free DNA library pool (no histones) at two different protein concentrations, 15 and 30 nanomolar (nM). The same DNA library was used to assemble nucleosomes and perform SeEN-seq as in Fig. 1b, c. e, Binding preferences in TR-FRET are consistent with enrichment in SeEN-seq, where MYC-MAX shows a higher enrichment at SHL+5.8 (log2: 3.5) versus SHL-6.2 (log2: 2.2). Incubation of biotinylated NCPs (NCPSHL-6.2 and NCPSHL+5.8) with LANCE Eu-W8044 streptavidin (donor) with increasing amounts of His-MYC-MAX bound by an Ultra ULight α-6×His antibody (acceptor). Three technical replicates are shown for each condition and three biological replicates were performed with similar results. The signal was corrected for direct acceptor excitation by subtracting the signal observed in the absence of the nucleosome. The resulting raw signals were fitted to the Bmax values of 1 using a one-site specific binding model using Prism 7 (GraphPad). f, Representative cryo-EM micrograph of 18,310 individual micrographs collected. Denoised with Janni. g, See Methods. The movies were pre-processed within cryoFLARE and the resulting micrographs were imported in cisTEM for particle picking. 3D variability analysis (cryoSPARC v.3) in combination with 3D classification (RELION) resulted in a homogeneous subset of particles that were used for the final 3D reconstruction. The boxes defined by a dashed line indicate the good models and set of particles used for the following step in the data processing workflow. h, Gold-standard FSC curve for the 3.6 Å resolution map is highlighted by the red dashed box in g. i, Angular distribution for the particles leading to the 3.6 Å resolution map. j, Local-resolution filtered map (MonoRes) for the 3.6 Å resolution map highlighted by the red dashed box shown in g (ref. ).
Extended Data Fig. 2
Extended Data Fig. 2. CLOCK-BMAL1-NCPSHL-6.2 cryo-EM processing.
a,b, Representative cryo-EM micrographs for datasets 1 (a) and 2 (b) denoised with Janni and processing (see also Methods). The movies of dataset 1 were pre-processed within cryoFLARE and the particles were picked using crYOLO. Multiple rounds of 3D classification (RELION 3.1). The boxes defined by a dashed line indicate the good models and set of particles used for the following step in the workflow. Particles from a classification in RELION (100,867 particles) were further analysed using cryoDRGN, and the map indicated in the asterisk (*) was used as an input model for 3D classification of the combined datasets 1 and 2. After merging, particles were picked with cryoSPARC v.3 blob picker. Multiple rounds of 2D classification (cryoSPARC v.3) and 3D classification yielded a homogeneous subset of particles. c,d, Angular distribution for the particles leading to the 6.2 Å (c) and 3.8 Å (d) resolution map. e,f, Local-resolution filtered map (MonoRes) for the 6.2 Å (e) and 3.8 Å (f) resolution map. g,h, Gold-standard FSC curve for the 6.2 Å (g) and 3.8 Å (h) resolution map. i,j Molecular mass distribution histogram of CLOCK-BMAL1-NCPSHL-6.2 (i) and CLOCK-BMAL1-NCPSHL+5.8 (j). CLOCK-BMAL1 and the nucleosomes were first measured individually at 20 nM and in a 1:6 ratio. CLOCK-BMAL1 and NCPSHL-6.2 form a 1:1 complex, whereas for NCPSHL+5.8 a minority species with a 1:2 stoichiometry is also observed. k, The CLOCK-BMAL1 bHLH domain only free-DNA-bound structure (PDB: 4h10) or the composite bHLH-PAS-AB model (PDB: 4F3L, 4H10) was superimposed on a nucleosome template model (PDB: 6T93) in all DNA registers, and a clash score was calculated as the total number of atoms in the bHLH domain closer than 1 Å to nucleosome atoms (see also Methods). l, The clash score of the MYC-MAX bHLH domain only (PDB: 1NKP, Uniprot human residues 351–411 for MYC, 22–54 for MAX) or the composite bHLH-LZ model (PDB: 1NKP, entire chains of one heterodimer) to the nucleosome was calculated as in k.
Extended Data Fig. 3
Extended Data Fig. 3. CLOCK-BMAL1 competes with chromatin binders that bind both acidic patches.
a, Bar graph showing the number of cross-links obtained for the cryo-EM structures as a function of the obtained cross-link distances. b, Cross-link between histone H3 and CLOCK bHLH lysines (spheres). The cross-linker was DSSO and indicated distances (dashes) are between lysine Cα atoms. ce, Map density around CLOCK-BMAL1 bHLH (c), interface between CLOCK PAS-B HI loop and H3α1 L1 (d) and PAS domains (e) at position SHL+5.8. The contour levels are 5.98 (c), 5.92 (d) and 5.86 (e). Maps were postprocessed by low-pass filtering or model-based local amplitude scaling (LocScale). f, Alignment of the CLOCK-BMAL1 bHLH-PAS-AB crystal structure (apo) onto the CLOCK-BMAL1 bHLH-PAS-AB-nucleosome-bound structure at SHL+5.8. The alignment was performed by Needleman-Wunsch using the bHLH residues 29–89 of CLOCK in ChimeraX. The interaction of the PAS domains with the histone octamer is accommodated by flexible linkers (22 residues in BMAL1, 17 residues in CLOCK) connecting the PAS-AB domains and the bHLH domains. g,h, Sequence alignment of CLOCK (g) and BMAL1 (h) proteins across species using a multiple sequence alignment. Amino acid conservation is coloured according to Clustal using JalView. i, Overlay of CLOCK-BMAL1 at SHL±5.8 with the map of a BAF-bound nucleosome (EMD-0974). j, SDS–PAGE of BAF after size-exclusion chromatography. k, EMSA competition assays between CLOCK-BMAL1 (CB) and BAF. The NCP (20 nM) was incubated with either, BAF only (100 nM), BAF (100 nM) with increasing amounts of CLOCK-BMAL1 (125 nM, 250 nM and 500 nM) or with CLOCK-BMAL1 only (250 nM, 500 nM). Three independent replicates were performed and two representative EMSAs are shown. Asterisk (*) indicates the lane where competition is most evident with the appearance of a CLOCK-BMAL1-NCP complex. l, Model of CLOCK-BMAL1 (at SHL+5.8) and cGAS (PDB: 6y5e) co-binding a nucleosome. m, EMSA competition assays between CLOCK-BMAL1 and the immune signalling sensor cGAs. The NCP was incubated with either CLOCK-BMAL1 (250 nM), CLOCK-BMAL1 with increasing amounts of cGAS (18.75 nM, 37.5 nM, 75 nM and 150 nM) or cGAS (75 nM). 3 independent biological replicates were performed, and one representative replicate is shown. A higher-running band that is likely to correspond to a higher-order CLOCK-BMAL1-cGAS-NCP complex is observed when titrating cGAS to the CLOCK-BMAL1-NCP complex.
Extended Data Fig. 4
Extended Data Fig. 4. The PAS domains of CLOCK-BMAL1 contribute specifically to nucleosome binding.
a,b, Map density around CLOCK-BMAL1 (a) bHLH and (b) PAS domains. The contour levels are 0.00192 (a) and 0.00137 (b). Maps were postprocessed by low-pass filtering or model-based local amplitude scaling (LocScale). c, Cross-link between BMAL1 PAS-A and histone H3 lysines (spheres). The cross-linker was DSSO and distances (dashes) are between lysine Cα atoms. d, The CLOCK-BMAL1 bHLH PAS-AB heterodimer wild-type (WT) and mutants (K212A, Q385A, R173A) were purified (Methods) and equal concentrations (1 µM, 10 µl) were analysed by SDS–PAGE and stained with Coomassie. Subsequent EMSAs and FRET were performed assuming these concentrations. e, BMAL1 mutations K212A, Q385A and R173A have minimal effect on free DNA binding. Quantification of free DNA binding (n = 3 biological replicates shown as mean ±SD) to the Cy5-labelled-SHL-6.2 DNA sequence using electrophoretic mobility shift assays (EMSA) in the presence of CLOCK-BMAL1 bHLH-PAS-AB WT or mutant proteins as seen in d. The three biological replicates are shown in fh. Gels were imaged using a Licor instrument and quantified using the Empiria software package. The fraction bound is calculated as a percentage of the unbound probe. i, BMAL1 mutations Q385A and R173A show reduced nucleosome binding as compared to wild-type. TR-FRET counter-titration of unlabelled CLOCK-BMAL1 WT and mutants into the preassembled Eu-NCPSHL-6.2-His-MYC-MAX complex. Three technical replicates are shown for each condition, and three biological replicates were performed with similar results. j, SeEN-seq of CLOCK-BMAL1 containing the PAS domains (bHLH PAS-AB) and the bHLH region only (bHLH). k, Overlay of the CLOCK-BMAL1 bHLH only SeEN-seq with MYC-MAX bHLH LZ (as shown in Fig. 1d). The highest value of each enrichment profile is normalized to 1. Mouse BMAL1 bHLH includes residues 73–135 and mouse CLOCK bHLH includes residues 29–89.
Extended Data Fig. 5
Extended Data Fig. 5. MYC-MAX and CLOCK-BMAL1 bind in proximity to nucleosomes.
a, Representative cryo-EM micrograph of 8,841 total, denoised with Janni. b, The movies were motion-corrected in RELION and the particles were picked using LoG picking (RELION). Multiple rounds of 2D and 3D classification (RELION) yielded a homogeneous subset of particles used for the final 3D reconstruction. The boxes defined by a dashed line indicate the good models and set of particles used for the following step in the data processing workflow. c, Local-resolution filtered map (MonoRes) for the 3.3 Å resolution map. d, Angular distribution for the particles leading to the 3.3 Å resolution map. e, Gold-standard FSC curve for the final 3.3 Å resolution map. f, Map density around MYC-MAX at position SHL+5.8, contoured at 0.0948 (map postprocessed by LocScale). g, CLOCK-BMAL1 binds NCPSHL+5.8 with higher affinity than MYC-MAX. TR-FRET counter-titration of unlabelled CLOCK-BMAL1 or MYC-MAX into the preassembled Eu-NCPSHL+5.8-His-MYC-MAX complex. Three technical replicates are shown for each condition and three biological replicates were performed with similar results. h, Cross-links between MYC and H2A and H2B lysines (spheres). The cross-linker was DSSO and indicated distances (dashes) are between lysine Cα atoms. i, Position weight matrices (PWMs) of the binding motifs found within the peaks of each ChIP–seq profile as determined by MEME motif discovery (-mod anr -dna -revcom). jl, Replication correlation analysis for the ChIP–seq samples used in Fig. 4c. The D. melanogaster genome (dm6) was queried for 5,000 hits of the E-box motif CACGTG. Read counts at each motif were normalized, counted for each replicate and replicates were compared in scatter plots. The correlation coefficients are indicated with two-tailed Pearson P values annotated at P < 0.1 (*), 0.05 (**) and 0.01 (***).
Extended Data Fig. 6
Extended Data Fig. 6. OCT4 facilitates MYC-MAX binding at SHL+5.1.
a, Controls for non-specific effects of added TFs. V-plots of ChIP–seq experiments of the α-SpyTag control (no protein added), MSL2, CLOCK-BMAL1 and MYC-MAX centred at the reverse motif (GTGCAC). Fragment sizes are plotted relative to their location around 1,000 randomly chosen genomic motifs. The thin V-shape originates from the protection of these sites by an unknown protein present in DREX. b, Fragment distributions at E-box motifs analysed in Fig. 4c in the absence of added TFs. V-plots of ChIP–seq experiments with the α-SpyTag without added TFs at the peaks called in the respective IPs (see Fig. 4c). Fragment sizes are plotted relative to their location around the motif. Numbers in brackets indicate the number of binding sites scored in each experiment. c, Pairwise correlations of DNaseI measurements, separated by protein condition. d, DNaseI digestion profile across nucleosomes in the presence of MYC-MAX or MYC-MAX and OCT4. Two replicates are shown. e, Comparison of His-MYC-MAX binding to NCPSHL+5.1 in the presence and absence of OCT4. Incubation of biotinylated NCPs with LANCE Eu-W8044 streptavidin (donor) with increasing amounts of His–MYC-MAX bound by an Ultra Light α-6×His antibody (acceptor) in the presence or absence of OCT4. Two representative technical replicates are shown for each condition, and four biological replicates were performed with similar results. The signal was corrected for direct acceptor excitation by subtracting the signal observed in the absence of the nucleosome. The resulting raw signals were normalized to the individual Bmax values, and binding curves were fit using a one-site specific binding model. f, Representative cryo-EM denoised with Janni of 11,624 total micrographs. g, See Methods. The movies were pre-processed within cryoFLARE and the particles were picked using crYOLO. Multiple rounds of 3D classification yielded a homogeneous subset of particles that were used for the final 3D reconstruction. The boxes defined by a dashed line indicate the good models and set of particles used for the following step in the data processing workflow. h, Gold-standard FSC curve for the 3.3 Å resolution map highlighted by the dashed box shown in c. i, Local-resolution filtered map (MonoRes) for the 3.3 Å resolution map. The highest resolution was found around the NCP ranging from 2–5 Å, whereas for OCT4 and MYC-MAX the resolution ranged between 5 Å and 11 Å. j, Angular distribution for the particles leading to the 3.3 Å resolution map.
Extended Data Fig. 7
Extended Data Fig. 7. MYC-MAX and OCT4 cooperatively bind to a nucleosome by releasing nucleosomal DNA.
a, Map density around MYC-MAX at position SHL+5.1, contoured at 0.0121 (map postprocessed by LocScale). b, A second diffuse MYC-MAX heterodimer is present in some classes (see also Extended Data Fig. 6g) at SHL-6.9. c,d, Comparison of OCT4–MYC-MAX-Widom 601 (c) and the OCT4–MYC-MAX-LIN28-E nucleosome (d) complexes. e, Representative cryo-EM micrograph of 8,603 micrographs, denoised with Janni. f, Processing scheme. The movies were pre-processed with cryoFLARE and the resulting movies were imported in RELION for motion correction, CTF estimation and particle picking. Ab-initio (cryoSPARC) in combination with 3D classification (RELION) resulted in a homogenous subset of particles that were used for the final 3D reconstruction. The boxes defined by dashed line indicate the good models and set of particles used for the following step in the data processing workflow. g, Angular distribution for the particles leading to the 3.8 Å resolution map. h, Local-resolution filtered map (MonoRes) highlighted by red dashed box shown in f. i, Gold-standard FSC curve for the 3.8 Å resolution map highlighted by the red dashed box shown in f. j, Map density around the interface between the basic loop of MYC or MAX and H2B, contoured at 0.13. k, Map density around a contact between MYC or MAX and H2B/H2A, contoured at 0.096. Maps were postprocessed by LocScale. Residues Tyr73 and Arg76 in MAX were mutated to Ala and residues Ser405 and Ala408 in MYC were mutated to Tyr and Arg, respectively to mimic the residues in MAX, making MYC more MAX-like for smTIRF experiments (see also Extended Data Fig. 8a–n). l, Cross-link between MYC basic loop and H2A lysines (spheres). The cross-linker was DSSO and indicated distances (dashes) are between lysine Cα atoms. m,n, Close-up of the TF–histone interface for both MYC-MAX orientations, highlighting potentially contacting residues between H2A/H2B and the LZ. Side-chain rotamers, shown here, are modelled, as clear density was missing.
Extended Data Fig. 8
Extended Data Fig. 8. TF–histone contacts are relevant in vitro and in vivo.
a, Scheme of the experiment: MYC-MAX (WT or mutant), labelled with JF549, is injected into flow cells containing immobilized Alexa647-labelled NCPs. Dynamic MYC-MAX binding events are detected by colocalization single-molecule (sm) TIRF imaging. b, Detection of DNA or nucleosome (NCP) localizations using smTIRFM in 640/694 nm channel and single MYC-MAX binding events are detected at DNA positions by smTIRFM in 532/582 nm channel, through a colocalization algorithm. Scale bars: 2 μm. The images are representative of 3 independent experiments. The statistical details for each experiment are listed with the quantification of the signal. c, Extracted fluorescence time trace for 2 nM MYC-MAX WT, showing stochastic binding events to NCPs. d, Fluorescence time trace for MYC-MAXY73A,R76A binding to NCPs. e, Dwell-time histogram for MYC-MAX WT binding to NCPs. For fit results, yielding two dwell times (τoff,1; τoff,2) see j, k. f, Dwell-time histogram for MYC-MAXY73A,R76A binding NCPs. For fit results, yielding two dwell times (τoff,1; τoff,2) see j,k. g, Scheme of the experiment: MYC-MAX (WT or mutant) with Alexa647-labelled DNA. h, Dwell-time histogram for MYC-MAX WT binding to DNA. For fit results, yielding two dwell times (τoff,1; τoff,2) see l,m. i, Dwell-time histogram for MYC-MAXY76A,R73A binding to DNA. For fit results, yielding two dwell times (τoff,1; τoff,2) see l,m. j,k, Dwell times (τoff,1; τoff,2) for MYC-MAX WT, MYC-MAXY73A,R76A and MYCS405Y,A408R-MAX binding to NCPs. The indicated numbers are P values (two-tailed Student’s t-test, with n = 4 (MYC-MAXY73A,R76A), 7 (MYC-MAX WT) and 4 (MYCS405Y,A408R-MAX) ([independent experiments]). l,m, Dwell times (τoff,1; τoff,2) for MYC-MAX WT, MYC-MAXY73A,R76A and MYCS405Y,A408R-MAX binding to DNA. The indicated numbers are P values (two-tailed Student’s t-test, with n = 3 (MYC-MAXY73A,R76A), 6 (MYC-MAX WT) and 3 (MYCS405Y,A408R-MAX) ([independent experiments]). In jm the bottom of the boxes defines the first quartile (Q1 or 25th percentile), the middle indicates the median (Q2 or 50th percentile), and the top the third quartile of the data (Q3 or 75th percentile). Whiskers are extended up to the most extreme data point that is no more than 1.5 × IQR. All data points are shown for each box with a mean shown in white. n, Dwell times for MYC-MAX proteins binding to the different substrates. o, The movies were pre-processed with cryoFLARE and the resulting movies were imported in RELION for particle picking. Multiple rounds of 2D and 3D classification (RELION) resulted in a homogenous subset of particles used for the final 3D reconstruction. The boxes defined by dashed line indicate the good models and set of particles used for the following step in the data processing workflow. p, Overlay of the cryo-EM map of the MAX-MAX- (at SHL+5.1 and SHL−6.9) bound nucleosome and the model showing MAX-MAX bound at SHL+5.1. q, Gold-standard FSC curve for the 7 Å resolution map highlighted by the red dashed box shown in o. r, Angular distribution for the particles leading to the 7 Å resolution map. s, Local-resolution filtered map (MonoRes) highlighted by red dashed box shown in o. t, DNA protection analysis at a CLOCK-BMAL1 enhancer by SMF. SMF was performed in mouse liver at a distal enhancer of the gene Por (chr. 5:135674788–135675224). Heat maps displaying protection from GpC methylation on each single DNA molecules at that enhancer, with unprotected/methylated cytosines coloured in yellow, and protected/unmethylated cytosines coloured in green (WT mouse at zeitgeber time (ZT) 6 or blue (Bmal1−/− at ZT6). Shades of green and blue distinguish three biological replicates for each group. Reads from all 6 animals (n = 1,052 reads per sample) were clustered by the Binary Matrix Decomposition clustering algorithm in a total of 13 clusters. Each column illustrates protection at a single GpC, spanning 327 bp. The arrows at the bottom of the heat maps point to a GpC in a CLOCK-BMAL1 DNA-binding motif (E-box sequence shaded in green). The dashed boxes in clusters C6 and C7 indicate an enhanced protection region immediately upstream of a CLOCK-BMAL1 binding motif, suggesting protection by a nucleosome. For sequencing reads see Supplementary Table 3. Quantification of the percentage of reads ± s.e.m. in clusters C6 and C7 for both wild-type and Bmal1−/− mice. u, The graph displays the percentage of protection at each GpC for cluster C7, with the lines and shaded area representing the average ± s.e.m. of three biological replicates for wild-type (green) and Bmal1−/− (blue) mice. v, Genome browser view of BMAL1 ChIP–seq signal at Por gene locus in mouse liver. Sequencing data were retrieved from GSE39860. The arrow and yellow-shaded area point to the distal enhancer analysed by SMF. Zoom in the whole amplicon analysed by SMF (chr5:135674788–135675224), with the blue area indicating the location of CLOCK-BMAL1 DNA-binding motif. w, Schematic representation of predicted DNA-bound proteins corresponding to the observed footprints.
Extended Data Fig. 9
Extended Data Fig. 9. CLOCK-BMAL1 engages in protein–protein interactions on tandem E-boxes.
a, Representative cryo-EM micrographs from two collected datasets (10,693 micrographs, dataset 1; 14,572 micrographs, dataset 2) denoised with Janni. b,. Movies were motion-corrected in RELION v.3, then CTF correction, particle picking as well as multiple rounds of 2D classification were performed in cryoSPARC v.3.1. Particles from dataset 1 were used for 3D reconstruction and after refinement, were transferred into RELION. They were used as an input model for 3D classification of dataset 2 in RELION. After multiple rounds of 3D classification and refinement both datasets were merged and subsequent 3D classification with signal subtraction and 3D Flex reconstruction yielded a homogeneous subset of particles. The boxes defined by the dashed line indicate the good models and set of particles used for the following step in the data processing workflow. c, Gold-standard FSC curve for the 3.8 Å resolution map highlighted by the red box in b. d, Local-resolution filtered map (MonoRes) for the 3.8 Å resolution map highlighted by the red box shown in b. e, Angular distribution for the particles leading to the 3.8 Å resolution map. f, Gold-standard FSC curve for the 6.1 Å resolution map highlighted by the blue box shown in b. g, Angular distribution for the particles leading to the 6.1 Å resolution map. h, Local-resolution filtered map (MonoRes) for the 6.1 Å resolution map highlighted by the blue box shown in b. i, Internal CLOCK-BMAL1 in Por map overlays well with the single CLOCK-BMAL1 heterodimer bound in the NCPSHL+5.8-W601 structure. j, F-alpha PAS-A helix of BMAL1 interfaces with the histones when CLOCK-BMAL1 binds at SHL-6.2. k, Sterically incompatible cross-links when mapped to the PAS domains of a single CLOCK-BMAL1 heterodimer. l, Map fit of tentative tandem CLOCK-BMAL1 model best compatible with cross-linking and cryo-EM data. The map is at 0.005. m, Tentative CLOCK-BMAL1 tandem model with putative inter-CLOCK-BMAL1 and CLOCK-BMAL1-histone cross-links mapped. Putative inter-CLOCK-BMAL1 cross-links would be sterically incompatible when mapped to a single heterodimer (see k). n, Distance distribution of cross-links mapped to the tandem CLOCK-BMAL1 model shown in panel m. o, Molecular mass distribution histogram of CLOCK-BMAL1-NCPSHL+5.8 (single E-box) and CLOCK-BMAL1-NCPSHL+5.8-tandem (2 E-boxes with 7-bp spacing as in the Por structure but with a 601 sequence). The tandem E-box arrangement increased the amount of CLOCK-BMAL1-bound complex from 19% to 51%. p, Molecular mass distribution histogram of CLOCK-BMAL1-NCPPor. q, Western blot comparing BMAL1 protein expression across reconstituted cell lines. The blot is representative of 3 biological replicates. r, GST pull-down assay performed by incubating His–GST-tagged CRY-binding domain of Per2 (His–GST-PER2-CBD) as bait with the prey proteins: photolyase homology region (PHR) of CRY1 and CLOCK-BMAL1 wild-type or mutant constructs. CLOCK and BMAL1 bHLH PAS-AB both are of very similar molecular weight, therefore, appear as one single band. The gel shown is representative of n = 3 independent experiments.

Similar articles

Cited by

References

    1. de Martin X, Sodaei R, Santpere G. Mechanisms of binding specificity among bHLH transcription factors. Int. J. Mol. Sci. 2021;22:9150. doi: 10.3390/ijms22179150. - DOI - PMC - PubMed
    1. Nair SK, Burley SK. X-ray structures of Myc-Max and Mad-Max recognizing DNA: molecular bases of regulation by proto-oncogenic transcription factors. Cell. 2003;112:193–205. doi: 10.1016/S0092-8674(02)01284-9. - DOI - PubMed
    1. Huang N, et al. Crystal structure of the heterodimeric CLOCK:BMAL1 transcriptional activator complex. Science. 2012;337:189–194. doi: 10.1126/science.1222804. - DOI - PMC - PubMed
    1. McGinty RK, Tan S. Principles of nucleosome recognition by chromatin factors and enzymes. Curr. Opin. Struct. Biol. 2021;71:16–26. doi: 10.1016/j.sbi.2021.05.006. - DOI - PMC - PubMed
    1. Rey G, et al. Genome-wide and phase-specific DNA-binding rhythms of BMAL1 control circadian output functions in mouse liver. PLoS Biol. 2011;9:e1000595. doi: 10.1371/journal.pbio.1000595. - DOI - PMC - PubMed

MeSH terms