. 2023 Aug;620(7973):393-401.
doi: 10.1038/s41586-023-06303-1. Epub 2023 Jul 5.

Therapy-induced APOBEC3A drives evolution of persistent cancer cells

Affiliations

Therapy-induced APOBEC3A drives evolution of persistent cancer cells

Hideko Isozaki et al. Nature. 2023 Aug.

Abstract

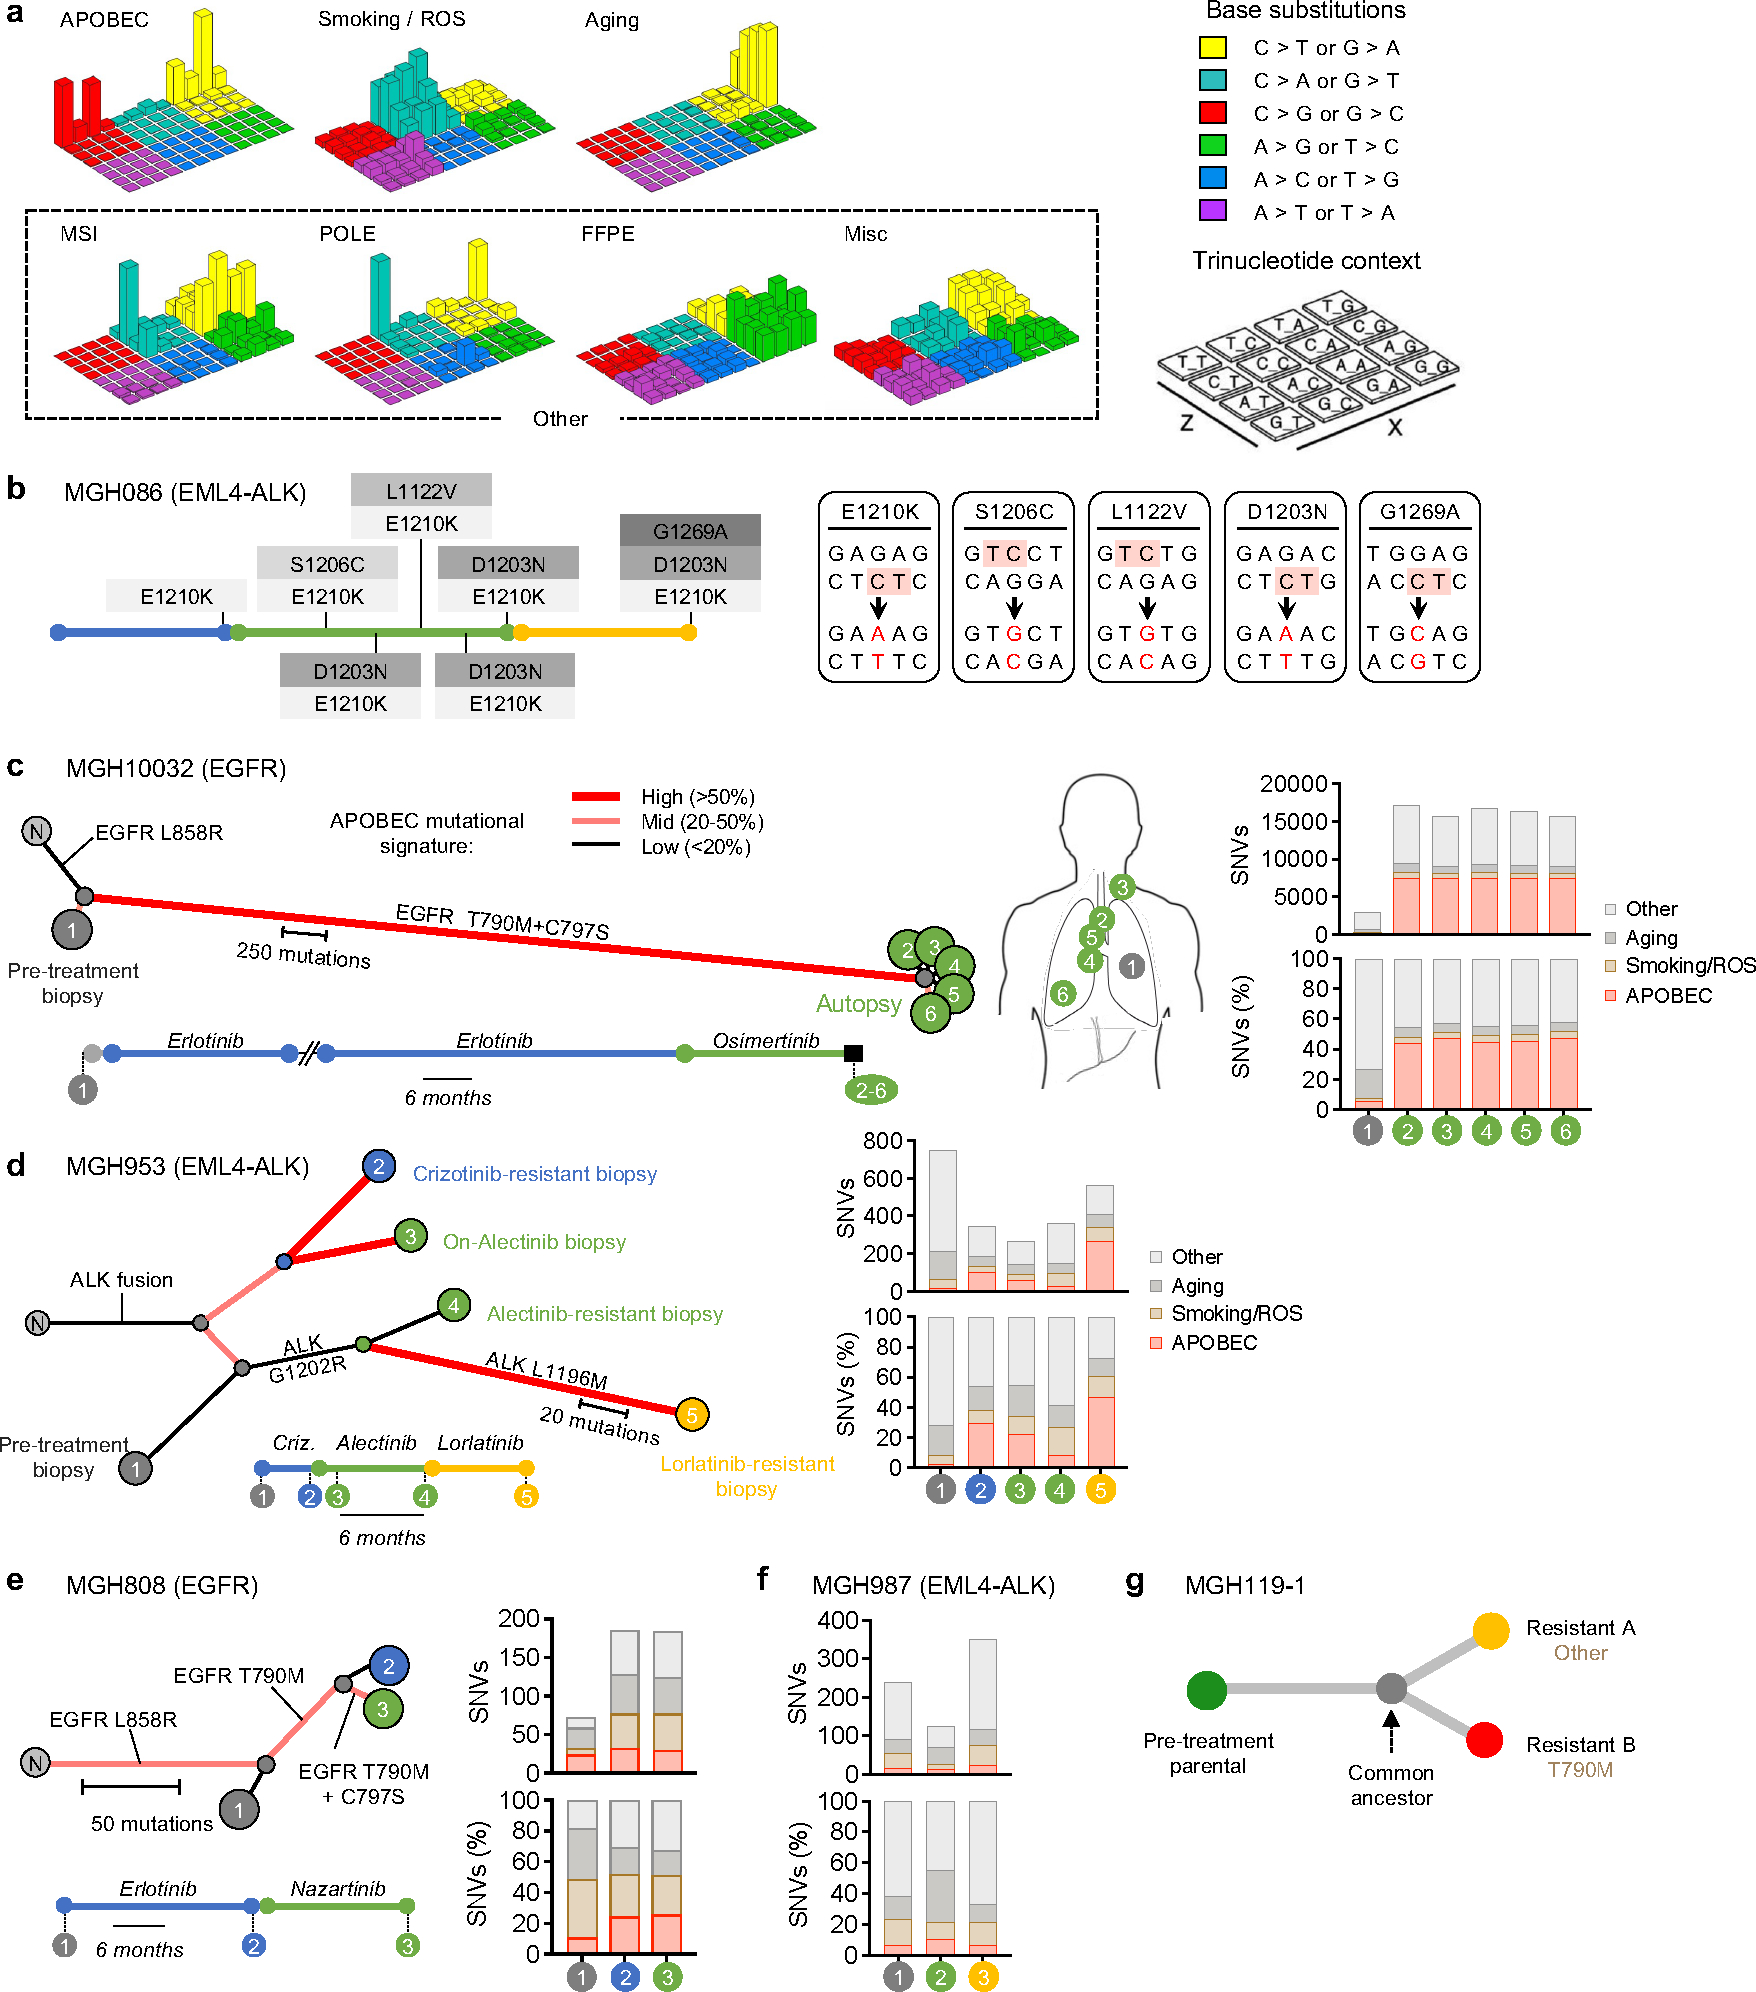
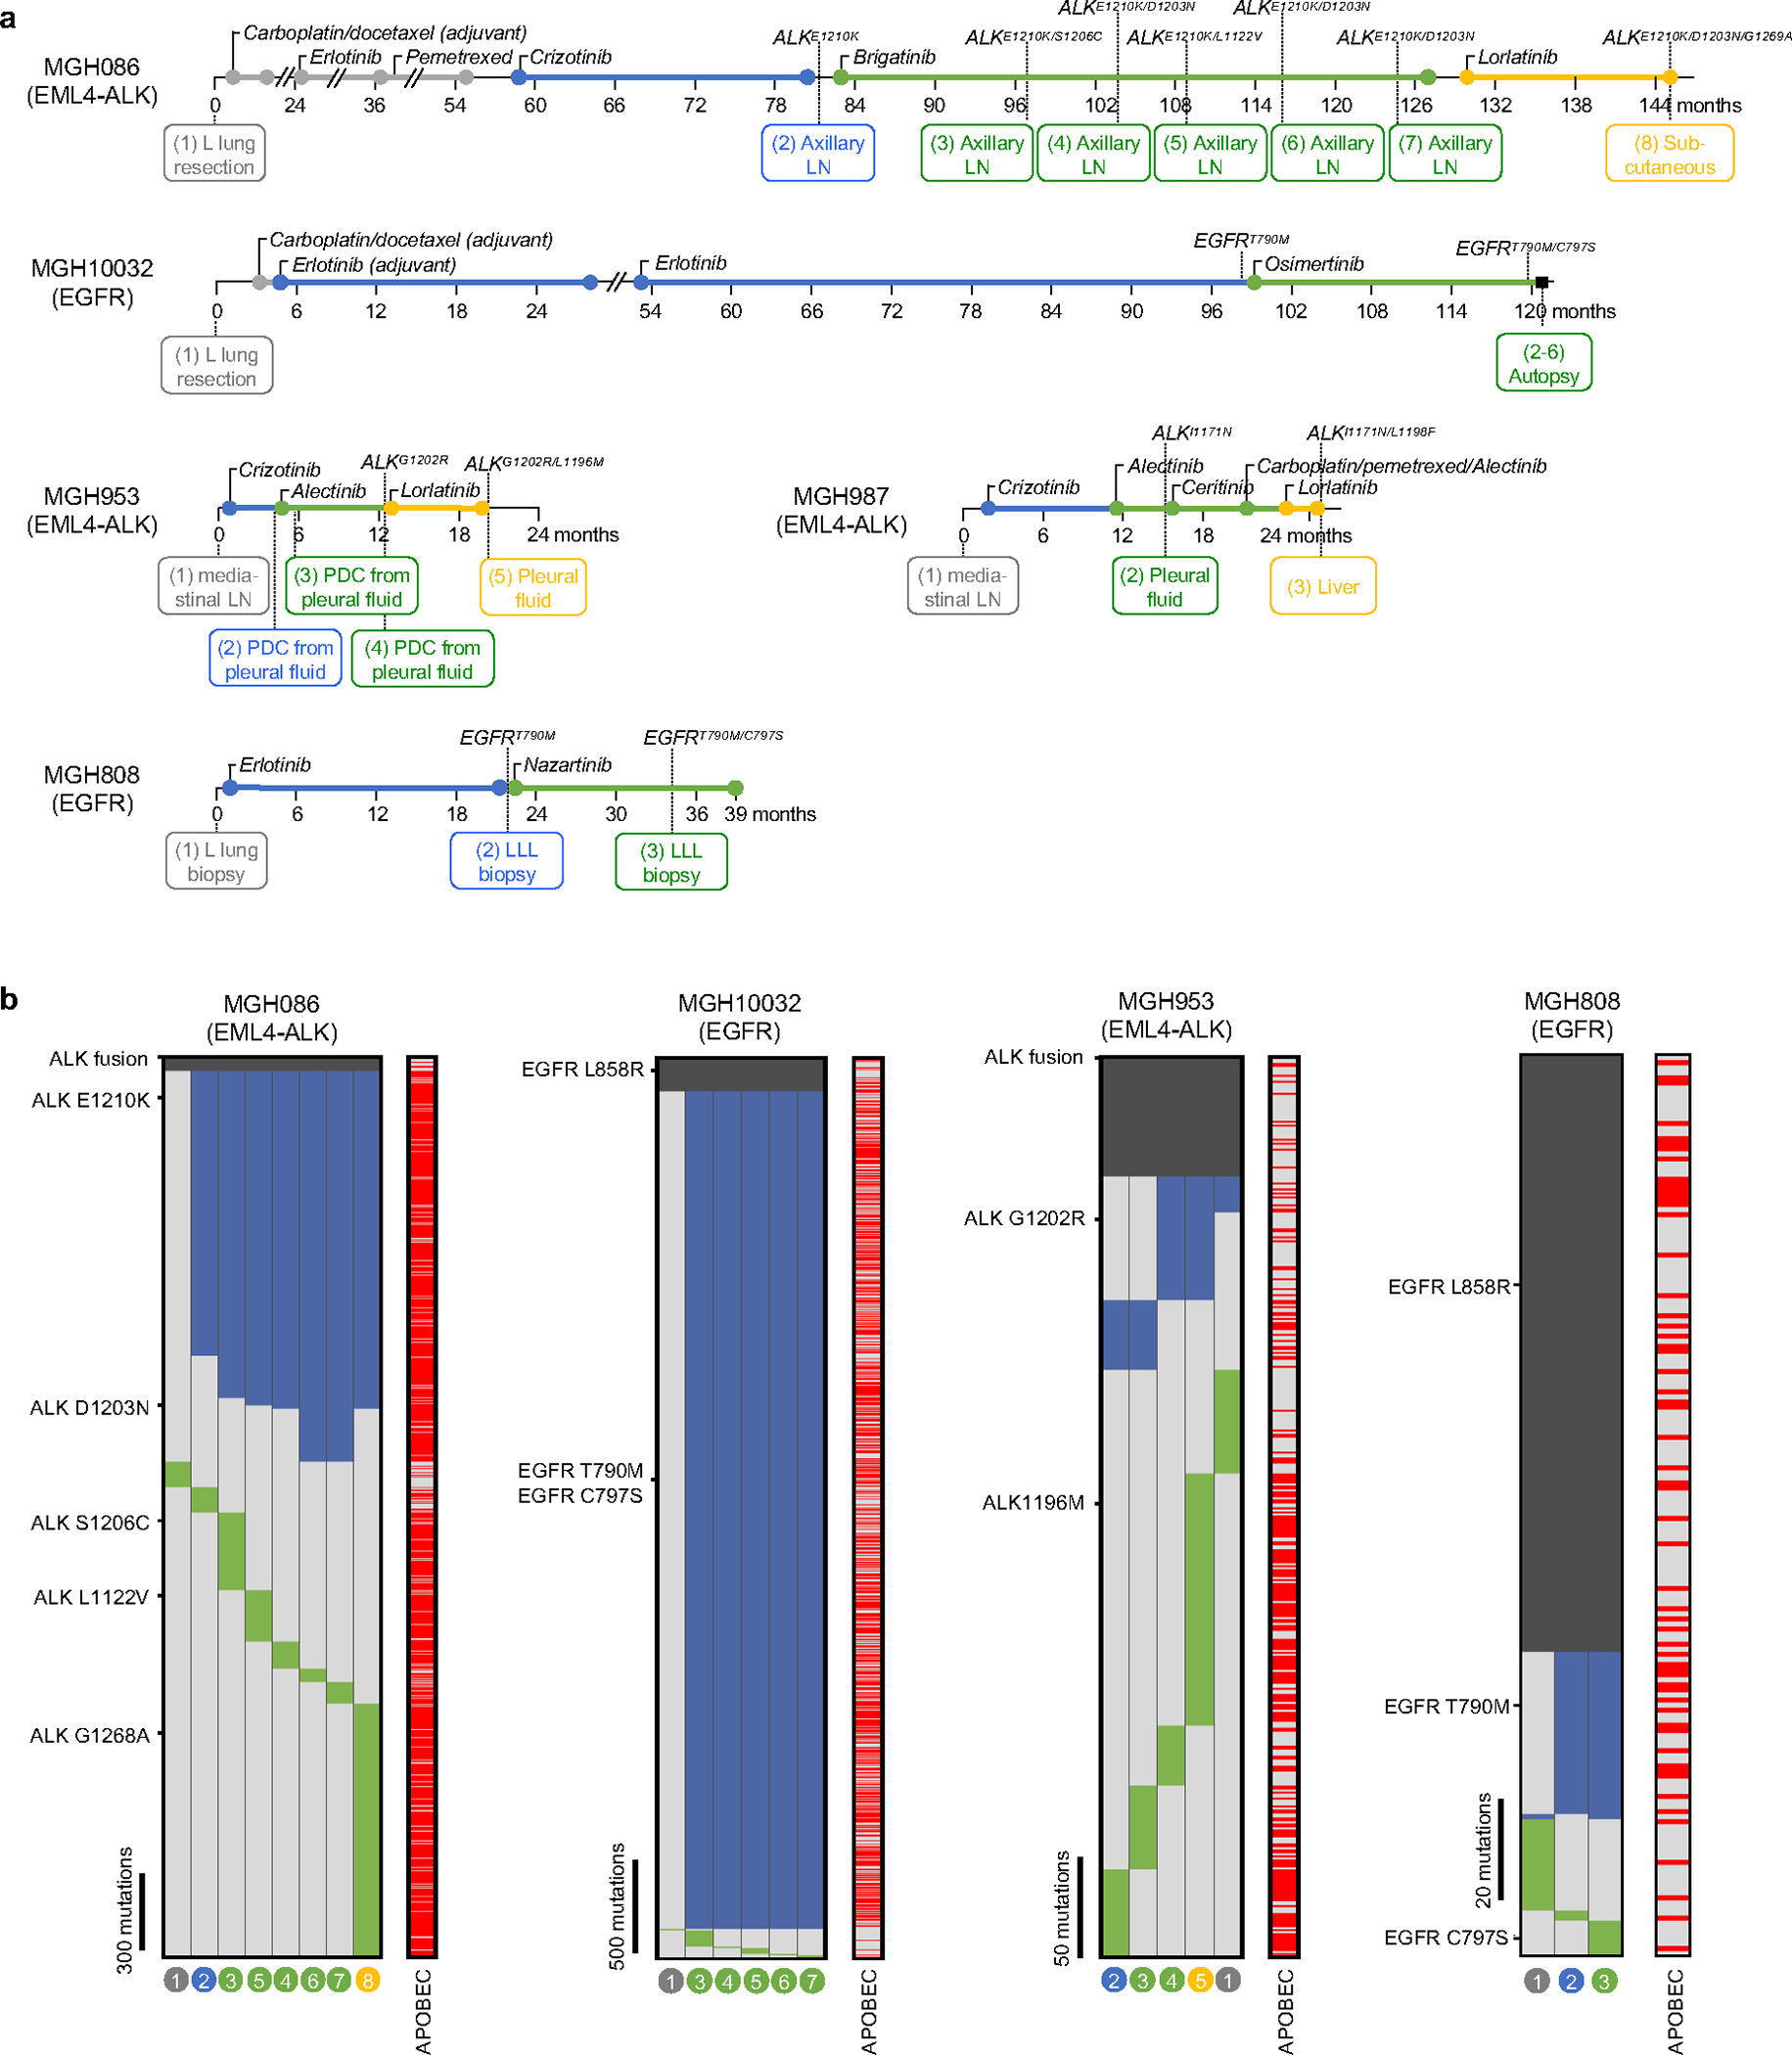
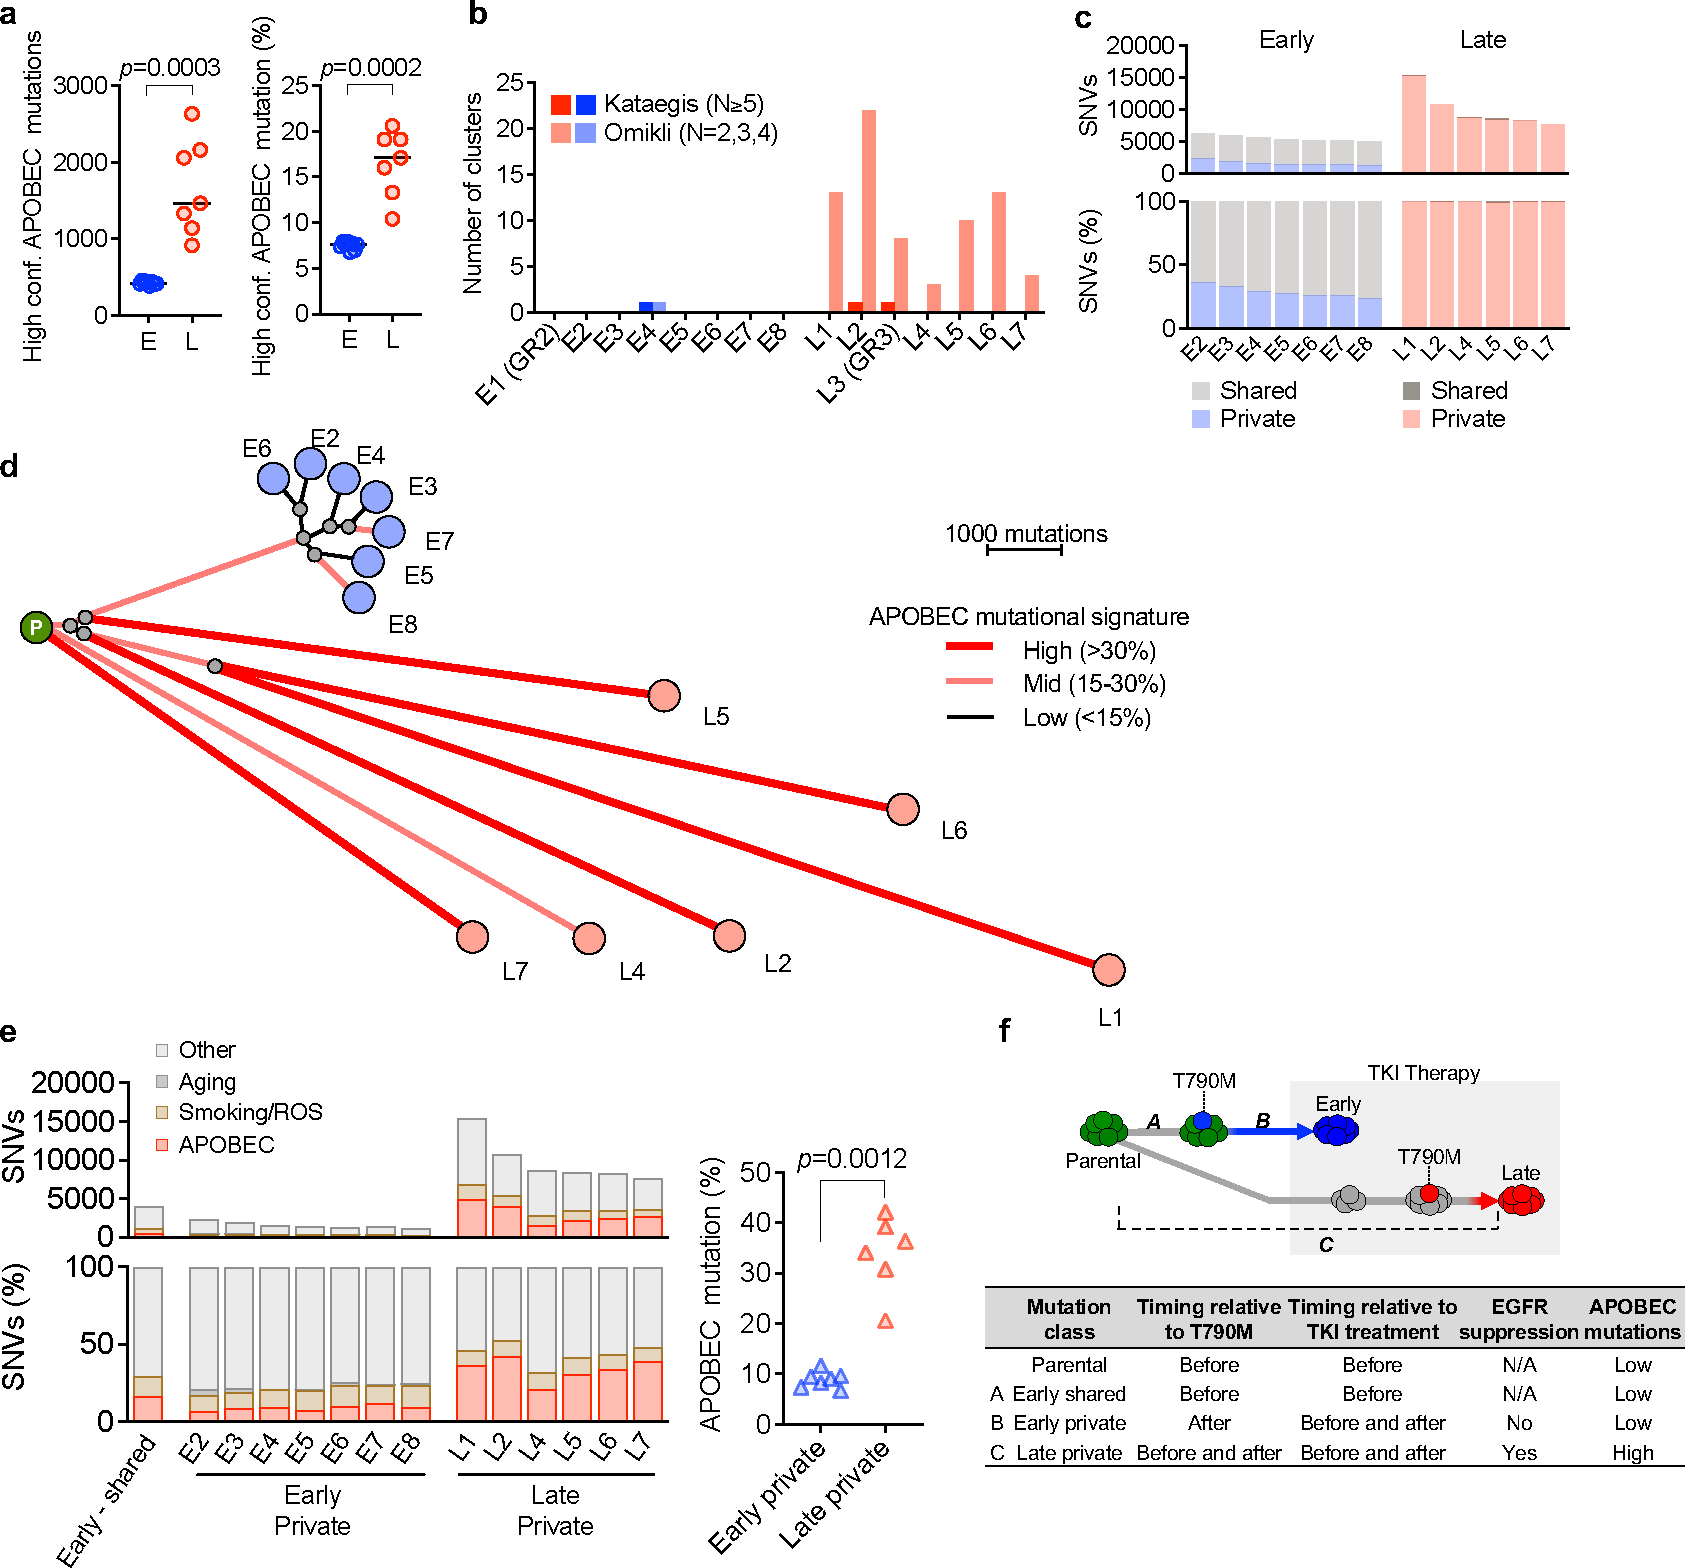
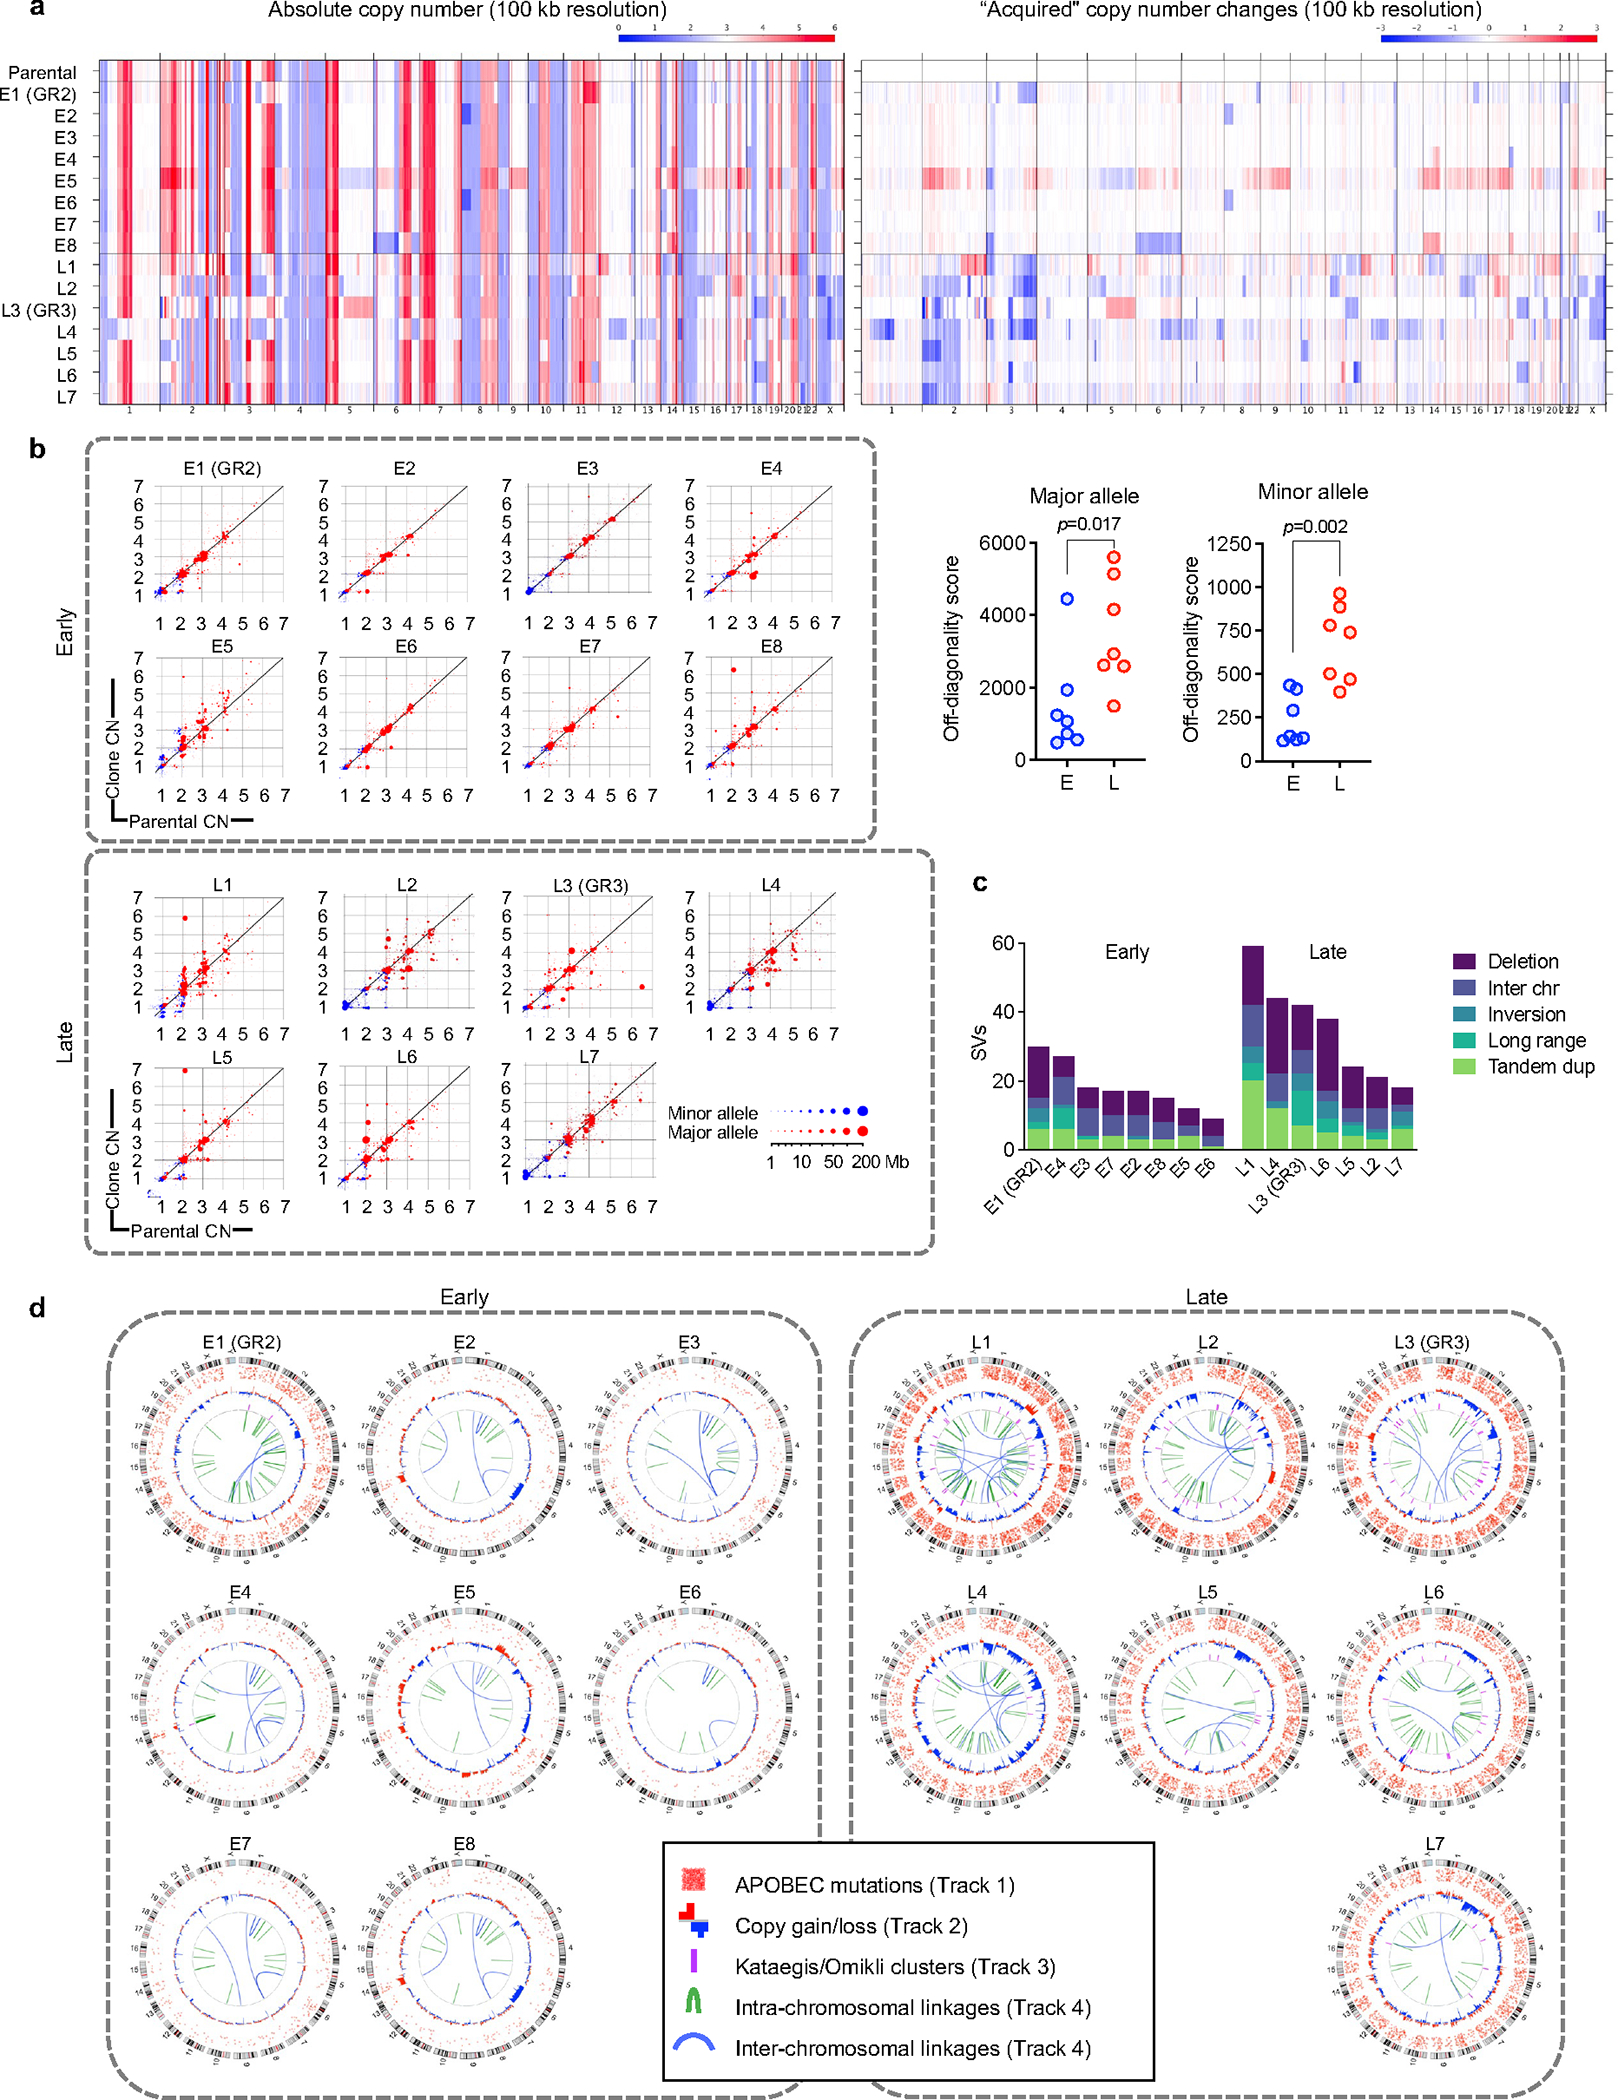
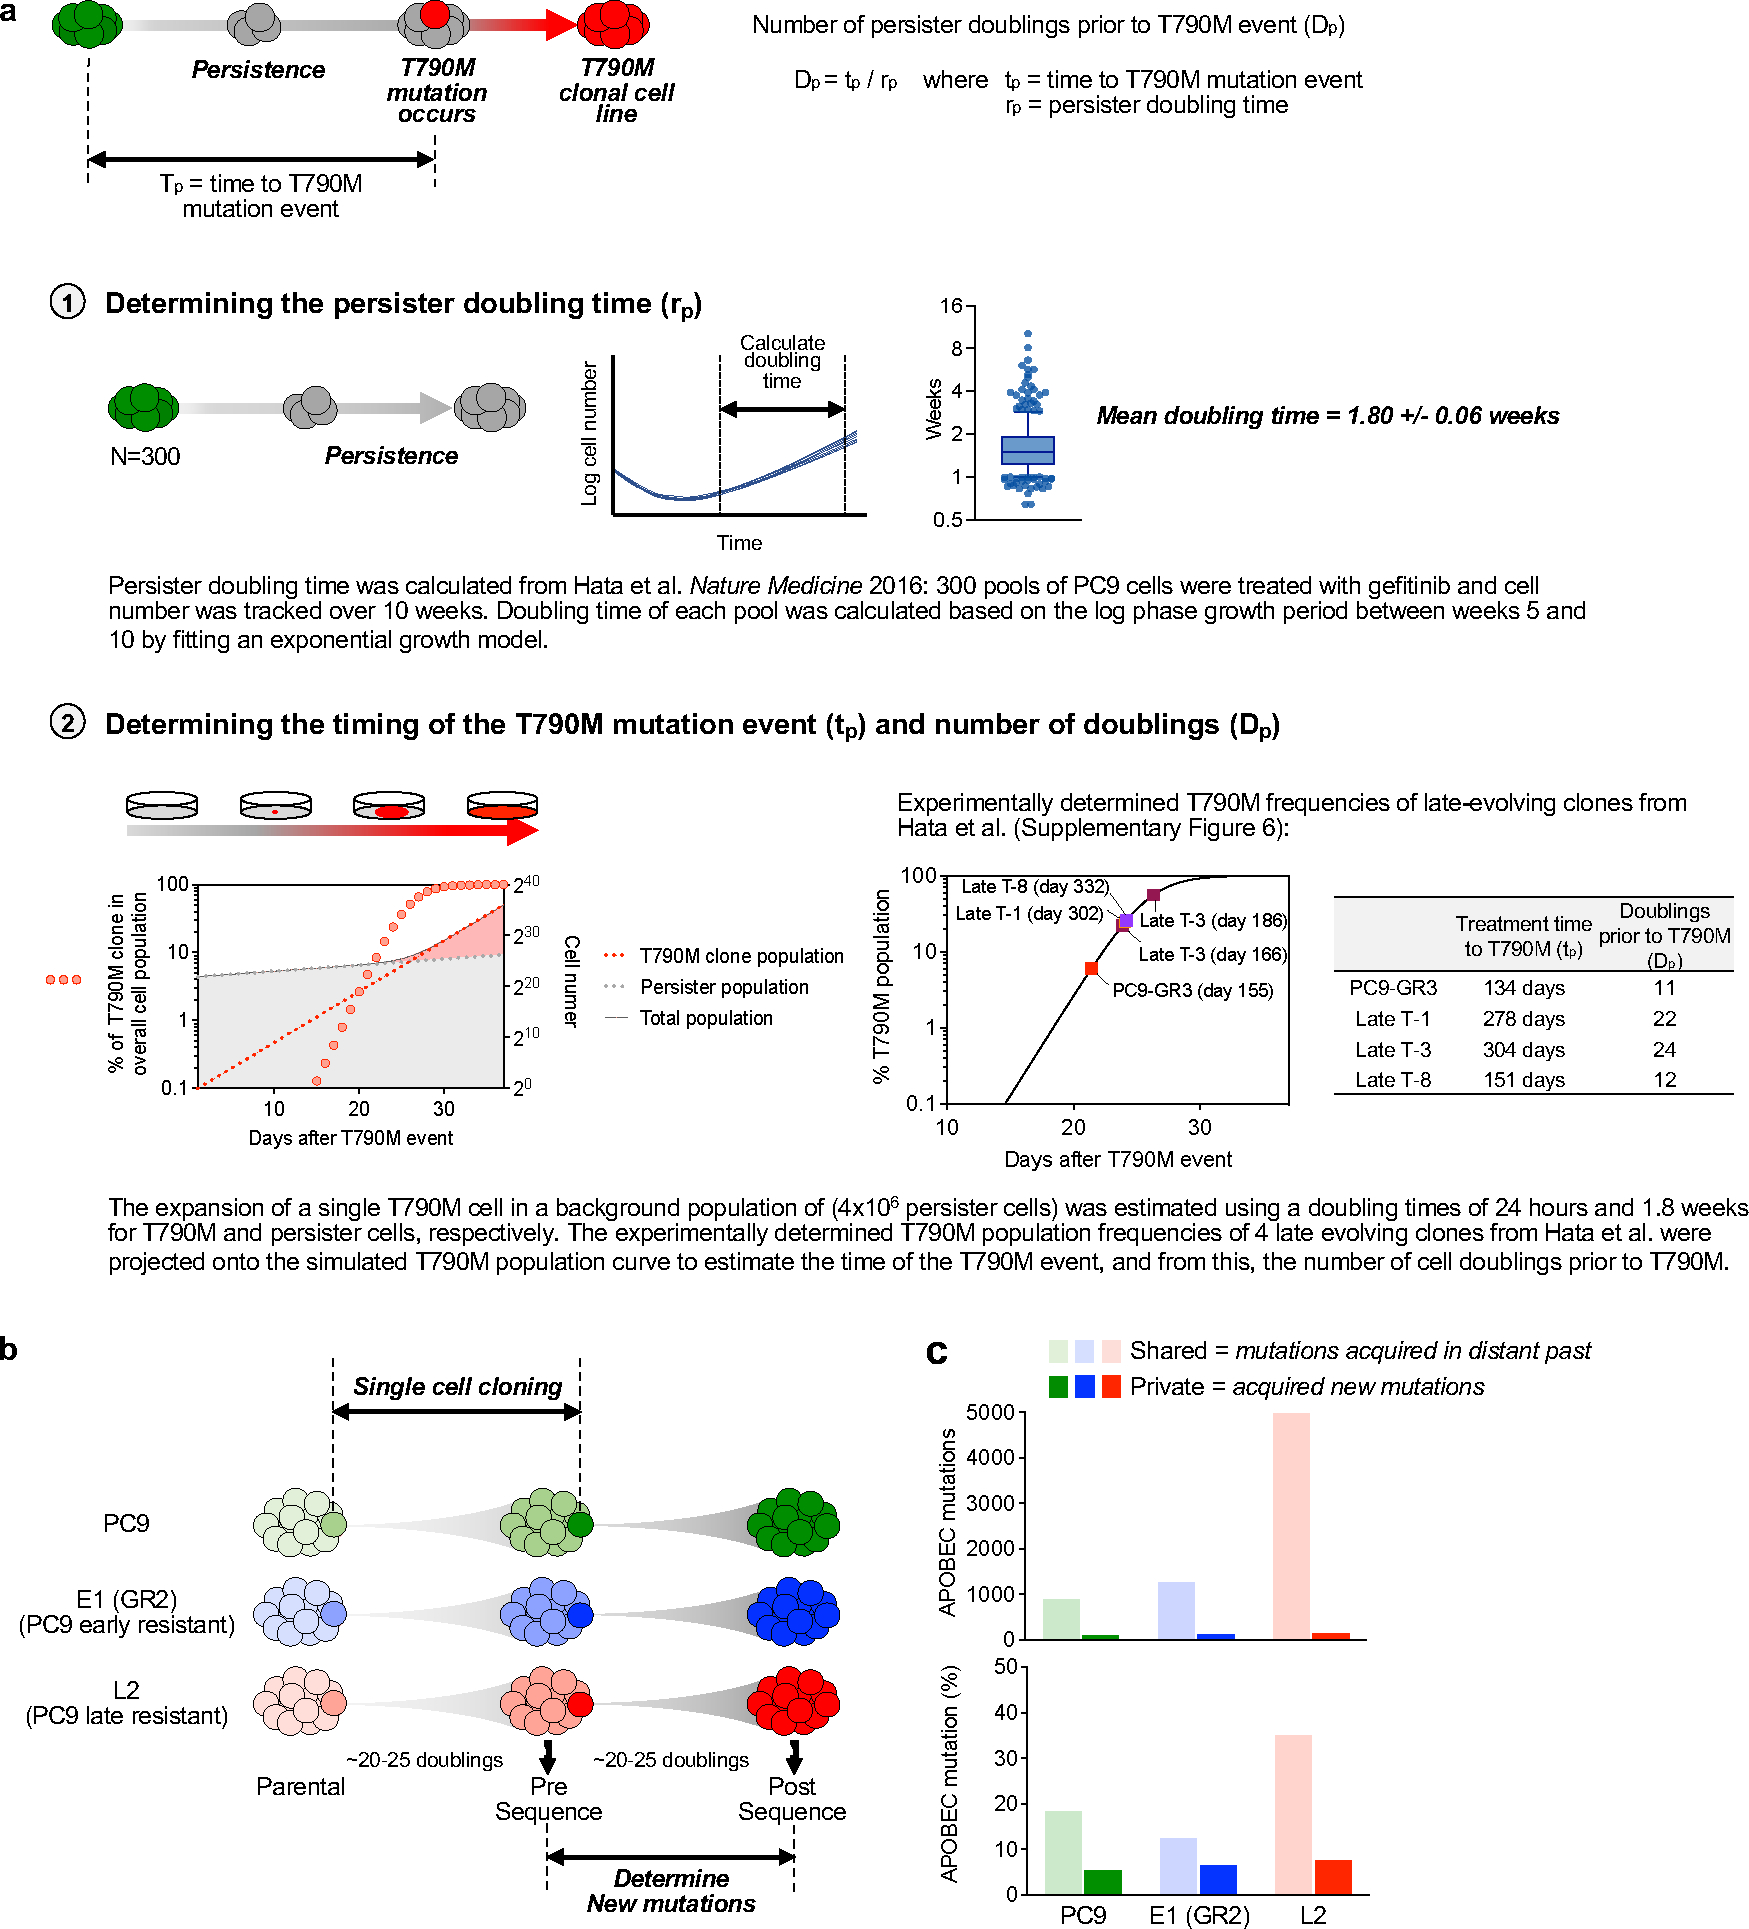
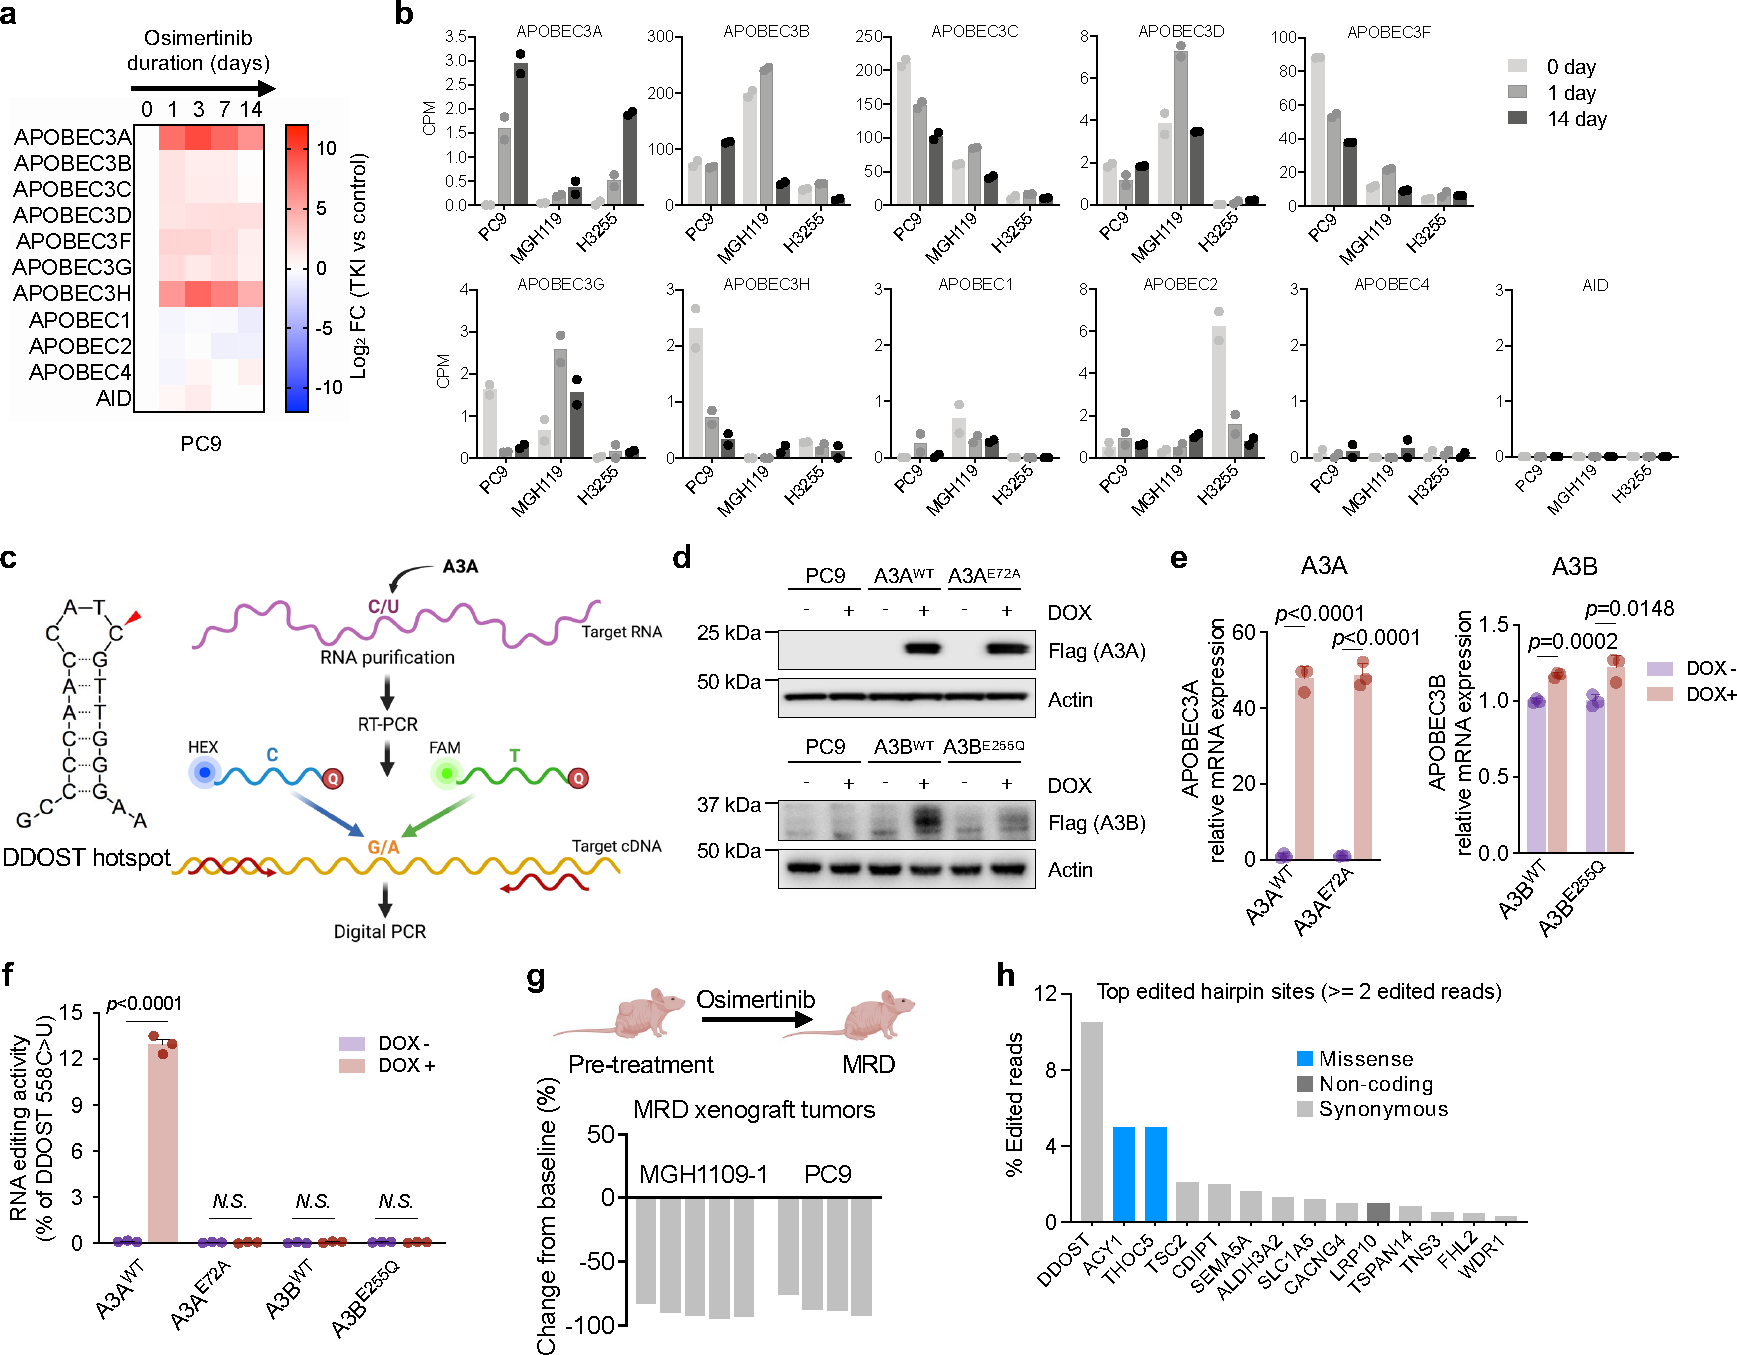
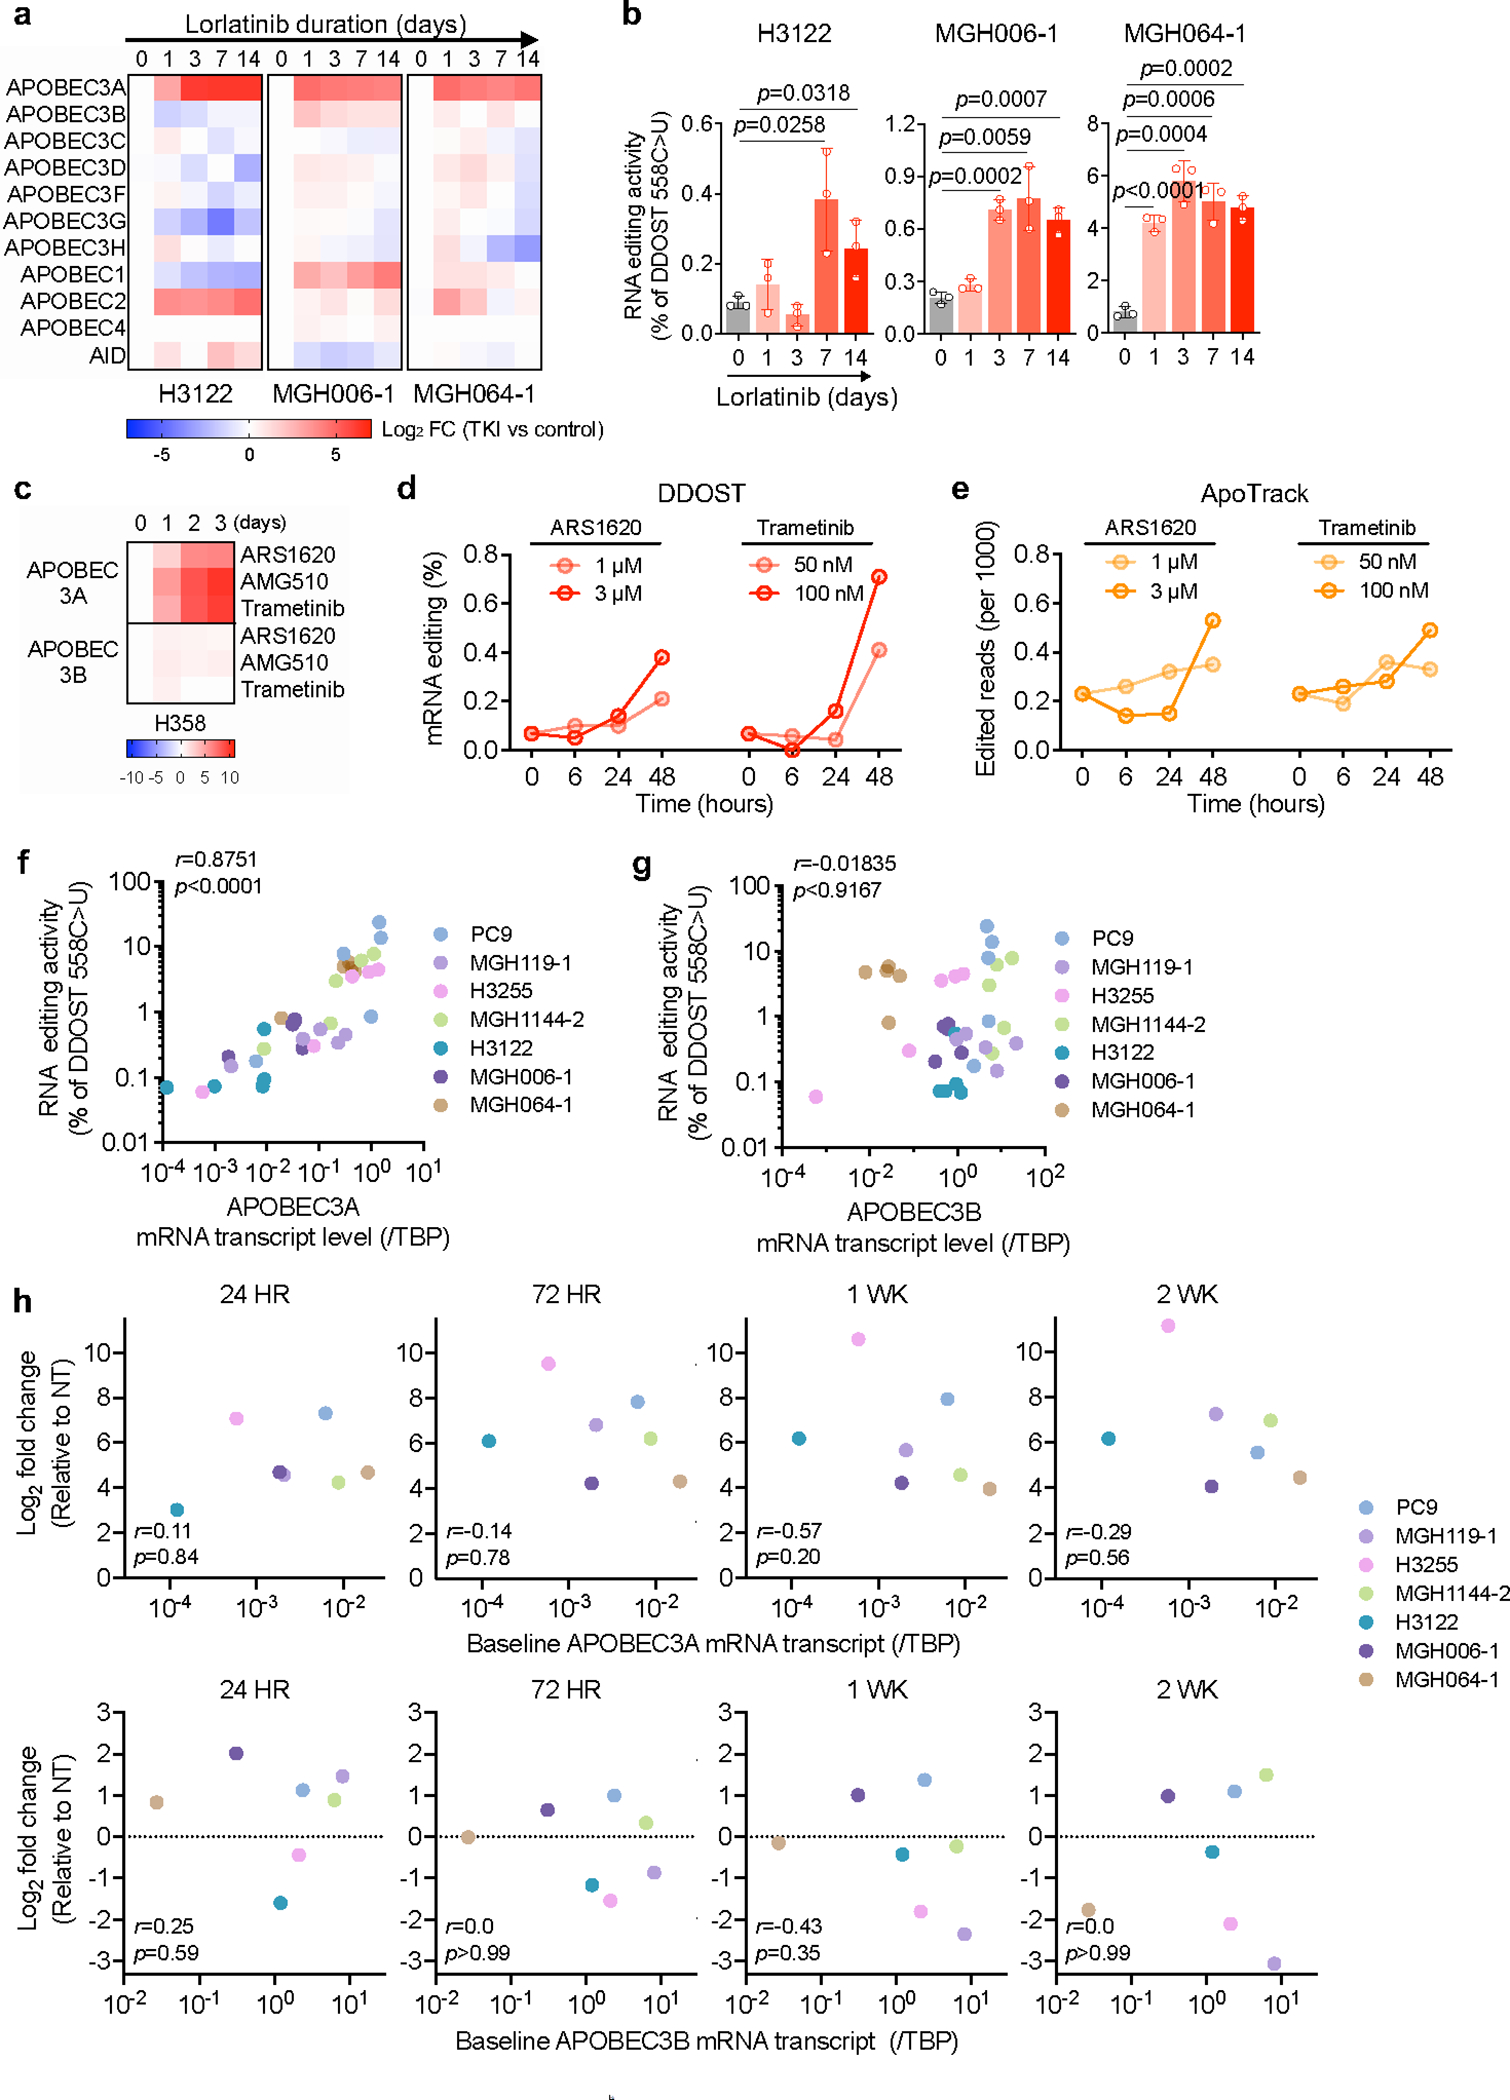
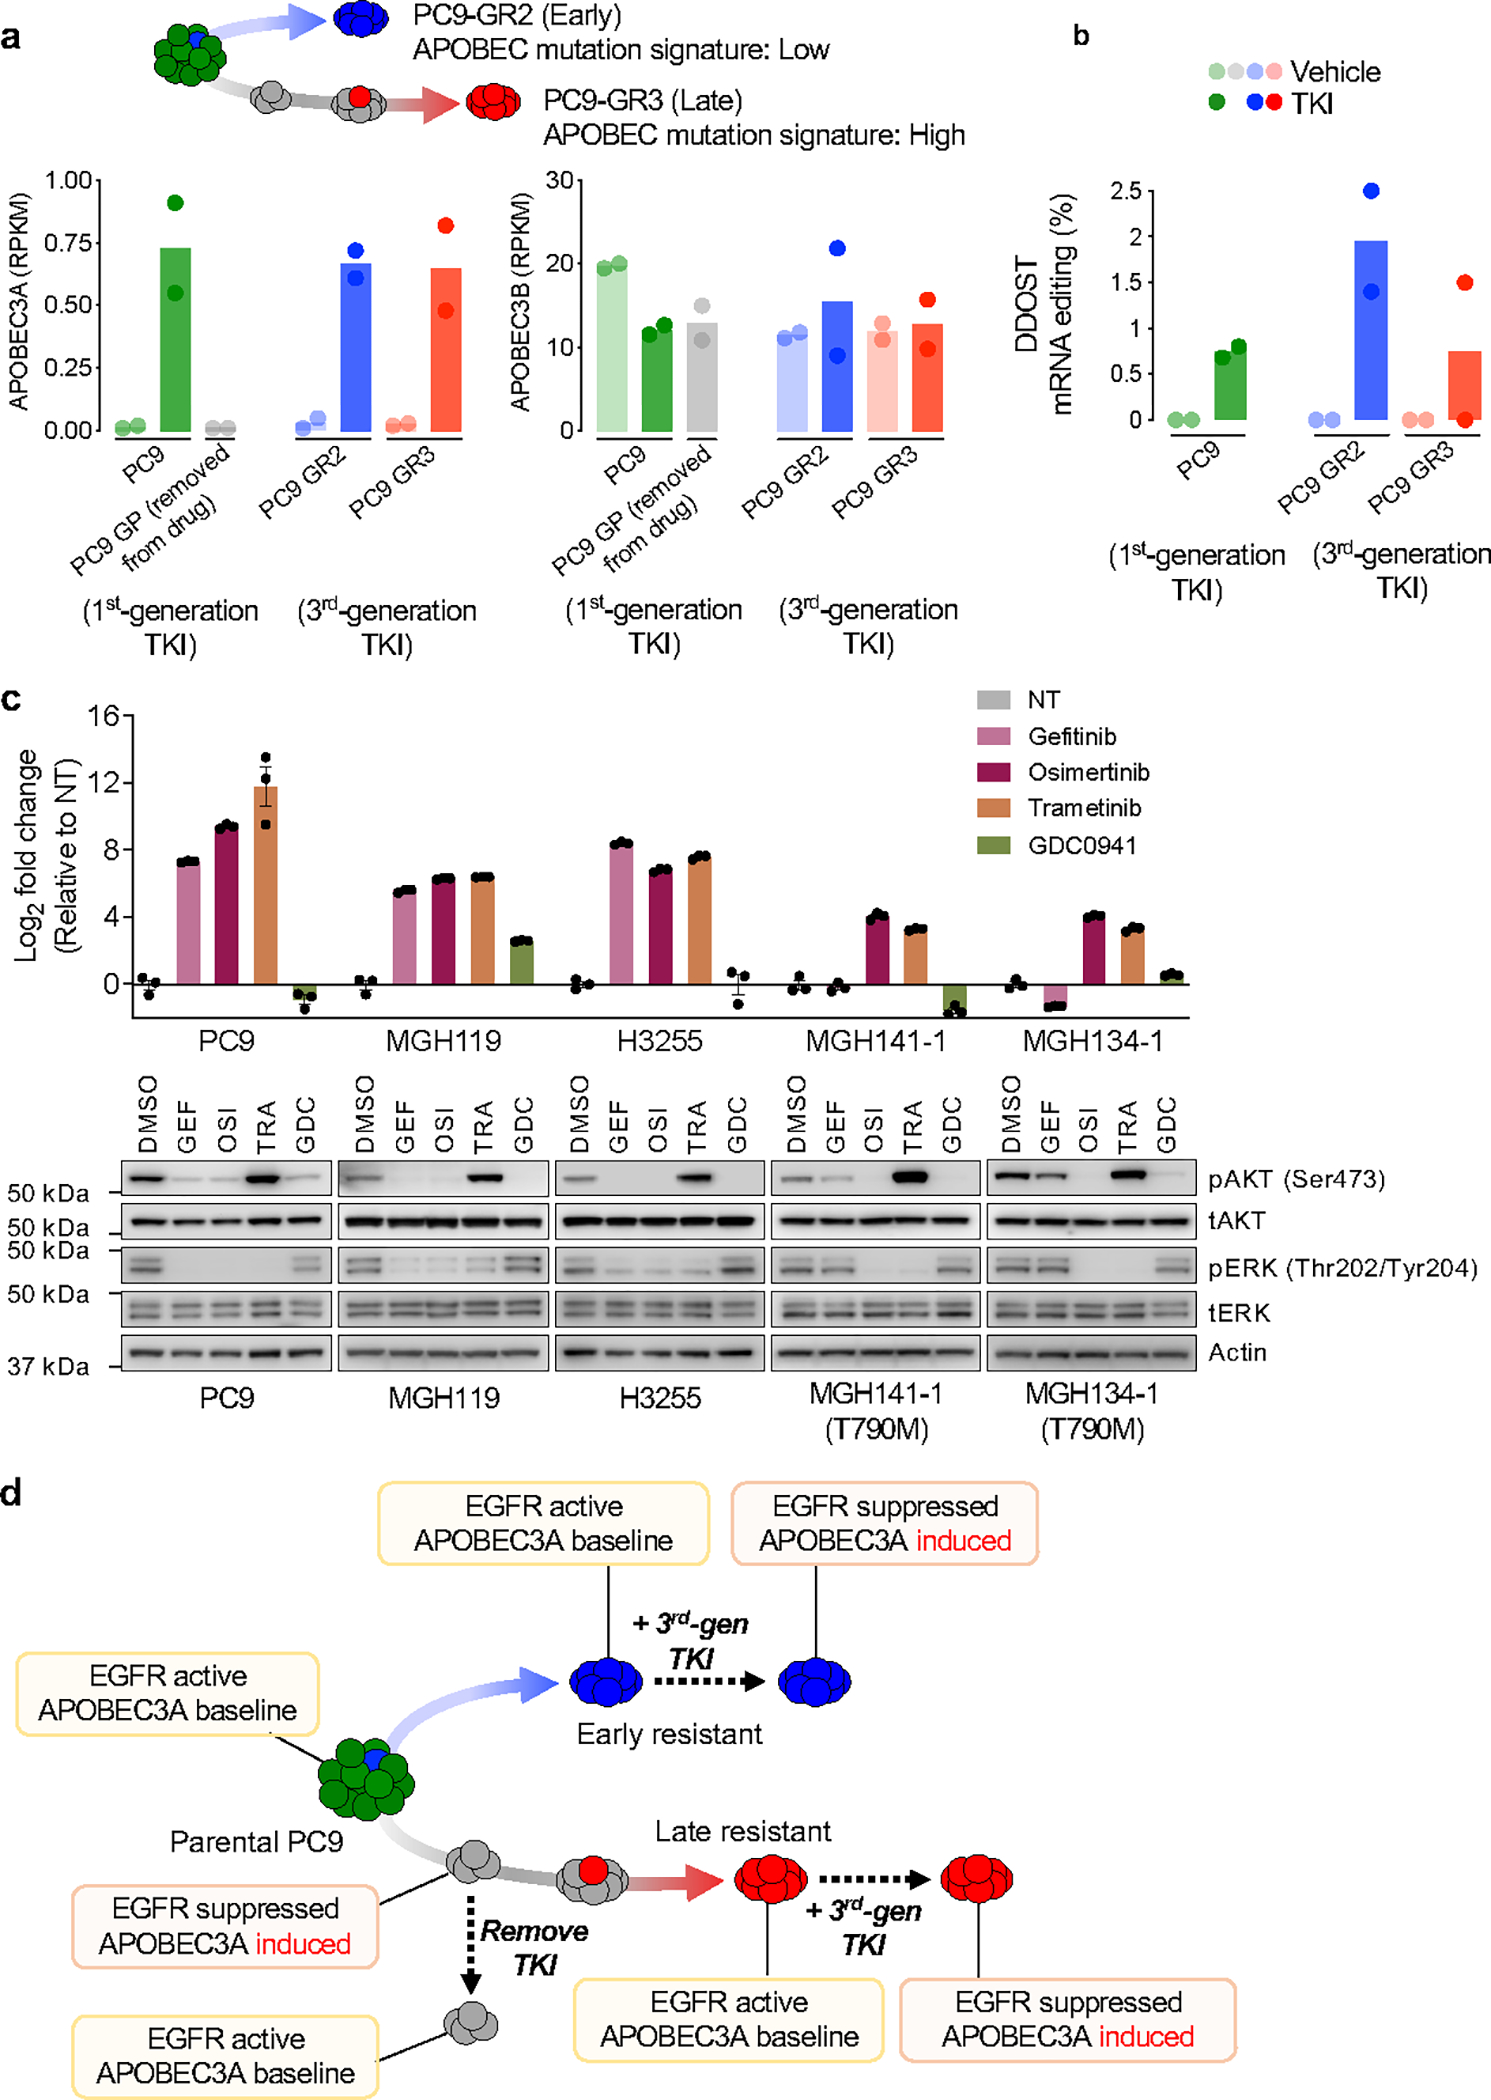
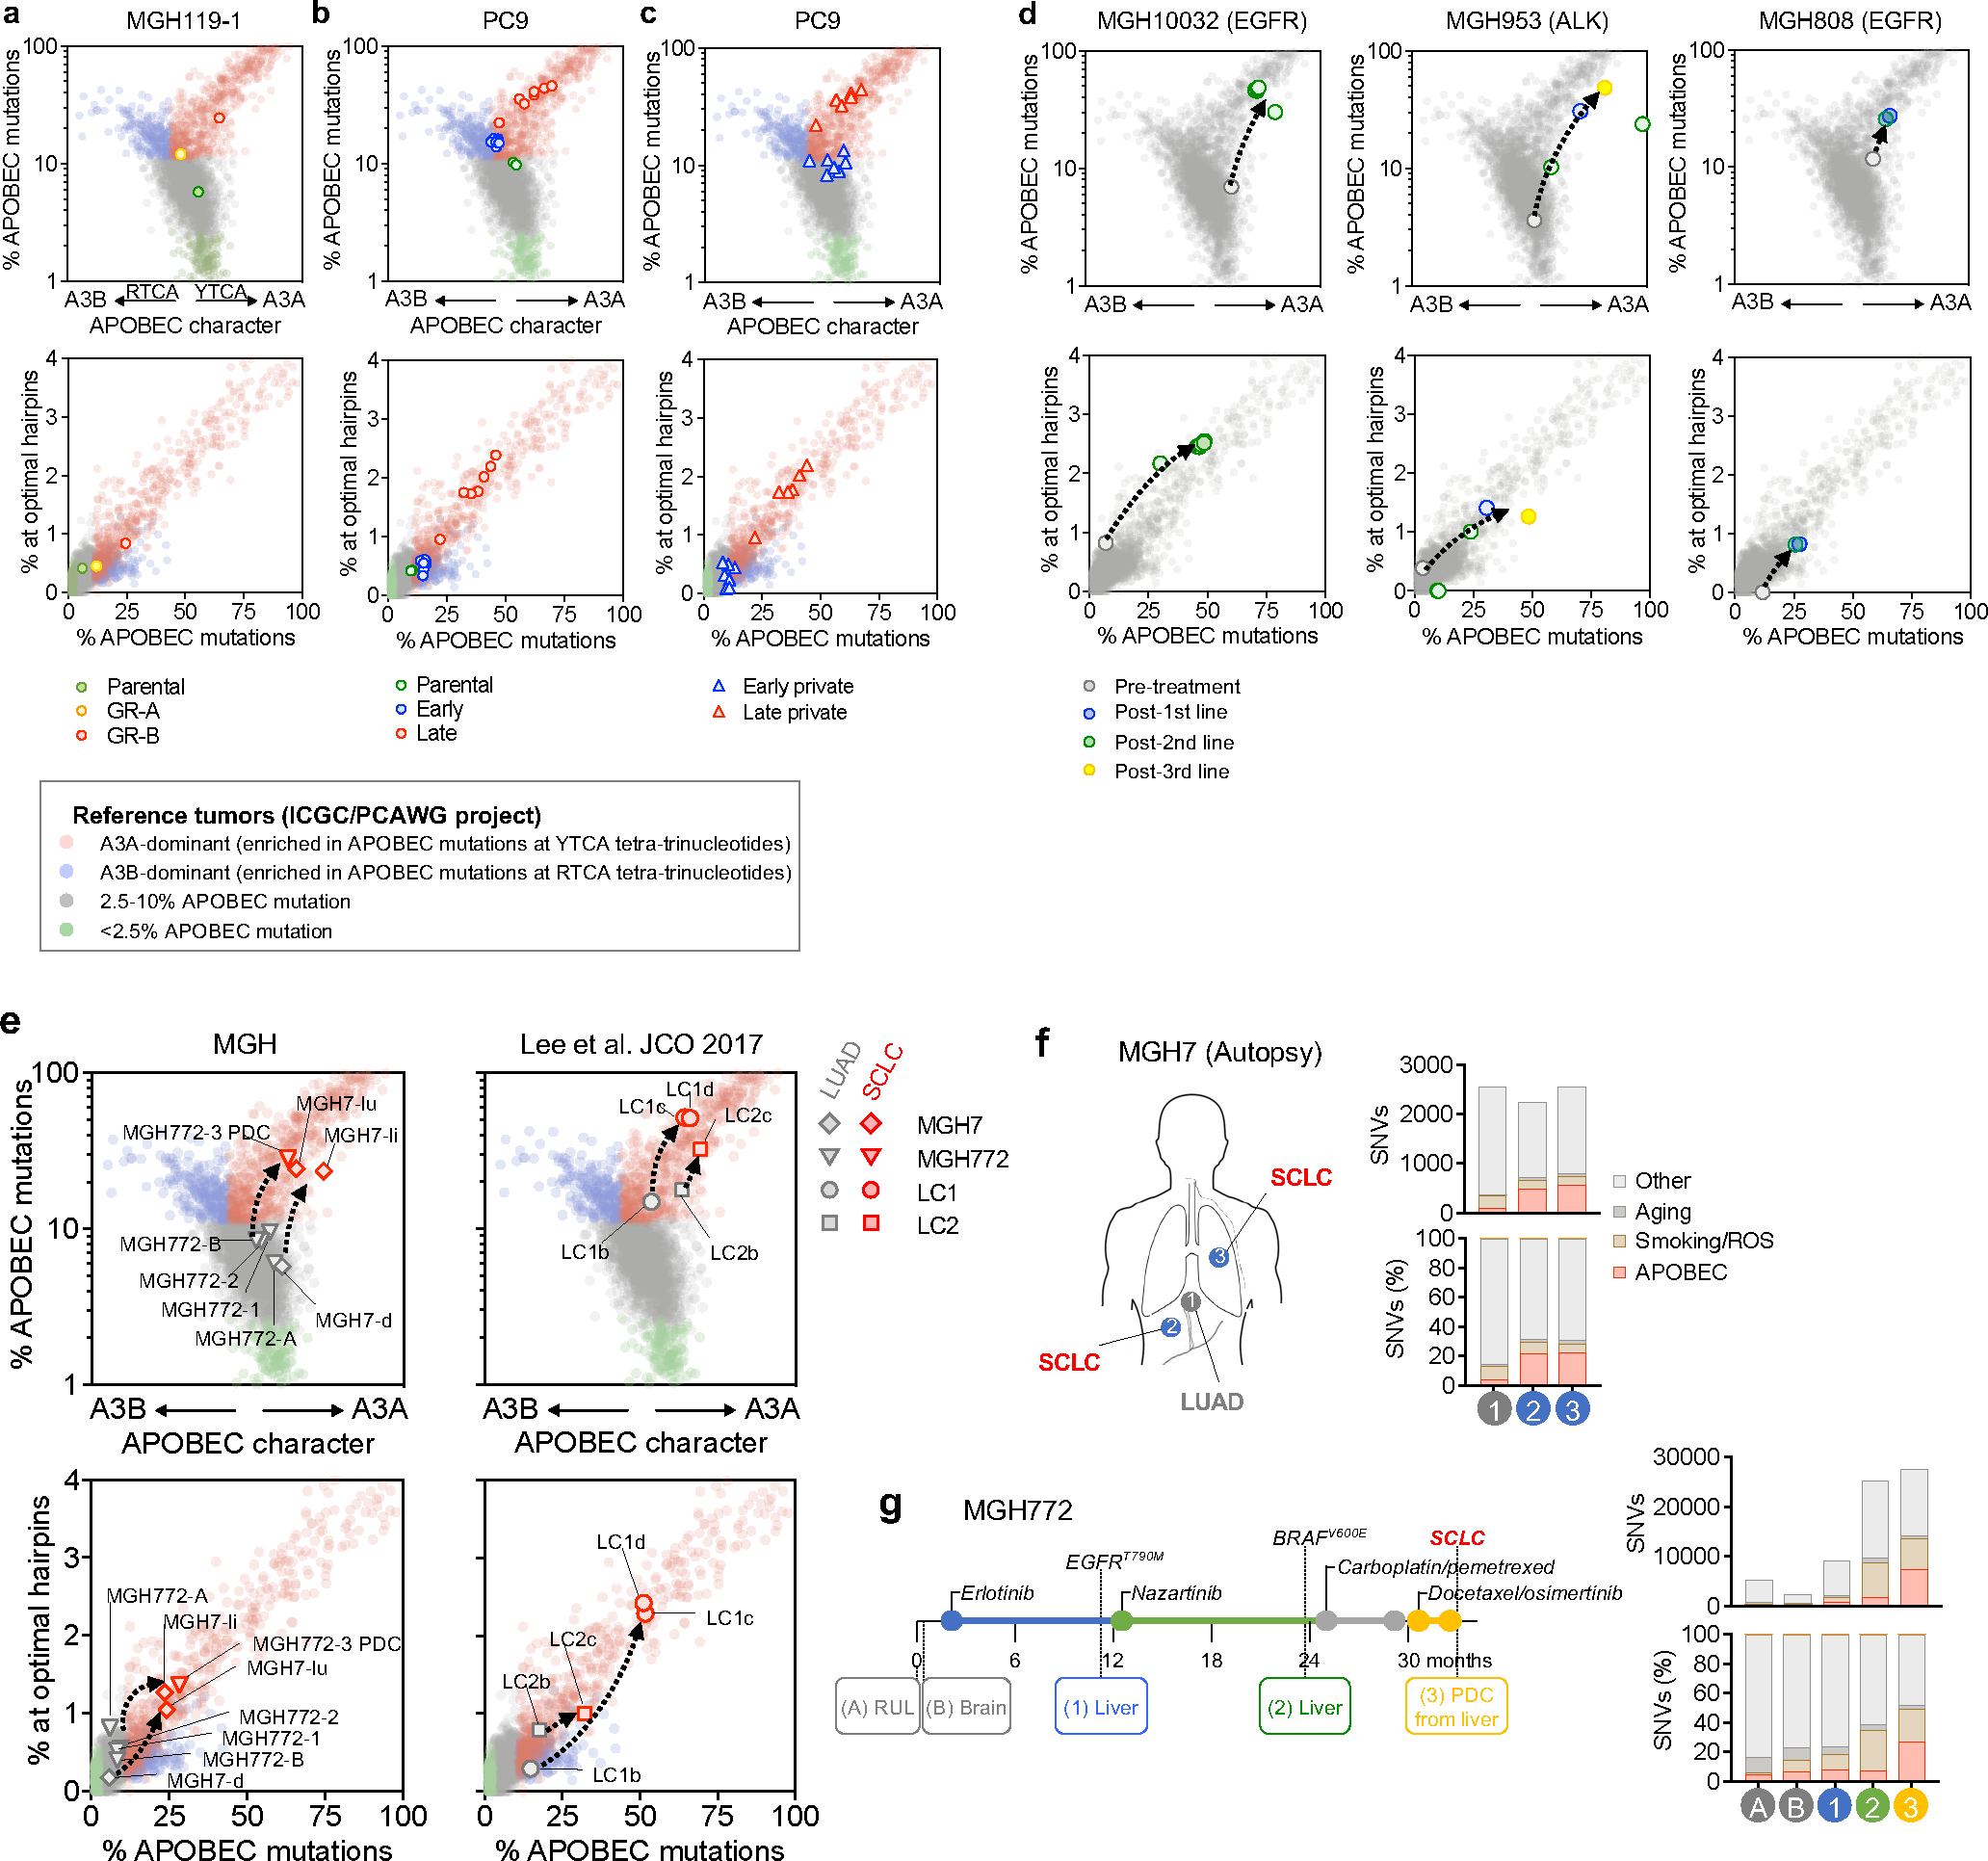
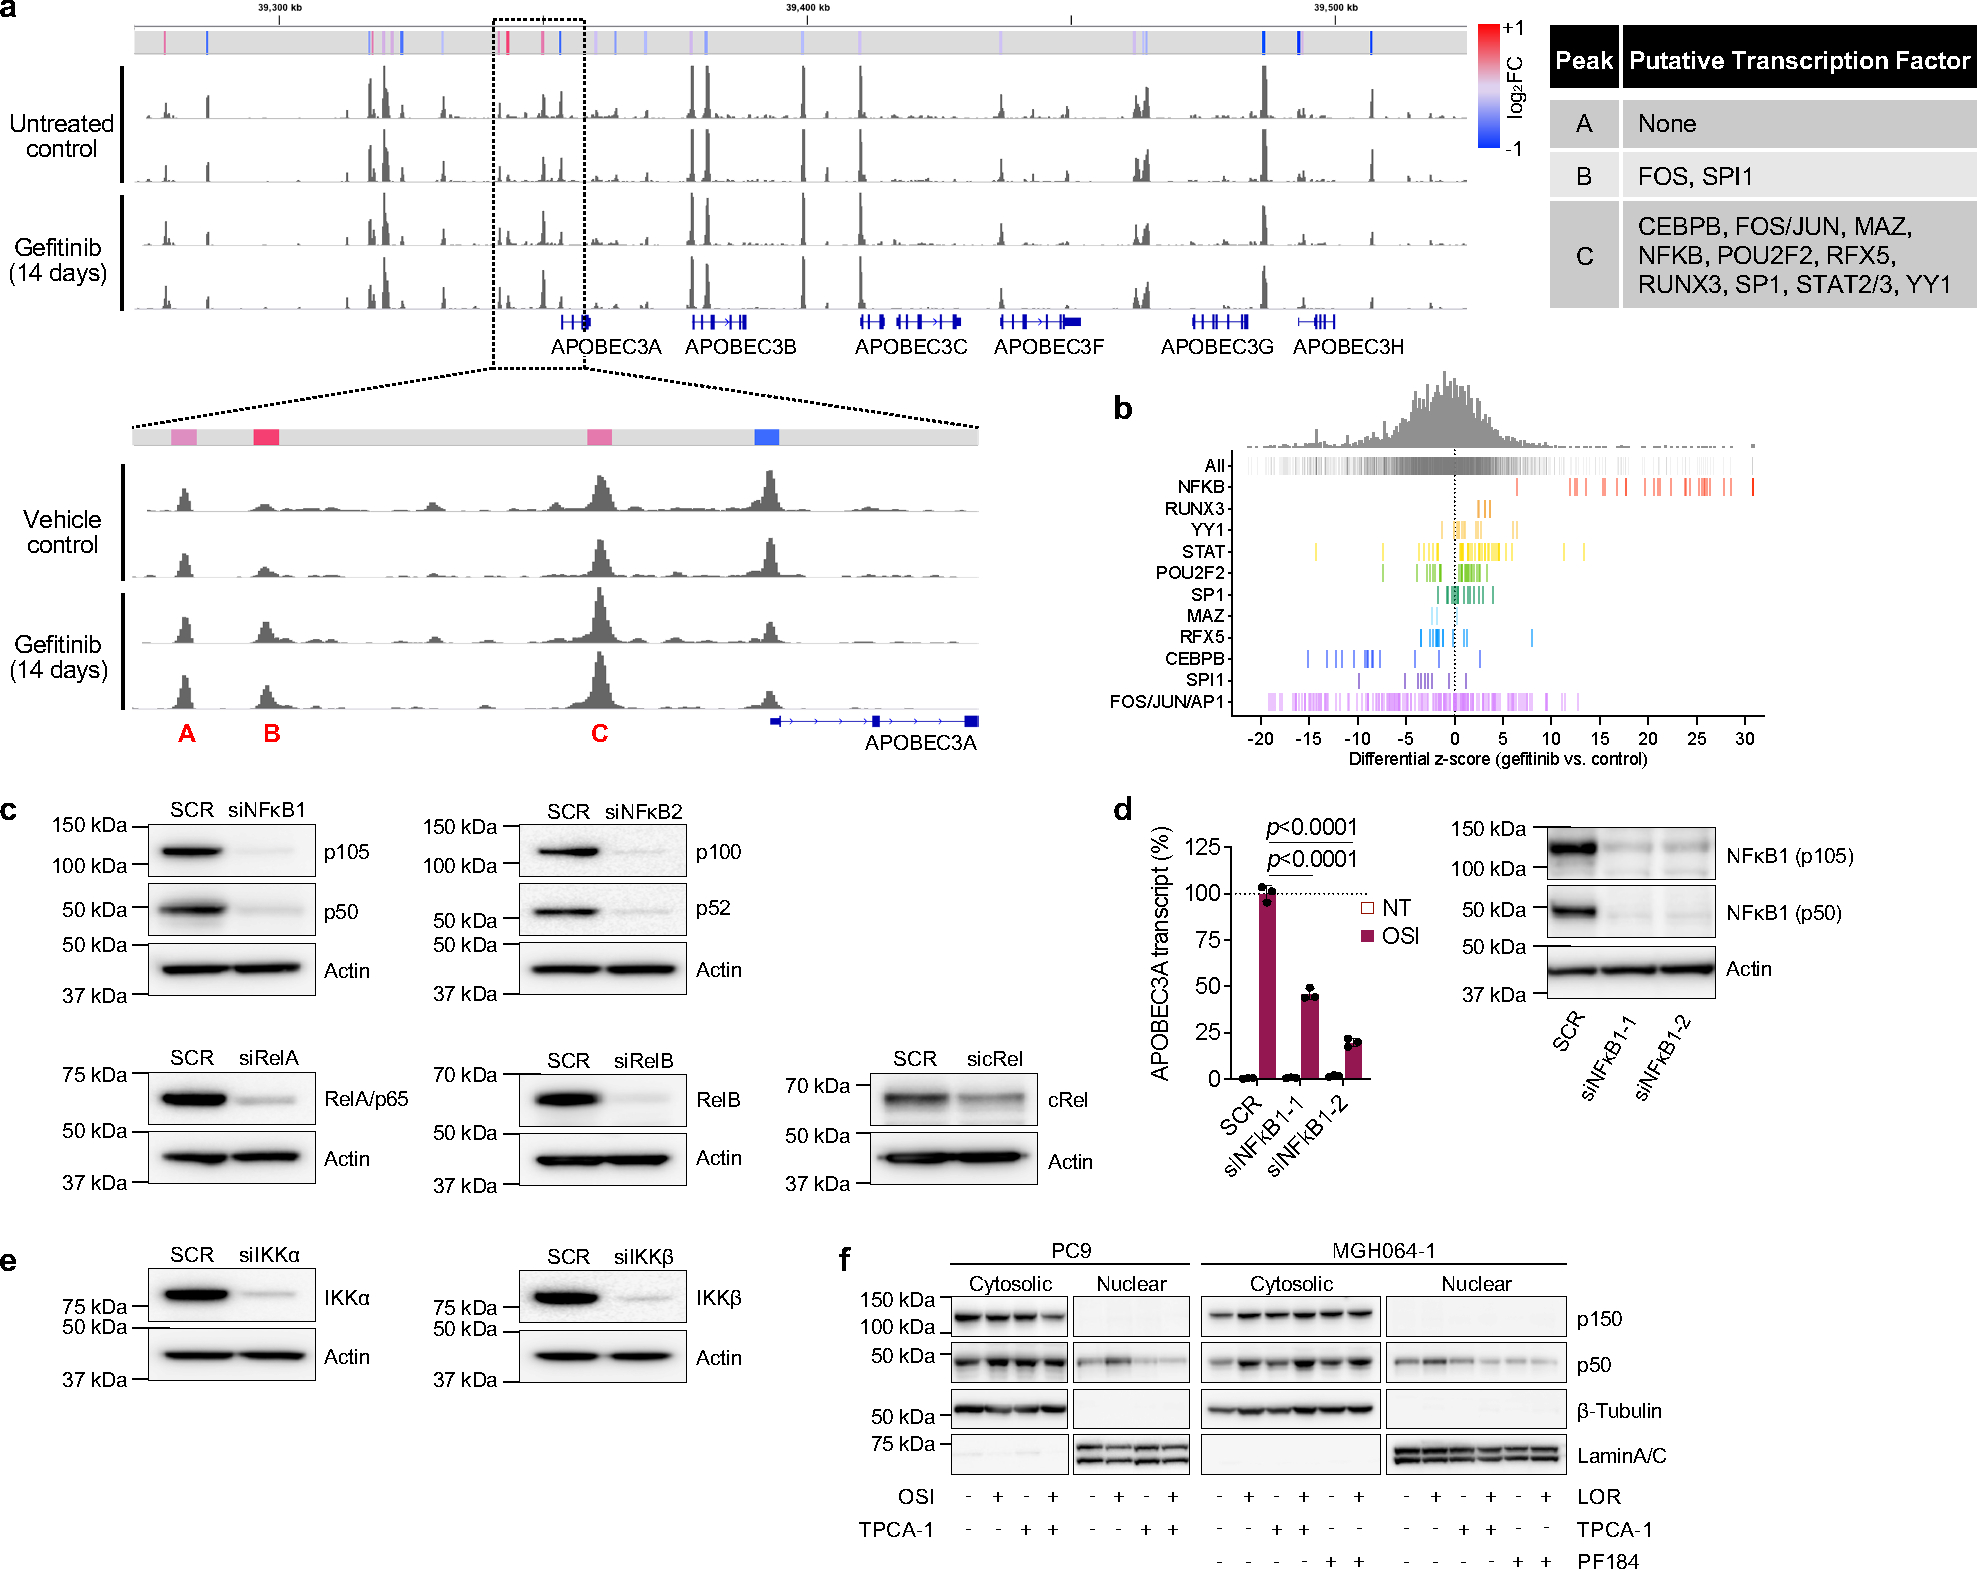
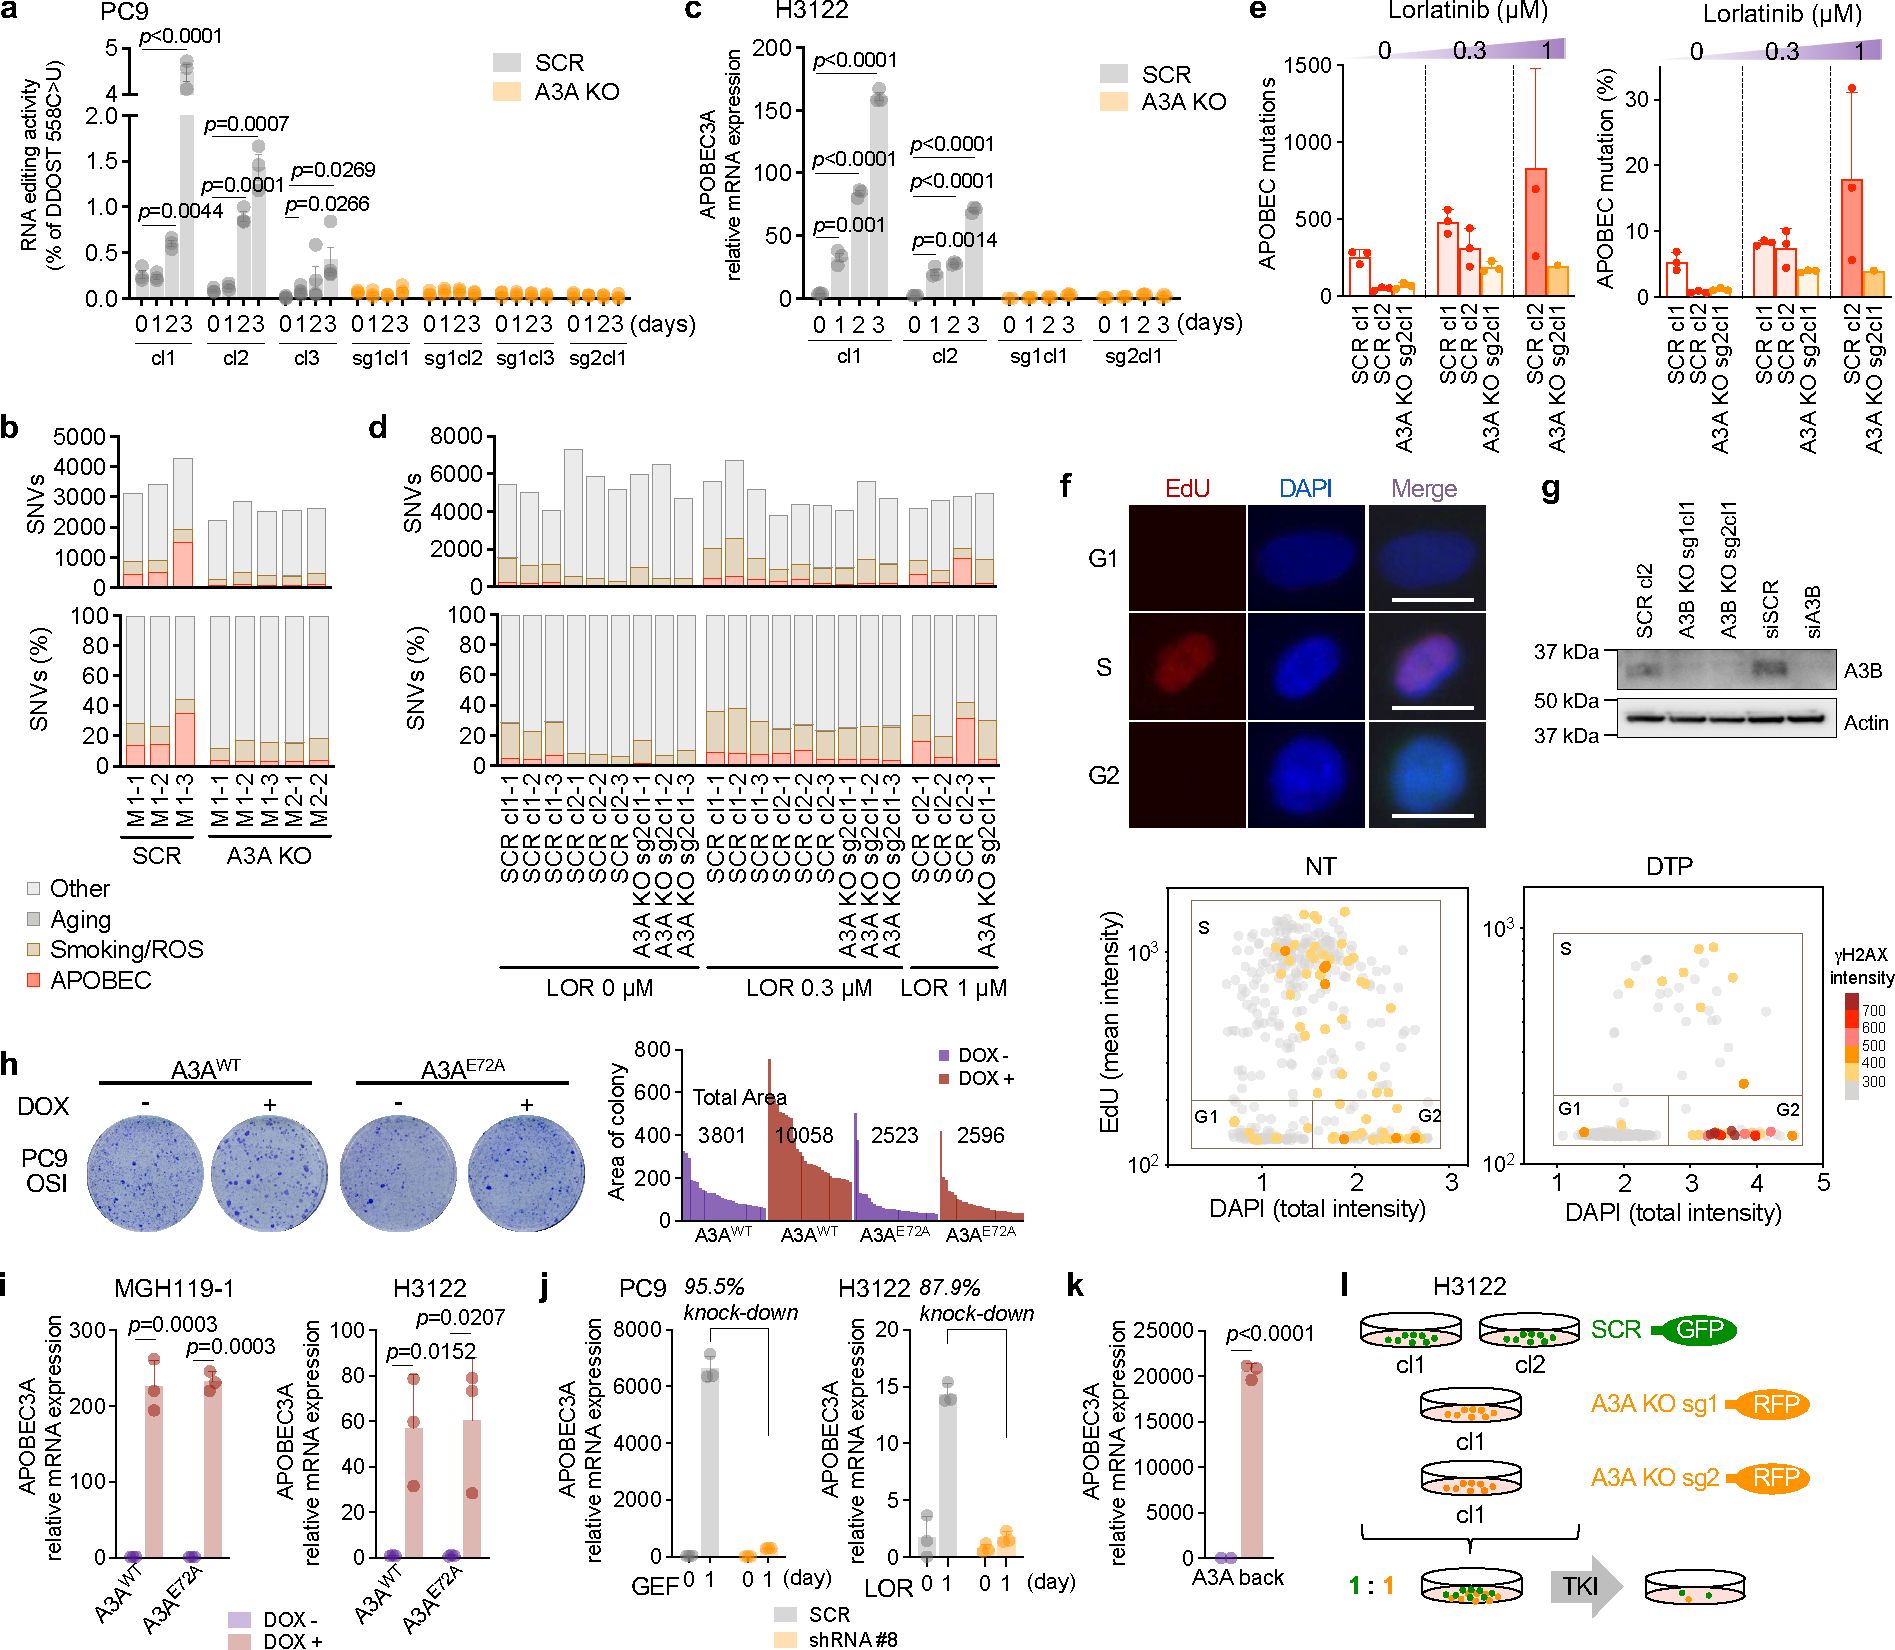
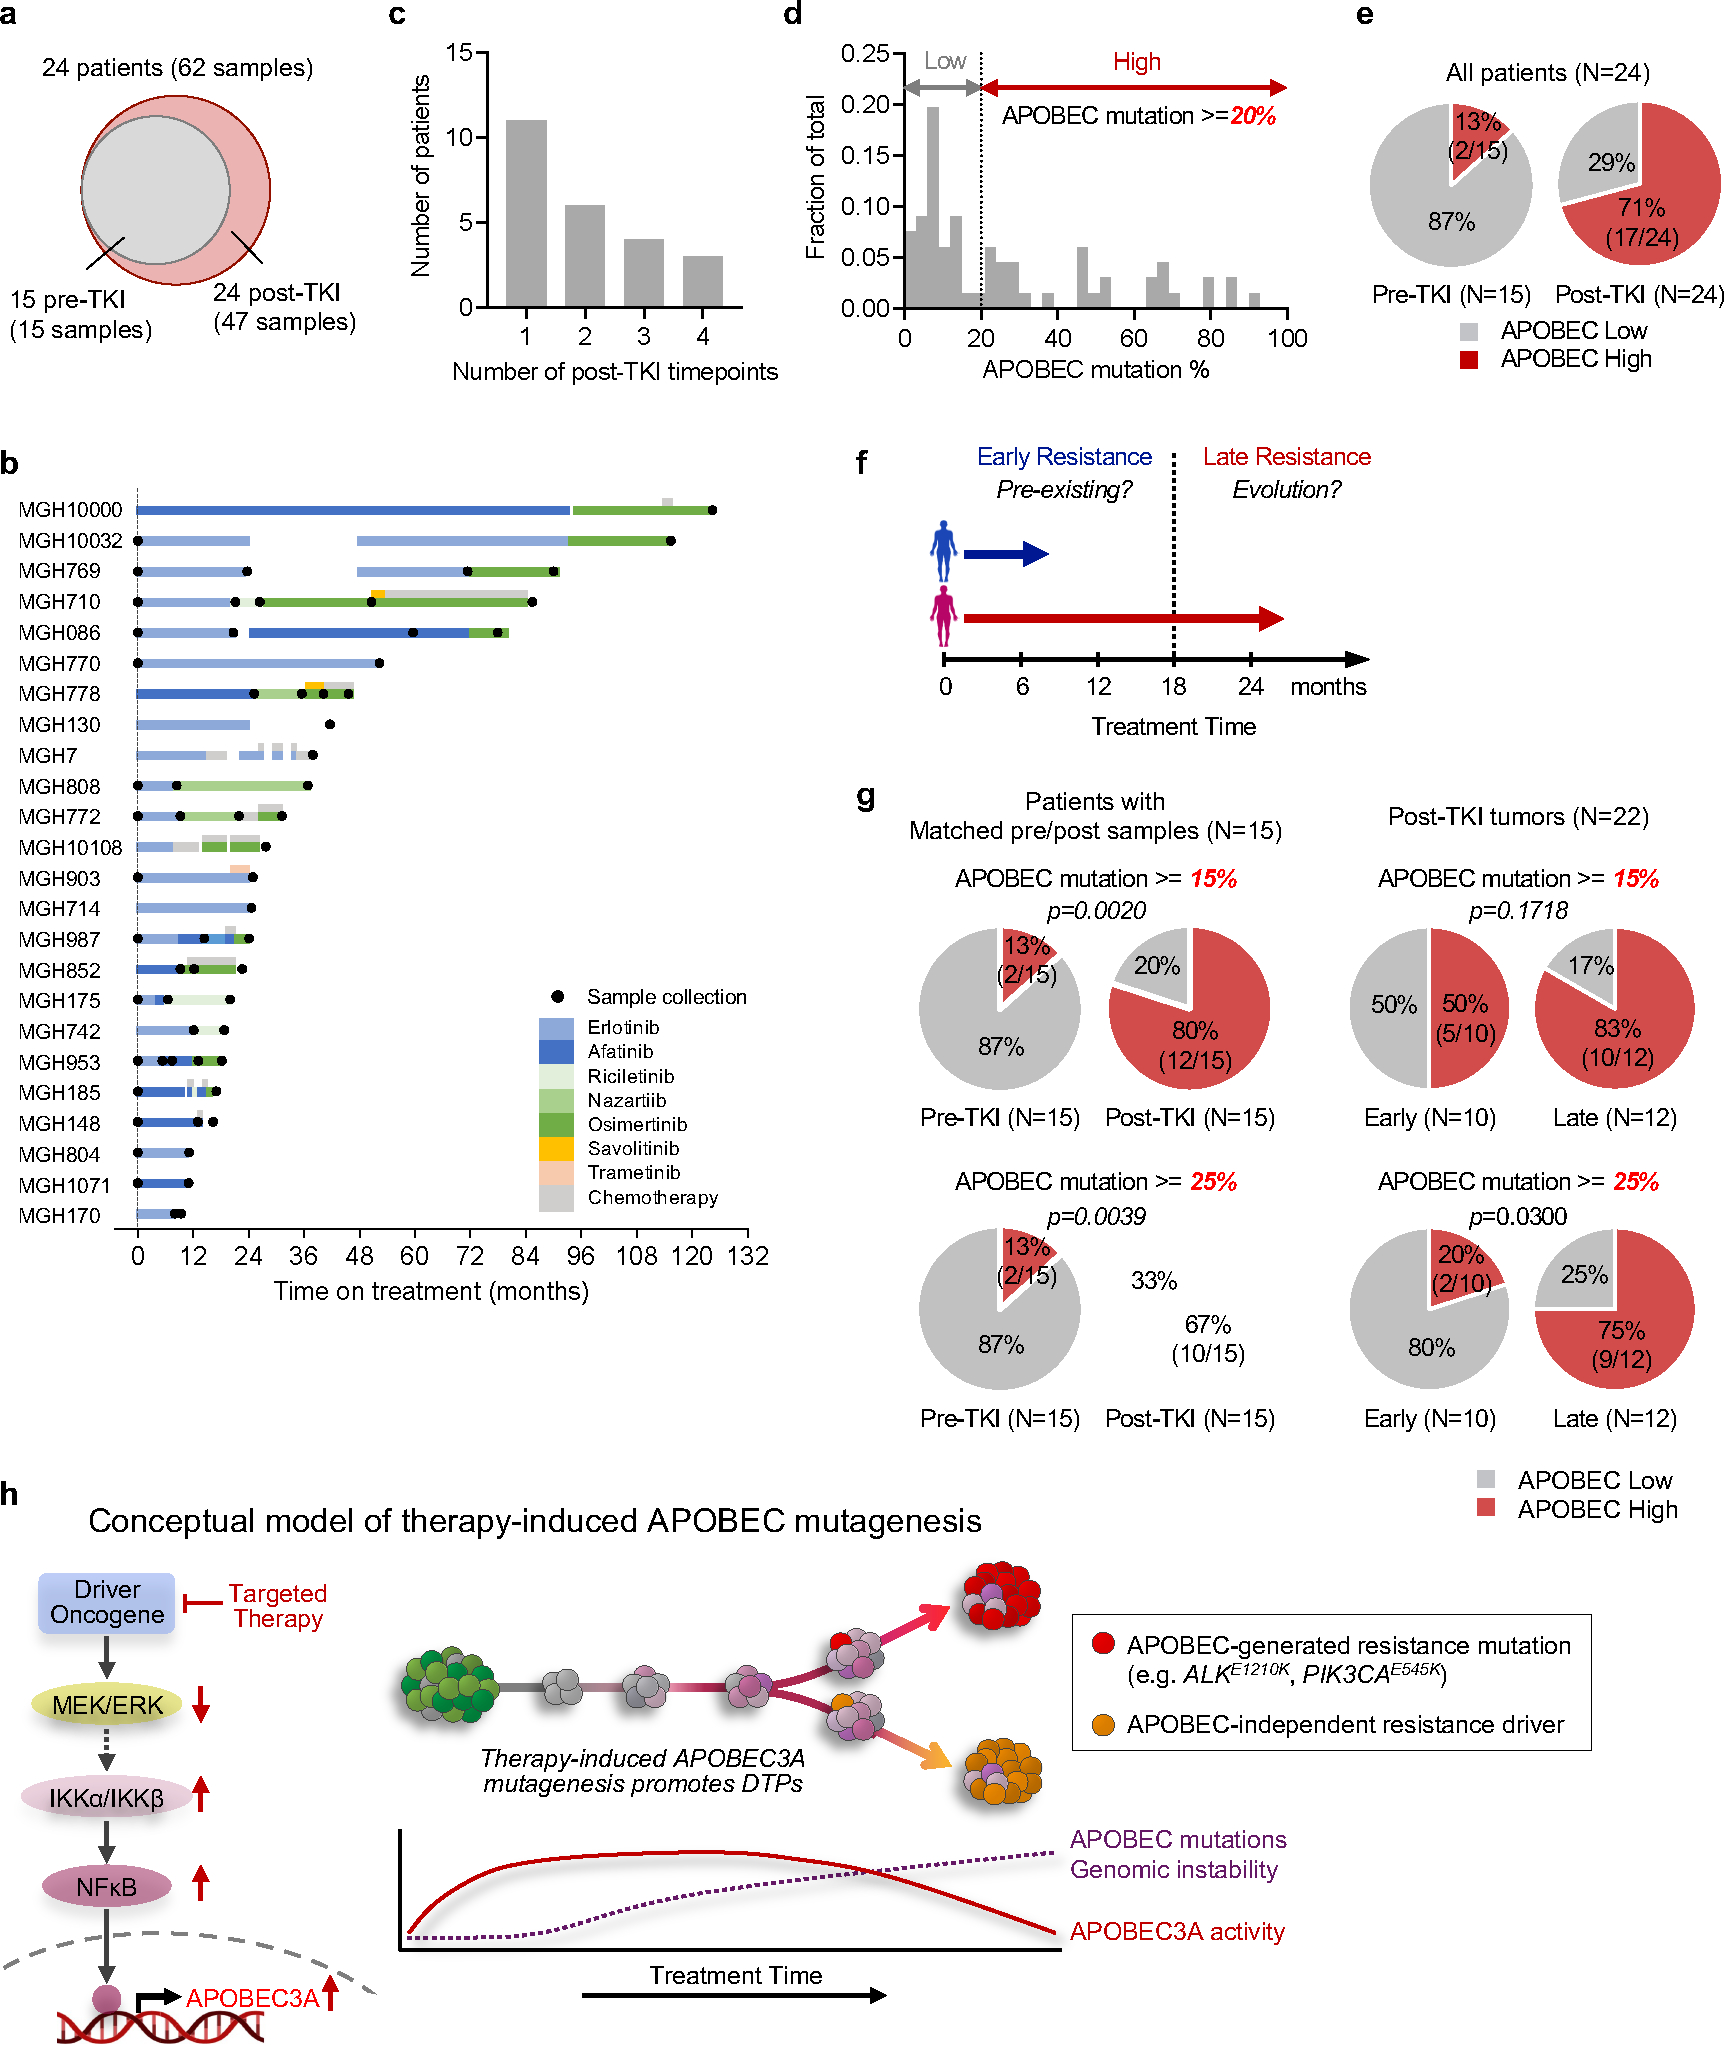
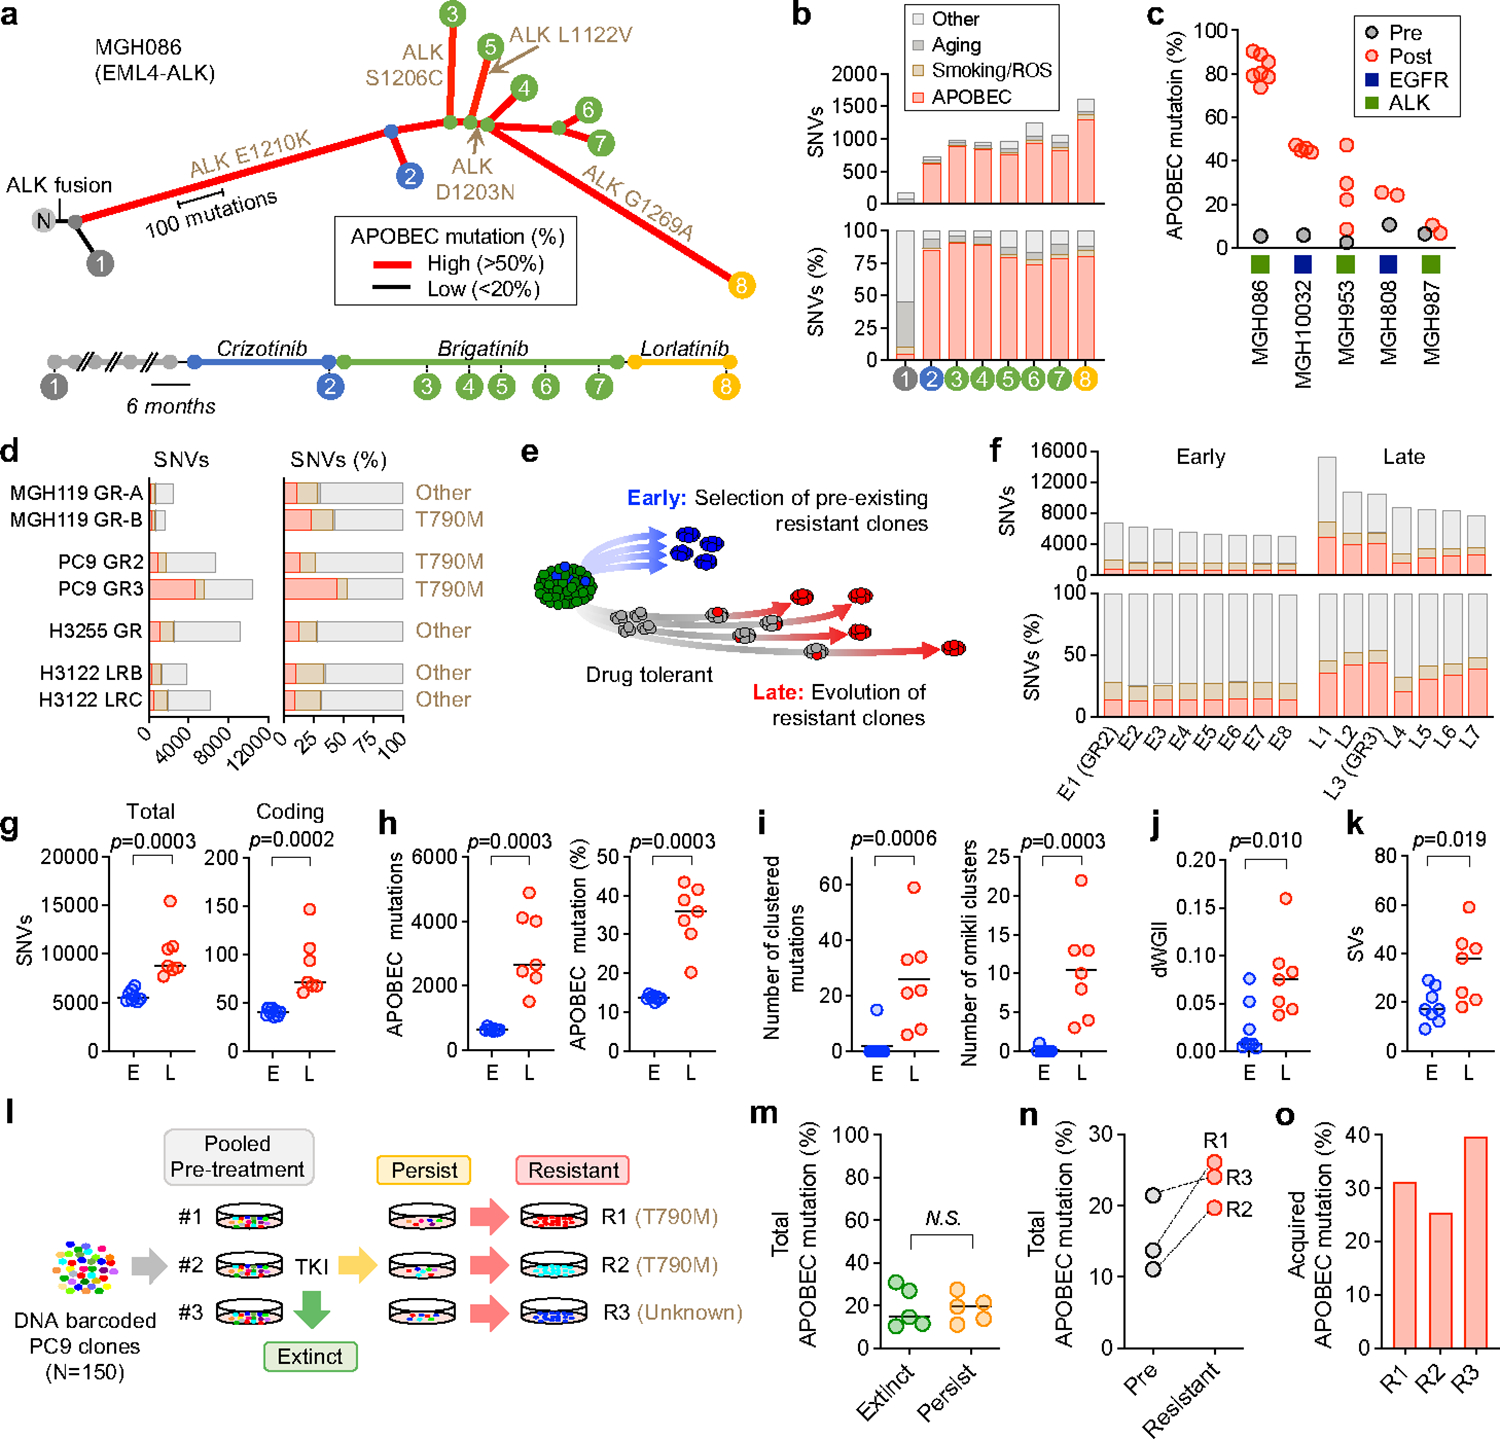
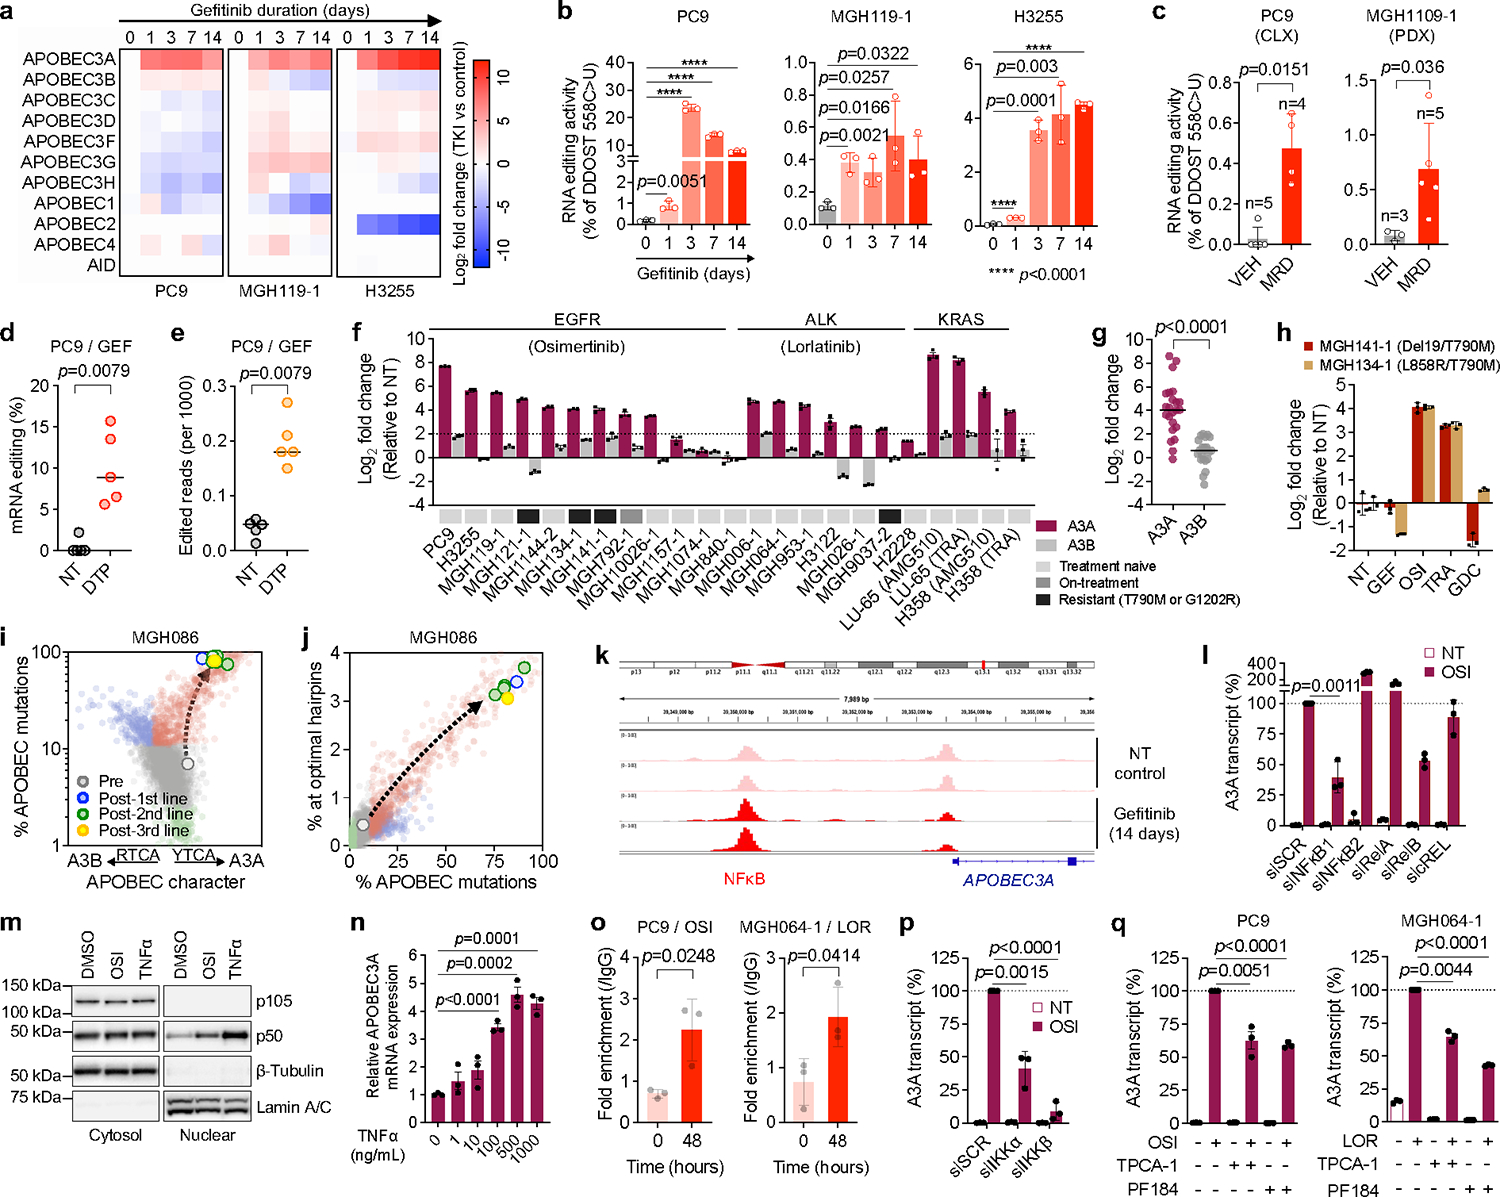
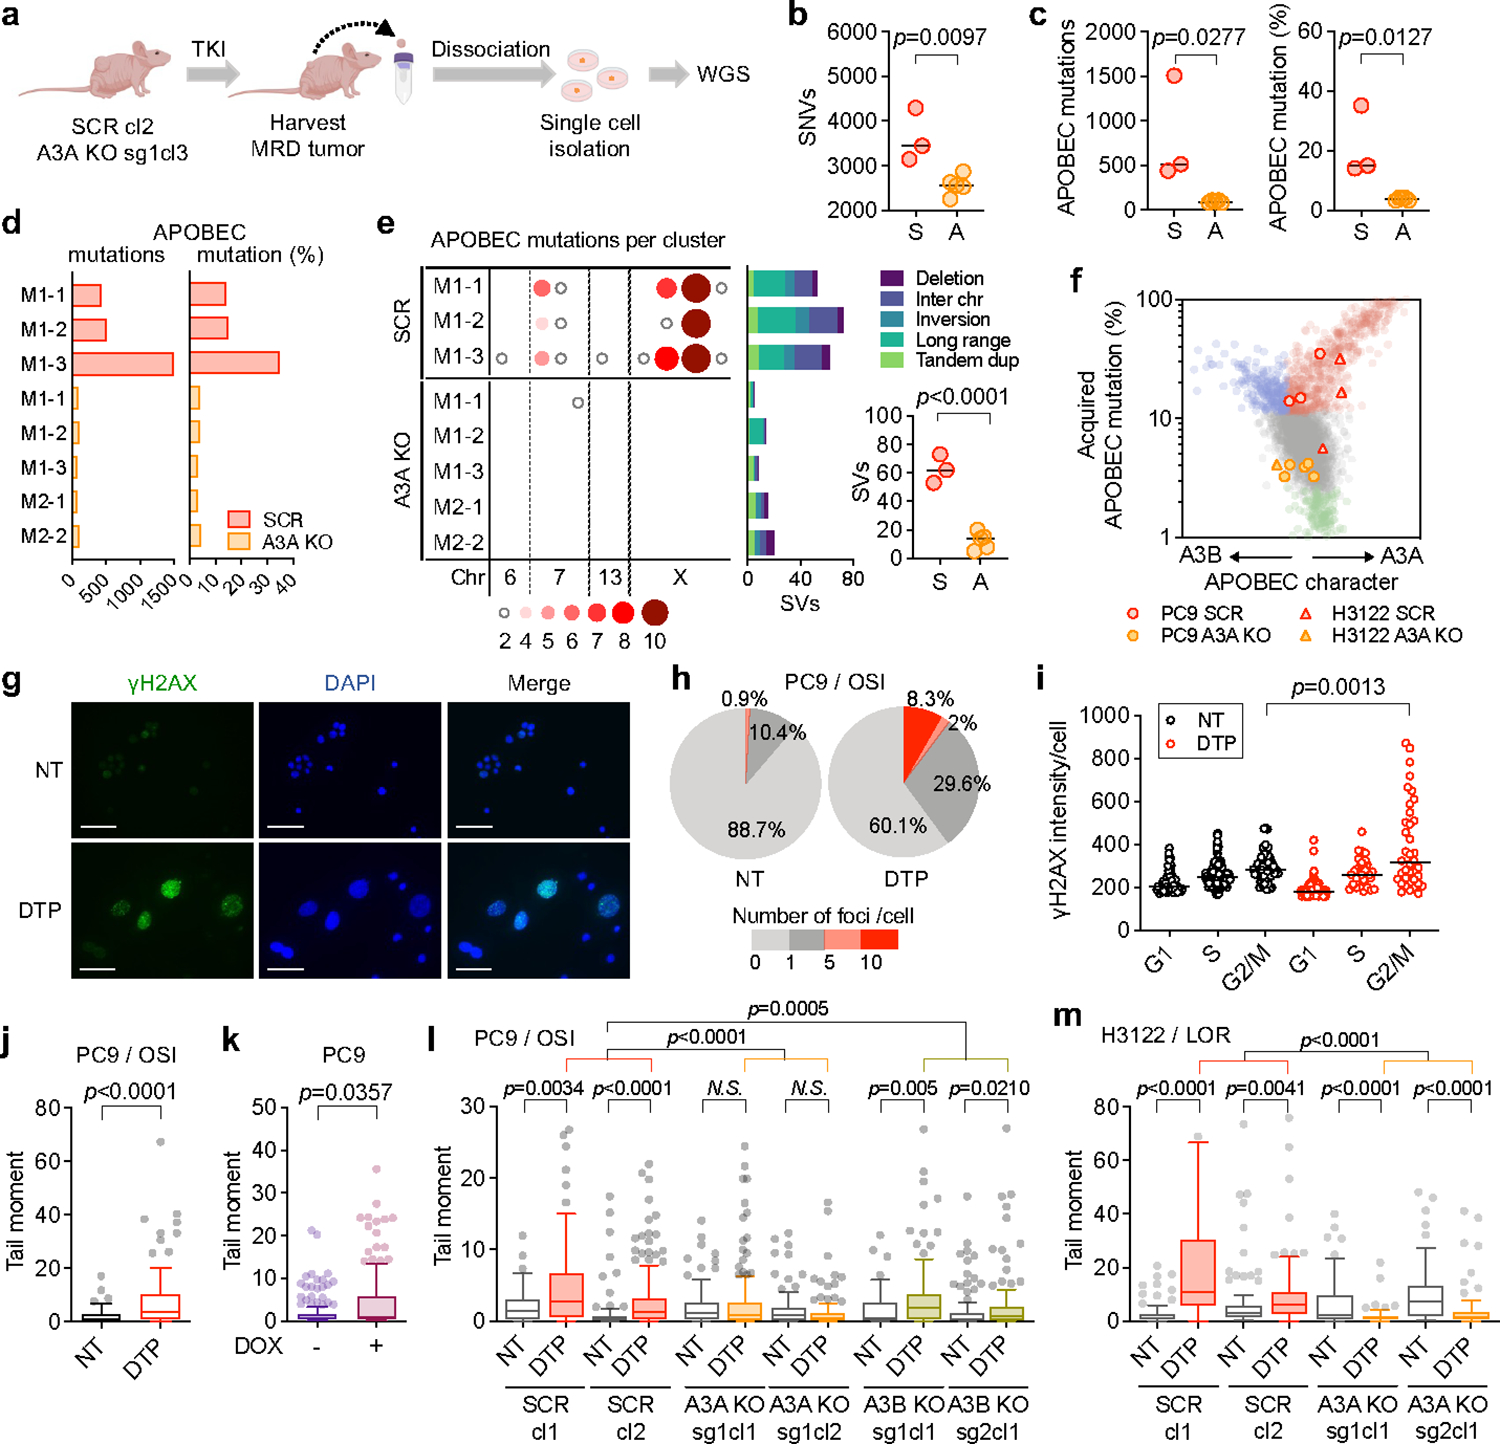
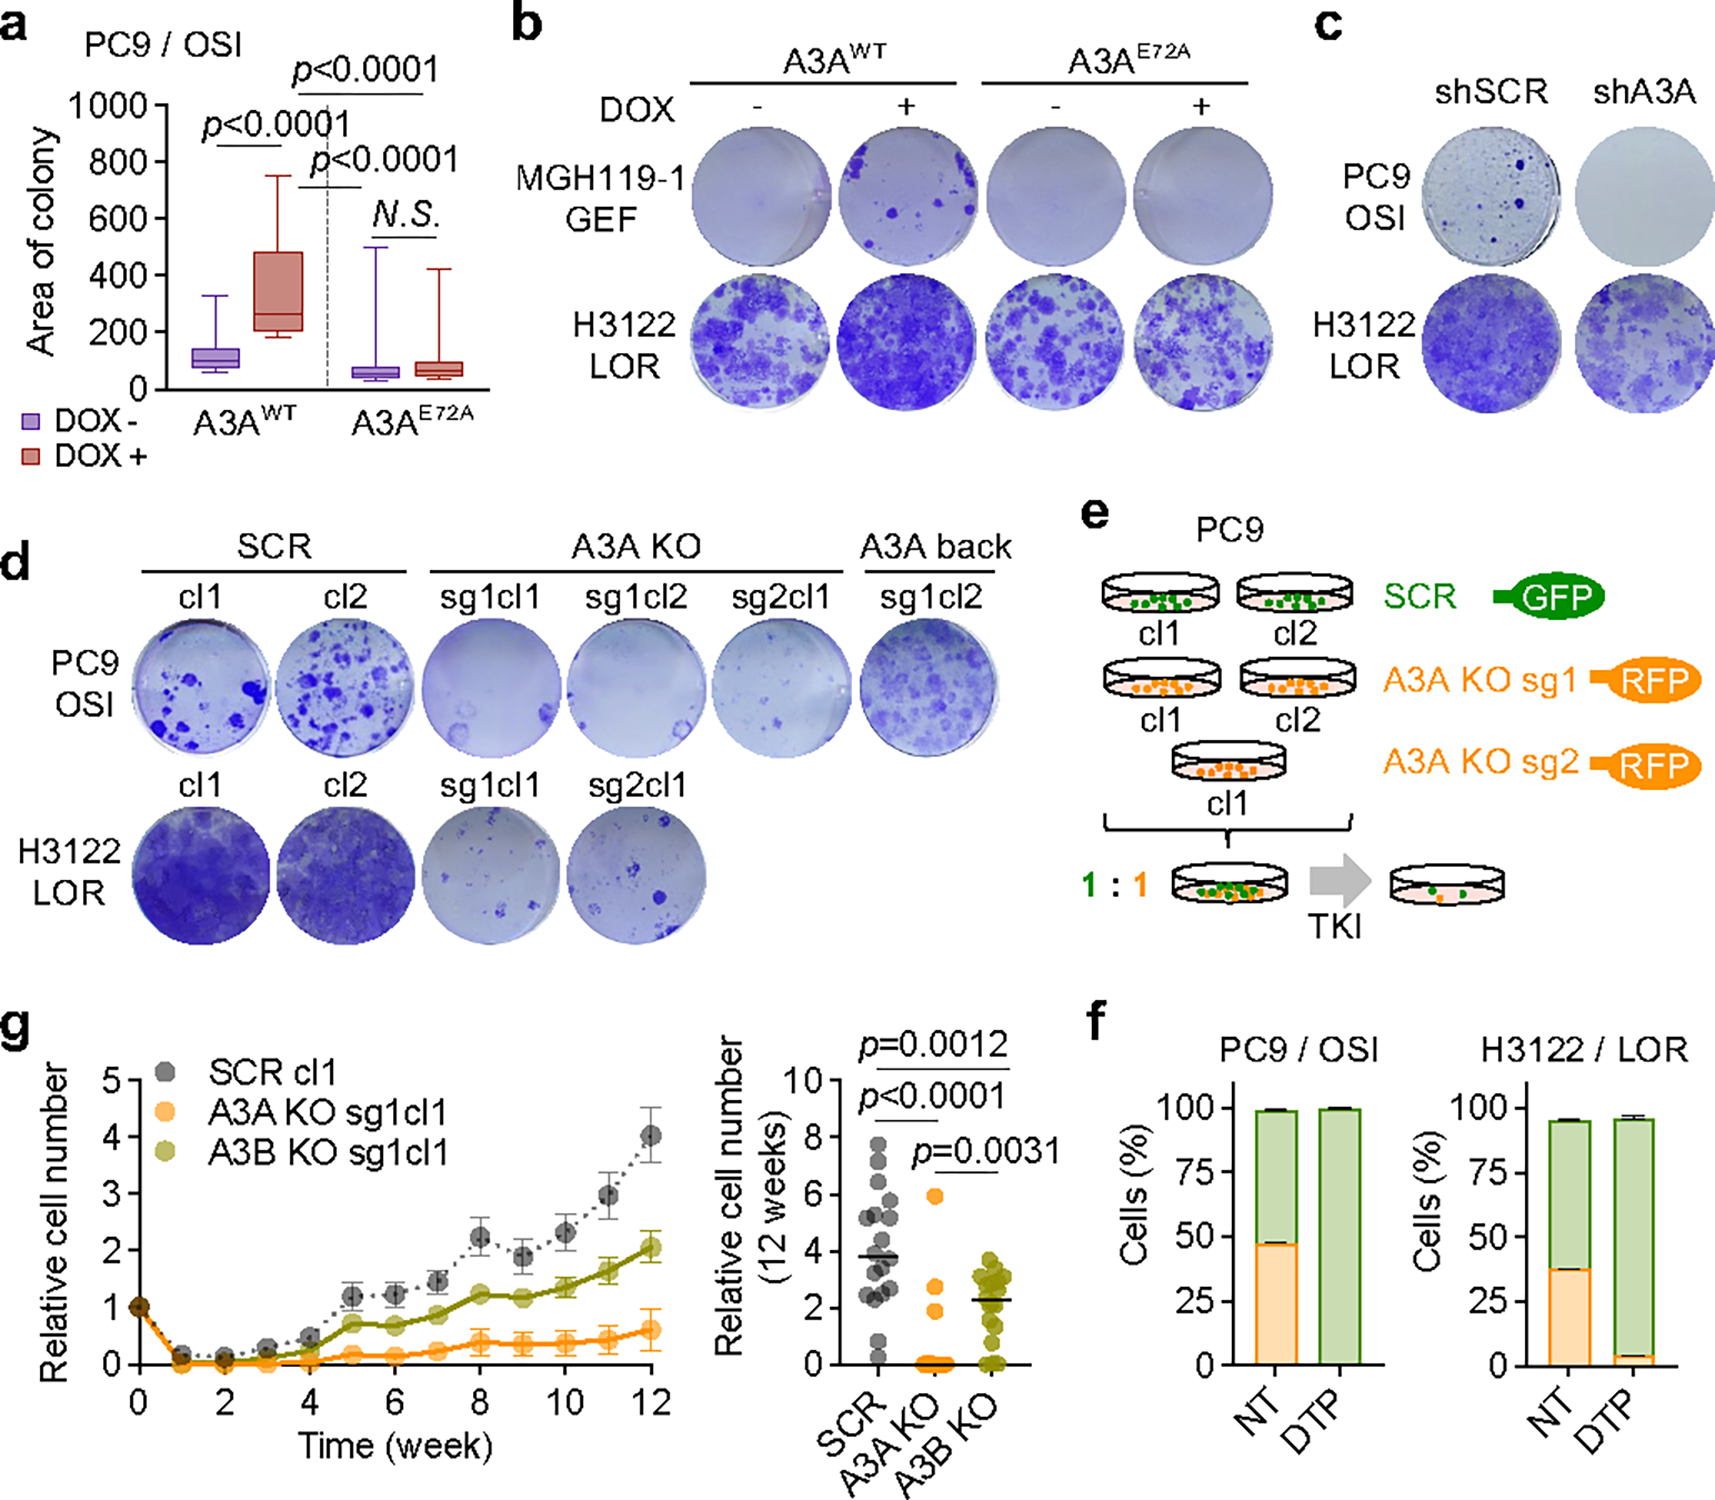
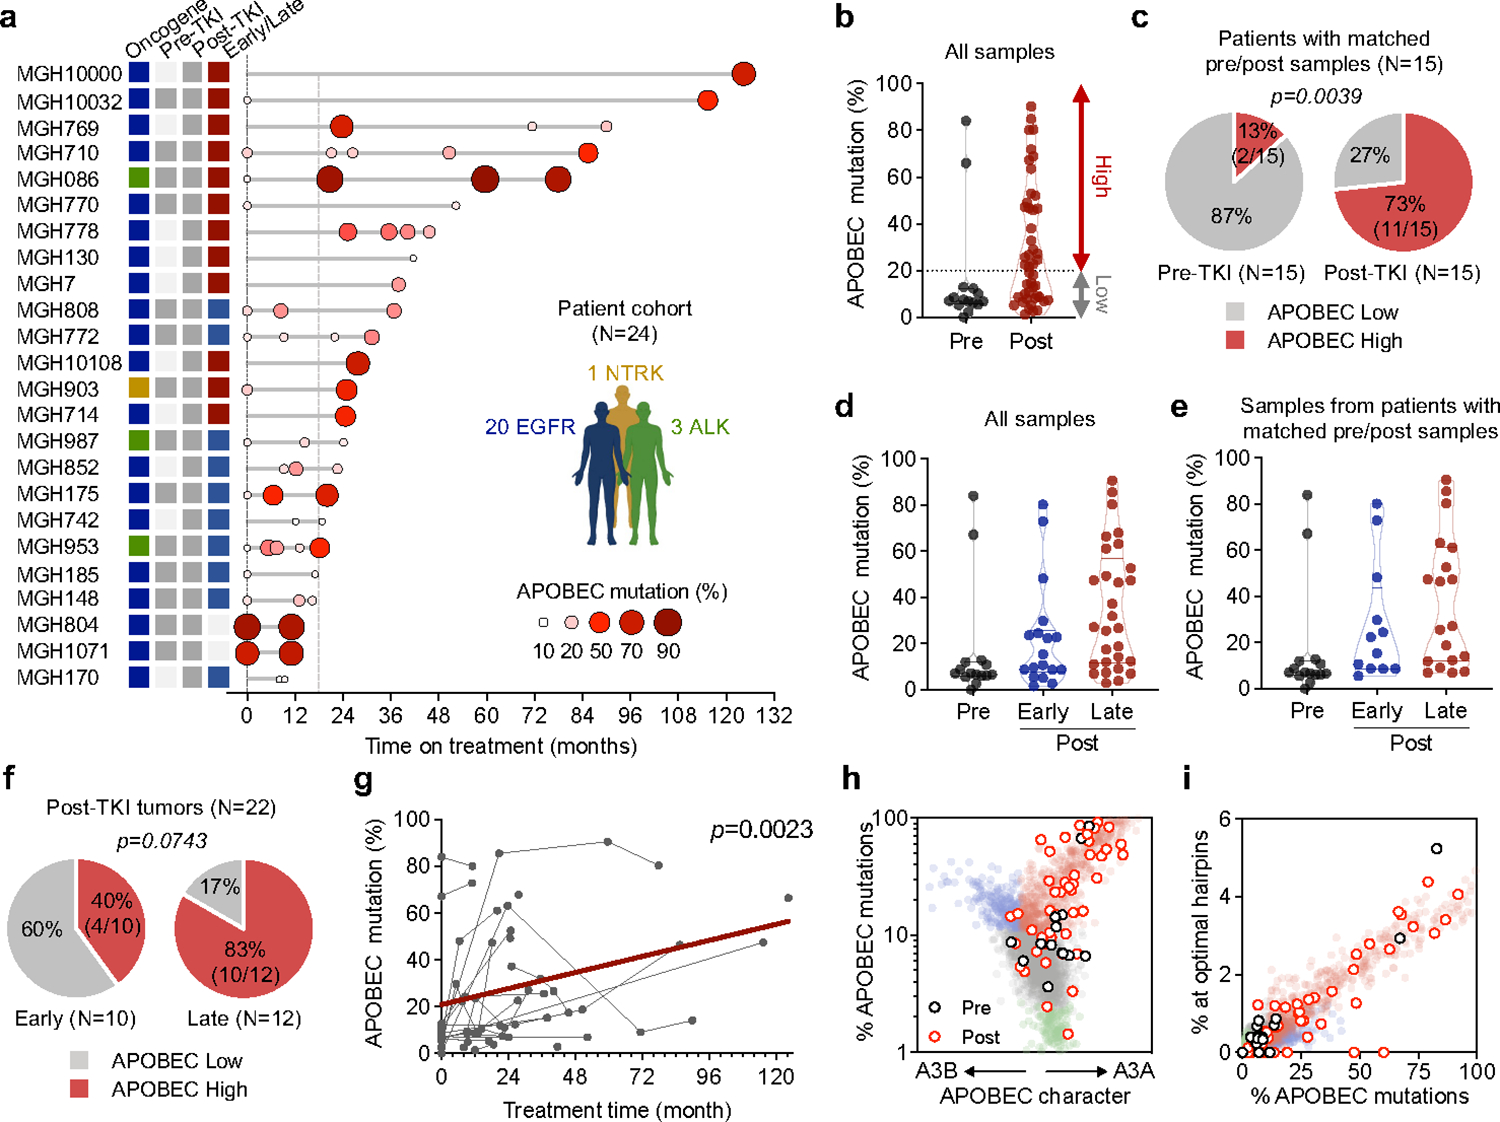
Acquired drug resistance to anticancer targeted therapies remains an unsolved clinical problem. Although many drivers of acquired drug resistance have been identified1-4, the underlying molecular mechanisms shaping tumour evolution during treatment are incompletely understood. Genomic profiling of patient tumours has implicated apolipoprotein B messenger RNA editing catalytic polypeptide-like (APOBEC) cytidine deaminases in tumour evolution; however, their role during therapy and the development of acquired drug resistance is undefined. Here we report that lung cancer targeted therapies commonly used in the clinic can induce cytidine deaminase APOBEC3A (A3A), leading to sustained mutagenesis in drug-tolerant cancer cells persisting during therapy. Therapy-induced A3A promotes the formation of double-strand DNA breaks, increasing genomic instability in drug-tolerant persisters. Deletion of A3A reduces APOBEC mutations and structural variations in persister cells and delays the development of drug resistance. APOBEC mutational signatures are enriched in tumours from patients with lung cancer who progressed after extended responses to targeted therapies. This study shows that induction of A3A in response to targeted therapies drives evolution of drug-tolerant persister cells, suggesting that suppression of A3A expression or activity may represent a potential therapeutic strategy in the prevention or delay of acquired resistance to lung cancer targeted therapy.


Figures

Extended Data Fig. 1 |
Extended Data Fig. 1 |. APOBEC mutational signatures in NSCLC patients with compound resistance mutations.
a, Lego plots of the 7 mutational signatures resolved by NMF with assigned biological process. Smoking and ROS (reactive oxygen species) mutations were mixed. For simplicity, MSI (microsatellite instability), POLE (error-prone polymerase), FFPE (formalin-fixed, paraffin-embedded) and Misc (miscellaneous) signatures are combined and plotted as “Other” throughout the manuscript. Base substitutions were classified into six subtypes and each category was represented by different colors. Base substitutions were further divided into 96 possible mutation types according to the flanking nucleotides surrounding the mutated base. b, Treatment history and acquired compound mutations in MGH086. Treatment lines are colored blue (first-line TKI), green (second-line TKI), yellow (third-line TKI). Five ALK amino acid changes result from base substitutions at TpC sites. c, Mutational signatures (right panel) and clonal relationship of pre-treatment biopsies (left panel) and autopsy sites from patient MGH10032 after sequential EGFR TKI therapy (middle panel). Amino acid substitutions are indicated for each resistance mutation. Branches colors depict the fraction of mutations corresponding to an APOBEC signature. Branches length represents APOBEC mutation number. Treatment timelines were colored blue (first-line TKI) and green (second-line TKI). N, normal. d-f, Mutational signatures and clonal relationship of multiple sequential biopsies from patient MGH953 , MGH808 and MGH987 over the course of sequential TKI therapy. Amino acid substitutions are indicated for each resistance mutation. Branches colors depict the fraction of mutations corresponding to an APOBEC signature. Branches length represents APOBEC mutation number. Treatment timelines were colored blue (first-line TKI), green (second-line TKI), yellow (third-line TKI). N, normal. g, Clonal relationship of MGH119–1 gefitinib resistant clones.
Extended Data Fig. 2 |
Extended Data Fig. 2 |. Detailed clinical histories and mutational heterogeneity of compound mutation cohort.
a, Sample collection timing and resistant driver mutations. Treatment time (month) lines are colored gray (chemotherapy), blue (first-line TKI), green (second-line TKI), yellow (third-line TKI). Samples were derived from surgical resection, biopsy, autopsy or pleural fluid (L lung, left lung; LN, lymph node; PDC, patient-derived cell line; LLL, left lower lobe). b, Heatmaps depict presence of mutations in each sample from MGH086, MGH10032, MGH953, and MGH808. Truncal mutations present in all samples are colored dark gray, shared mutations common to 2 or more samples are colored blue, and private mutations are colored green. APOBEC mutations are indicated in red. The absence of a mutation is denoted by light gray. The primary and resistant driver mutations are shown on the left. The sample numbers correspond to Fig. 1a, Extended Data Fig. 1c–e.
Extended Data Fig. 3 |
Extended Data Fig. 3 |. TKI-resistant clones that evolve from drug-tolerant persister cells accumulate APOBEC mutations.
a, Number and percentage of TCT>TGT and TCA>TGA mutations that are highly specific for APOBEC in early (E) and late (L) resistant clones (bar: median, two-sided Mann Whitney test). b, Number of omikli (n = 2, 3, or 4 mutations with an intermutational distance < 1 kb) and kataegis (n >= 5 mutations with an intermutational distance of < 1 kb) mutation clusters in early and late resistant clones. c, Shared and private mutations in early and late resistant clones. Shared mutations in early resistant clones refer to mutations shared across early clones from one individual. Private mutations in resistant clones refer to mutations observed in only one sample of an individual and are not shared across other samples. d, Phylogenetic tree depicting evolutionary relationships of early and late resistant clones based on pattern of shared and private mutations. e, Mutational signatures of private and shared mutations in PC9 early and late resistant clones. Late resistant clones exhibited significantly higher private APOBEC mutation percentage compared to early resistant clones (two-sided Mann Whitney test). f, Relationship between timing of EGFRT790M mutation, TKI treatment and APOBEC mutational signatures for shared and private mutations.
Extended Data Fig. 4 |
Extended Data Fig. 4 |. Chromosomal aberrations in TKI-resistant clones.
a, Copy number profiles of early and late resistant PC9 clones. b, Copy number changes in each sample are shown on scatter plots where the y-axis is the copy number in the sample, and the x-axis is the copy number in the parental sample it was derived from. Genomic copy number segments are shown for both the minor allele (blue) and major allele (red). Size of points corresponds to the size of the copy-number segments. Points along the diagonal represent genomic segments that did not change in copy number between the parental and derived sample. Points above and below the diagonal represent copy-number gains and losses, respectively, relative to the parental sample (Right panels, two-sided Mann Whitney test). c, Late-evolving PC9 clones have increased SVs compared with early resistant clones. SVs were determined relative to parental cells using dRanger and Breakpointer. d, Circos plots depicting APOBEC mutations, copy number changes, kataegis/omikli mutation clusters and intra/inter-chromosomal interactions in PC9 resistant clones (all relative to parental cells).
Extended Data Fig. 5 |
Extended Data Fig. 5 |. APOBEC mutations do not occur spontaneously while culturing cells in the absence of drug.
a, Determination of the number of persister doublings prior to EGFRT790M acquisition (n = 300, Tukey box and whisker plots). b, Experimental schema. Two rounds of single cell cloning were performed using PC9, E1 (GR2, early resistant, no prior APOBEC) and L2 (late resistant, prior APOBEC) cells. Single cells were expanded ~20–25 doublings to match the number of persister doublings prior to acquisition of EGFRT790M. Whole-genome sequencing was performed on expanded clones. c, APOBEC mutation percentage of shared and private mutations. Shared mutations refer to mutations shared between sequential clones from one individual cell line and represent mutations that were acquired in the distant past. Private mutations refer to mutations observed in only one sample of an individual cell line and are not shared with paired sample. The enrichment of APOBEC signature in shared L2 mutations reflects known accumulation of APOBEC mutations that were acquired during TKI treatment prior to this study. Private mutations that were newly acquired in PC9, E1 (GR2) and L2 cells correspond to those that occurred spontaneously during culture in the absence of drug.
Extended Data Fig. 6 |
Extended Data Fig. 6 |. Lung cancer targeted therapies induce APOBEC3A expression.
a, mRNA expression of APOBEC family genes in response to osimertinib. PC9 cells were treated with 1 μM osimertinib for up to 14 days and gene expression was determined by quantitative RT-PCR. Data are expressed as log2 fold change (FC) relative to untreated control. b, mRNA expression levels (CPM: counts per million) of APOBEC family genes determined by RNA-seq in EGFR-mutant NSCLC cell lines treated with 300 nM gefitinib for 0, 1 and 14 days. Data correspond to BioProject ID PRJNA941908. c, Schema for allele specific droplet digital PCR assay for quantifying A3A editing at the DDOST hairpin hotspot (adapted from Jalili et al.). d, e, Expression of A3A or A3B in PC9 with Tet-On flag-tagged wild-type A3AWT/A3BWT or catalytic inactive mutant A3AE72A/A3BE255Q constructs. Cells were treated with 200 ng/mL doxycycline (DOX) treatment for 72 hours. Protein expression was confirmed by western blot (d). mRNA expression levels were determined by quantitative RT-PCR (e). Data are expressed as relative to untreated control (mean ± s.d. of 3 biological replicates, two-sided Student’s t-test). f, DDOST mRNA editing in PC9 cells overexpressing wild-type A3AWT/A3BWT and catalytic inactive A3AE72A/A3BE255Q mutants. Cells were treated with 200 ng/mL DOX treatment for 72 hours. DDOST editing was determined by ddPCR assay (mean ± s.d. of 3 biological replicates, two-sided Student’s t-test). g, Change of tumor volume in EGFR-mutant NSCLC xenograft models treated with osimertinib at the time of harvesting minimal residual disease (MRD) for DDOST hairpin hotspot analysis in Fig. 2c. h, Top edited hairpin hotspot sites (supported by at least 2 edited reads) in PC9 cells in ApoTrack mRNA-seq analysis in Fig. 2e. The majority are predicted to be synonymous mutations. None of the missense mutations have been reported to be recurrently mutated in cancer.
Extended Data Fig. 7 |
Extended Data Fig. 7 |. Induction of A3A is a common response of oncogene-driven lung cancer cells treated with targeted therapies.
a, Expression of APOBEC family genes in ALK fusion-positive NSCLC cells after treatment with 100 nM lorlatinib as determined by quantitative RT-PCR (3 biological replicates each). b, DDOST mRNA editing in ALK fusion-positive NSCLC cell lines treated with 100 nM lorlatinib for up to 14 days. DDOST editing was determined by ddPCR (mean ± s.d. of 3 biological replicates, two-sided Student’s t-test). c, Expression of A3A and A3B in H358 KRASG12C NSCLC cells treated with 1 μM AMG 510, 1 μM ARS-1620 or 100 nM trametinib for up to 72 hours (3 biological replicates each). d-e, mRNA-seq was performed on H358 KRASG12C NSCLC cells treated with ARS-1620 or trametinib to quantify DDOST (d) and global transcriptome editing (ApoTrack) (e). f-g, Correlation between DDOST mRNA editing activity and mRNA expression of A3A (f) or A3B (g) in EGFR-mutant and ALK fusion-positive NSCLC cell lines. Data is adapted from Fig. 2a, 2b, Extended Data Fig. 7a, 7b (r = Pearson product-moment correlation coefficient). h, Correlation between log2 fold change and baseline mRNA expression of A3A or A3B. Data was adapted from Fig. 2a, 2b, Extended Data Fig. 7a, 7b (r = Pearson product-moment correlation coefficient).
Extended Data Fig. 8 |
Extended Data Fig. 8 |. TKI-induced APOBEC activity and evolutionary history of evolving resistant clones.
a, A3A and A3B expression levels from RNA-seq (GSE75602) performed on parental PC9 cells, PC9 DTP cells after 14 days of gefitinib treatment (GP), early EGFRT790M resistant clone PC9-GR2 and late EGFRT790M resistant clone PC9-GR3 (previously described in Hata and Niederst et al. ). PC9 cells were treated with gefitinib, PC9-GR2/GR3 cells were treated with the third-generation EGFR inhibitor WZ4002 (all for 24 hours). b, Percentage of DDOST hotspot reads with A3A editing in PC9 and PC9-GR2/GR3 cells treated with gefitinib or WZ4002, respectively. c, A3A induction and suppression of EGFR downstream signaling. NSCLC cells were treated with or without 1 μM gefitinib, 1 μM osimertinib, 100 nM trametinib or 1 μM GDC0941 for 24 hours. Expression of A3A was determined by quantitative RT-PCR (upper panel). Data are expressed as log2 fold change relative to non-treated control (NT) (mean ± s.d. of 3 biological replicates). Western blot of AKT and ERK phosphorylation (lower panel). d, Summary of the relationship between EGFR signaling and A3A mRNA expression during targeted therapy in PC9 early and late resistant clones.
Extended Data Fig. 9 |
Extended Data Fig. 9 |. A3A vs A3B character of mutations in resistant tumors derived from NSCLC Patients.
a-d, A3A (YTCA) and A3B (RTCA) character (upper panels) and A3A hairpin motif mutations (lower panels) of pre- and post-treatment MGH119–1 (a), PC9 (b, c) and patient tumors (d). A reference set of ~2600 WGS-analyzed tumors from the International Cancer Genome Consortium (ICGC) Pan-Cancer Analysis of Whole Genomes (PCAWG) project is plotted for comparison. Samples were designated APOBEC+ if ≥10% of total mutations were assigned to the APOBEC mutation signature by NMF analysis, then classified according to A3A vs. A3B character: A3A-dominated samples (enrichment of mutations at YTCA tetranucleotides) are colored red, A3B-dominated samples (enrichment of mutations at RTCA tetranucleotides) are colored blue. Samples with 2.5–10% APOBEC mutations are colored grey. APOBEC- samples (< 2.5% APOBEC mutations) are colored green. e, A3A (YTCA) and A3B (RTCA) character (upper panels) or A3A hairpin motif mutations (lower panels) of transformed small cell lung cancer (SCLC) (red symbols) and corresponding lung adenocarcinoma (LUAD) (gray symbols). Tumors from the same patient are connected by a dashed line. Right panels depict pre- and post-transformation tumors described in Lee et al. (PCD, patient-derived cell line; lu, lung metastasis; li, liver metastasis; d, diaphragm metastasis) f, Metastatic sites and mutational signatures from MGH7 autopsy . g, Clinical history, mutational signatures of serial biopsies from patient MGH772 (RUL, right upper lobe, PDC, patient-derived cell line).
Extended Data Fig. 10 |
Extended Data Fig. 10 |. NFκB1 mediates TKI-induced A3A expression.
a, Chromatin accessibility profile of the APOBEC3 locus (chromosome 22) of PC9 cells treated with 300 nM gefitinib for 0 or 14 days (2 biological replicates), with expanded view of the A3A promoter region. Relative fold-change of peak accessibility in treated vs. non-treated control cells is shown. Transcription factors mapping to these peak regions were identified from the ENCODE database. b, Differential z-score (gefitinib vs. control) of global motif accessibility scores for each identified transcription factor family. c, Knockdown efficacy of each SMARTPool siRNA in PC9 cells. (SCR = scrambled control siRNA) d, Expression of A3A in PC9 cells transfected scrambled or individual NFκB1 siRNAs. Cells were treated with osimertinib for 24 hours and mRNA expression was determined by quantitative RT-PCR (mean ± s.d. of 3 biological replicates, two-sided Student’s t-test). Knockdown efficacy was confirmed by western blot. e, Knockdown efficacy of each SMARTPool siRNA in PC9 cells. f, Western blot of PC9 and MGH064–1 cells after treatment with TKI (osimertinib or lorlatinib) and IKKβ inhibitors (representative of 3 biological replicates).
Extended Data Fig. 11 |
Extended Data Fig. 11 |. TKI-induced APOBEC3A increases DNA damage and emergence of drug-tolerant cells.
a, TKI-induced DDOST RNA editing in PC9 CRISPR scrambled (SCR) or A3A knockout (KO) clones (cl, clone; sg, sgRNA). Cells were treated with or without 1 μM osimertinib for up to 3 days and DDOST editing was determined by digital PCR (SCR cl3, n = 4; others, n = 3 biological replicates, mean ± s.d., two-sided Student’s t-test). b, Acquired SNVs stratified by mutation signature, and shown as count (upper) or percentage (lower) in resistant clones derived from MRD mice tumors (M = MRD mouse; −1, −2, −3 = single cell clone 1, 2, 3). Each MRD clone was compared to its matched pre-treatment clone to identify acquired mutations. c, Expression of A3A in H3122 CRISPR SCR or A3A KO cells treated with 1 μM lorlatinib for up to 3 days. mRNA expression was determined by quantitative RT-PCR (mean ± s.d. of 3 biological replicates, two-sided Student’s t-test). d, Acquired SNVs stratified by mutation signature, and shown as count (upper) or percentage (lower) in clones derived from H3122 DTP cells. H3122 CRISPR SCR or A3A KO cells were treated with 0, 0.3, 1 μM lorlatinib for 8 weeks and single cell clones were expanded for WGS (−1, −2, −3 = single cell clone 1, 2, 3). Each DTP clone was compared to its matched pre-treatment clone to identify acquired mutations. Of note, only a single H3122 A3A KO clone could be recovered after lorlatinib treatment due to the increase in drug sensitivity associated with knockout of A3A. e, Acquired APOBEC mutation number (left) or percentage (right) in DTP clones. Each resistant clone was compared to its matched pre-treatment clone to identify acquired mutations (A3A KO sg2cl1, n = 1; others n = 3, mean ± s.d.). f, Representative images of cells in G1, S and G2 phase; scale bars = 10 μm (upper). Scatter plots of EdU cell cycle assay in Fig. 3i (lower). PC9 cells were treated with 1 μM osimertinib for 14 days and stained with EdU/DAPI to resolve cell cycle phase, and γH2AX to quantify DNA damage. g, Western blot for APOBEC3B (A3B) expression in PC9 CRISPR A3B KO or siRNA A3B. h, Survival of PC9 Tet-On overexpressing A3A. Cells were treated with 1 μM osimertinib for 4 weeks and DTP colonies were visualized by crystal violet. Colony area was quantified by imageJ. The individual and aggregate area of the largest 30 colonies for each experimental condition is shown. i, MGH119–1 A3AWT or A3AE72A cells were treated with 200 ng/mL DOX for 72 hours to induce A3A expression. mRNA expression was determined by quantitative RT-PCR (mean ± s.d. of 3 biological replicates, two-sided Student’s t-test). j, Knockdown efficacy of PC9 (left) or H3122 (right) transduced with A3A shRNA. Cells were treated with 1 μM gefitinib or 1 μM lorlatinib. mRNA expression was determined by quantitative RT-PCR (mean ± s.d. of 3 biological replicates, two-sided Student’s t-test). k, Re-expression of A3A in PC9 CRISPR A3A KO cells (“A3A back”). Cells were treated with 200 ng/mL DOX for 72 hours to induce A3A expression, which was verified by quantitative RT-PCR (mean ± s.d. of 3 biological replicates, two-sided Student’s t-test). l, Schema of competition assay using fluorescently labeled A3A KO/SCR cells. H3122 CRISPR SCR (GFP labeled) and A3A KO (RFP labeled) cells were mixed in a 1:1 ratio and treated with 1 μM lorlatinib for 4 weeks.
Extended Data Fig. 12 |
Extended Data Fig. 12 |. APOBEC mutations are enriched in NSCLCs with acquired TKI resistance.
a, Distribution of tumor samples by TKI treatment timepoint. b, Treatment history and sample collection time of 24 NSCLC patients. Time on treatment was counted from the starting date of 1st-line TKI treatment. The following patients received chemotherapy treatment before 1st-line TKI treatment: MGH10032, MGH086, MGH778, MGH130, MGH903, MGH742 and MGH804. MGH patient codes and order correspond to Fig. 5a. The treatment timeline is colored according to specific therapy received. c, Number of post-TKI timepoints per patient. d, Distribution of APOBEC mutation percentages in all samples. APOBEC mutation >= 20% was defined as APOBEC “high” and less than 20% was “low”. e, Frequency of APOBEC-high tumors in all patients (n = 24). f, Schema of early versus late acquired resistance. Tumor samples were divided into two groups based on duration of TKI treatment: less (early) or greater (late) than 18 months. g, Frequency of patients APOBEC-high tumors using different thresholds for defining high versus low (APOBEC mutation >= 15% or 25%). Two-sided McNemar’s test was used to compare the two groups (e, g). h, Conceptual diagram for evolutionary trajectory and APOBEC mutational burden of evolving persistent cancer cells during targeted therapy. i, Examples of acquired (validated) driver mutations in the APOBEC context.
Fig. 1 |
Fig. 1 |. APOBEC mutational signatures are associated with clonal evolution driven by lung cancer targeted therapies.
a, APOBEC mutational signatures and clonal relationship of tumors with acquired ALK resistance mutations from patient MGH086 over the course of sequential ALK TKI therapy (N, matched normal tissue). b, Total SNVs in each MGH086 tumor sample, stratified by mutation signature and shown as total count (upper) or percentage (lower). c, APOBEC mutation percentage in NSCLC tumors with acquired compound resistance mutations. d, Private mutations classified by mutation signature in TKI-resistant models. Private mutations are those observed in an individual resistant cell line and not shared across other samples or the parental cell line. Signature colors correspond to Fig. 1b. e, Evolutionary trajectories of early and late resistant PC9 EGFRT790M clones. f, Acquired SNVs classified by mutation signature in resistant models in PC9 early and late resistant clones. Each resistant clone was compared to parental PC9 cells to identify acquired mutations. Signature colors correspond to Fig. 1b. g-k, Total and coding mutations (g), APOBEC mutations (h), APOBEC-associated clustered mutations (TpC > T, G or A with an inter-mutational distance less than 1 kb) and omikli clusters containing 2–4 mutations (i), dWGII (j), and SVs (k) in PC9 early (E, n = 8) and late clones (L, n=7). l, Schema of PC9 lineage-tracing study. m, Baseline APOBEC mutation (%) of pre-treatment clones that went extinct upon TKI treatment (n = 5) or persisted (n = 5). n, APOBEC mutation (%) of matched pre-treatment and resistant clones. o, Acquired APOBEC mutation (%) in resistant clones. Each resistant clone was compared to its matched pre-treatment clone to identify acquired mutations. Significant p values were determined by two-sided Mann Whitney test (g-k, m).
Fig. 2 |
Fig. 2 |. Targeted therapies can induce APOBEC3A.
a, Expression of APOBECs by quantitative RT-PCR (3 biological replicates) in EGFR NSCLC cell lines. b, DDOST mRNA editing determined by ddPCR (mean ± s.d. of 3 biological replicates, two-sided Student’s t-test). c, DDOST mRNA editing in control (VEH) and osimertinib-treated EGFR-mutant xenograft MRD tumors (mean ± s.d. of 3–5 independent tumors, two-sided Mann Whitney test). d-e, DDOST (d) and transcriptome-wide editing of A3A hairpin motifs (e) in mRNA-seq reads from control and gefitinib-treated DTPs (5 biological replicates, bar: median, two-sided Mann Whitney test. NT, non-treated control). f-g, Individual (f) or aggregate (g) TKI-induced A3A and A3B expression in NSCLC cells (TRA, trametinib; g, bar: median, two-sided Student’s t-test). h, A3A expression in resistant EGFR NSCLC cells. i-j, A3A (YTCA) and A3B (RTCA) character (i) and A3A hairpin motif (j) mutations in MGH086 tumors. Reference tumors from the ICGC/PCAWG consortium are plotted for comparison as described in Extended Data Fig. 9 (A3A - red, A3B - blue, APOBEC < 2.5% - green). k, Chromatin accessibility of APOBEC3A locus in PC9 DTPs (2 biological replicate). l, TKI-induced A3A expression in PC9 cells after knockdown of NFκB pathway genes. m, Western blot of PC9 cells treated with osimertinib or TNFα (representative of three independent experiments). n, A3A expression in PC9 cells treated with TNFα. o, NFκB1 binding to A3A enhancer locus in TKI-treated NSCLC cells determined by ChIP-PCR (mean ± s.d. of 3 biological replicates, two-sided Student’s t-test). p-q TKI-induced A3A expression in PC9 cells after IKKα/β knockdown (p) or treatment with IKKβ inhibitors (q). mRNA expression (f, h, l, n, p-q) was determined by quantitative RT-PCR (mean ± s.d. of 3 biological replicates); significant p values (l, n, p-q) were determined by two-sided Student’s t-test.
Fig. 3 |
Fig. 3 |. TKI-induced APOBEC3A promotes DNA damage and chromosomal aberrations in drug-tolerant persister cells.
a, Schema of in vivo study of A3A and genomic instability (cl, clone; sg, sgRNA). Clones derived from PC9 MRD tumors were compared to the matched pre-treatment CRISPR clone (SCR, scrambled sgRNA; A3A KO, A3A sgRNA) to identify mutations newly acquired during TKI treatment. b-c, Acquired SNVs (b) and APOBEC mutations (c) in clones from MRD tumors (each dot represents an independent clone, bar: median, two-sided Student’s t-test, S = SCR, A = A3A KO). d-e, Total acquired (d) and clustered (e) APOBEC mutations and SVs (e) in individual MRD clones (e, bar: median, two-sided Student’s t-test). f, A3A (YTCA) and A3B (RTCA) character of acquired mutations in PC9 and H3122 (lorlatinib 1 μM) A3A KO persister clones. g-h, Immunofluorescence images and quantification of γH2AX in foci in untreated (NT) or osimertinib-treated PC9 DTPs (scale bars = 70 μm). Data are representative of three independent experiments. i, γH2AX fluorescence according to cell cycle phase, as determined by EdU/DAPI staining (see Extended Data Fig. 11f). Data are representative of two independent experiments (NT, n = 54; DTP, n = 38, bar: median, two-sided Student’s t-test). j, DSBs in PC9 DTP cells determined by neutral comet assay (n = 85 each). k, DSBs in PC9 cells overexpressing A3A upon doxycycline (DOX) induction (n = 150 each). l, m, DSBs in PC9 (n = 105 each) (l) and H3122 (m) SCR and A3A KO DTPs (n = 95 each). Data are displayed as Tukey box and whisker plots and are representative of three independent experiments with similar results and analyzed by two-sided Mann-Whitney test (j-m). DTPs = PC9 osimertinib DTP cells (g-j)
Fig. 4 |
Fig. 4 |. TKI-induced APOBEC3A increases emergence of drug-tolerant persister cells.
a, Effect of A3A expression on PC9 DTP formation. Tet-On A3AWT or A3AE72A cells were treated with DOX for 14 days to induce A3A expression, then treated with osimertinib for 4 weeks. The area of the 30 largest DTP colonies was quantified. Data are representative of three independent experiments with similar results (n = 30 colonies each, Tukey box and whisker plots, two-sided Student’s t-test). b, DTP colonies of MGH119–1 and H3122 cells with DOX-induction of A3AWT or A3AE72A (as in panel a) after gefitinib or lorlatinib treatment, respectively. c, DTP colonies of PC9 or H3122 cells with shRNA A3A knockdown after TKI treatment. Data are representative of three independent experiments. d, DTP colonies of PC9 or H3122 SCR or A3A KO clones, or with re-expression of A3A (A3A back), after TKI treatment (cl, clone; sg, sgRNA). Data are representative of three independent experiments. e, Schema of competition assay using fluorescently labeled A3A KO/SCR cells. SCR (GFP) and A3A KO (RFP) cells were mixed in a 1:1 ratio and treated with TKIs for 4 weeks. f, Surviving PC9 (left) or H3122 (right) DTPs were quantified by flow cytometry. Data are representative of three independent experiments. g, Effect of A3A on emergence of resistant cells over time. Replicate pools (5,000 cells, n=18) of PC9 SCR, A3A KO or A3B KO cells were treated with osimertinib for 12 weeks and cell number was assessed using RealTime-Glo assay. Left, cell survival curve (mean ± s.e.m.); right, cell number of each pool at week 12 (bar: median, two-sided Student’s t-test).
Fig. 5 |
Fig. 5 |. APOBEC mutations are enriched in NSCLCs with acquired TKI resistance.
a, APOBEC mutation percentage in tumor samples from 24 NSCLC patients treated with targeted therapies. Left columns represent driver oncogenes (blue: EGFR, green: ALK, yellow: NTRK) and existence of pre/post-treatment samples (gray: yes, white: no). Patients with first progression before or after 18 months are designated “early” (blue) or “late” (red), respectively. For patients with multiple concurrent on-treatment or autopsy samples (MGH086, MGH10032, MGH953), the sample with the highest APOBEC mutation percentage was used. b, APOBEC mutation percentage in all pre-treatment (n = 15) and post-treatment (n = 47) samples. APOBEC mutation >= 20% was defined as APOBEC “high” and less than 20% “low”. c, Frequency of APOBEC-high tumors in patients with matched pre- and post-treatment samples (McNemar’s test). d, APOBEC mutation percentage in all tumor samples. Pre-treatment (n = 15), post-treatment (early, n = 18) and post-treatment (late, n = 29). e, APOBEC mutation percentage in all tumors from the 15 patients with pre-TKI samples. Pre-treatment (n = 15), post-treatment (early, n = 12) and post-treatment (late, n = 19). f, Frequency of APOBEC-high tumors in patients with early resistant samples or only late resistant samples (McNemar’s test), excluding the two patients (MGH804 and MGH1071) with baseline APOBEC-high tumors prior to treatment. g, Correlation between APOBEC mutation percentage and treatment time in all samples (n = 62) from the 24 patients. A mixed-effects model was fitted to assess APOBEC mutation percentage in serial tumor samples as a function of treatment duration with patients treated as random effects. h-i, A3A (YTCA) and A3B (RTCA) character (h) and A3A hairpin motif mutations (i) of pre- and post-treatment tumors from all 24 patients. Significant p values were determined based on two-sided hypothesis (c, f, g).

Comment in

  • APOBEC3A drives resistance.
    Villanueva MT. Villanueva MT. Nat Rev Drug Discov. 2023 Sep;22(9):695. doi: 10.1038/d41573-023-00122-9. Nat Rev Drug Discov. 2023. PMID: 37524811 No abstract available.

References

    1. Kobayashi S et al. EGFR mutation and resistance of non-small-cell lung cancer to gefitinib. N Engl J Med 352, 786–792 (2005). 10.1056/NEJMoa044238 - DOI - PubMed
    1. Engelman JA et al. MET amplification leads to gefitinib resistance in lung cancer by activating ERBB3 signaling. Science 316, 1039–1043 (2007). 10.1126/science.1141478 - DOI - PubMed
    1. Sequist LV et al. Genotypic and histological evolution of lung cancers acquiring resistance to EGFR inhibitors. Sci Transl Med 3, 75ra26 (2011). 10.1126/scitranslmed.3002003 - DOI - PMC - PubMed
    1. Gainor JF et al. Molecular Mechanisms of Resistance to First- and Second-Generation ALK Inhibitors in ALK-Rearranged Lung Cancer. Cancer Discov 6, 1118–1133 (2016). 10.1158/2159-8290.CD-16-0596 - DOI - PMC - PubMed
    1. Salter JD, Bennett RP & Smith HC The APOBEC Protein Family: United by Structure, Divergent in Function. Trends Biochem Sci 41, 578–594 (2016). 10.1016/j.tibs.2016.05.001 - DOI - PMC - PubMed

Extended References

    1. Crystal AS et al. Patient-derived models of acquired resistance can identify effective drug combinations for cancer. Science (New York, N.Y.) 346, 1480–1486 (2014). 10.1126/science.1254721 - DOI - PMC - PubMed
    1. Bailey MH et al. Retrospective evaluation of whole exome and genome mutation calls in 746 cancer samples. Nat Commun 11, 4748 (2020). 10.1038/s41467-020-18151-y - DOI - PMC - PubMed
    1. Li H & Durbin R Fast and accurate long-read alignment with Burrows-Wheeler transform. Bioinformatics 26, 589–595 (2010). 10.1093/bioinformatics/btp698 - DOI - PMC - PubMed
    1. Cibulskis K et al. Sensitive detection of somatic point mutations in impure and heterogeneous cancer samples. Nat Biotechnol 31, 213–219 (2013). 10.1038/nbt.2514 - DOI - PMC - PubMed
    1. Alexandrov LB et al. Signatures of mutational processes in human cancer. Nature 500, 415–421 (2013). 10.1038/nature12477 - DOI - PMC - PubMed

Publication types