. 2023 Jul;619(7970):533-538.
doi: 10.1038/s41586-023-06185-3. Epub 2023 Jul 5.

Accurate medium-range global weather forecasting with 3D neural networks

Affiliations

Accurate medium-range global weather forecasting with 3D neural networks

Kaifeng Bi et al. Nature. 2023 Jul.

Erratum in

Abstract

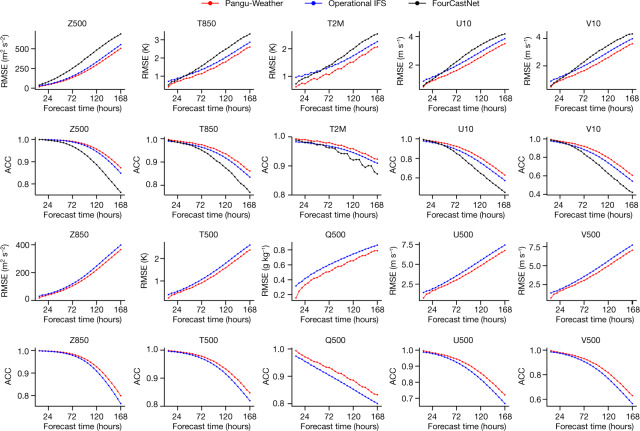
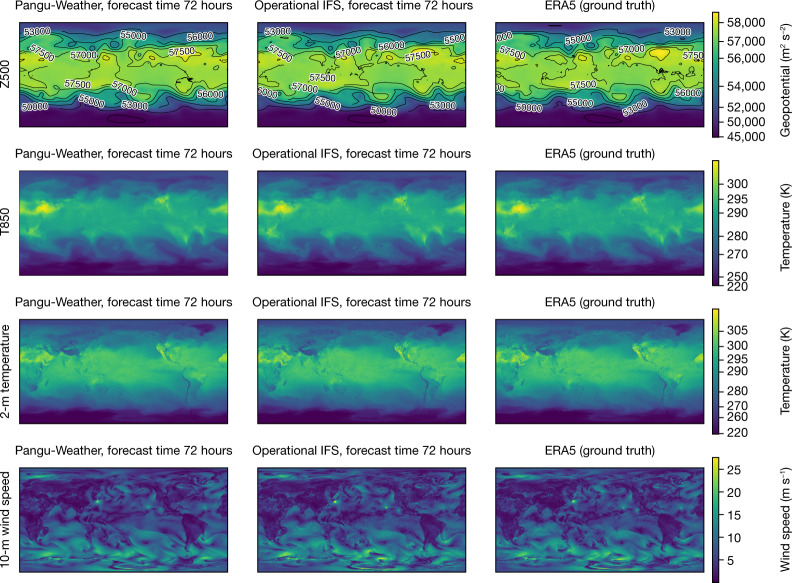
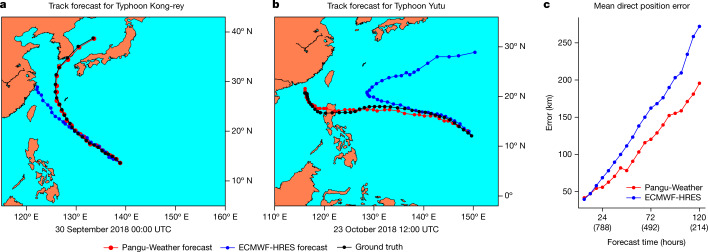
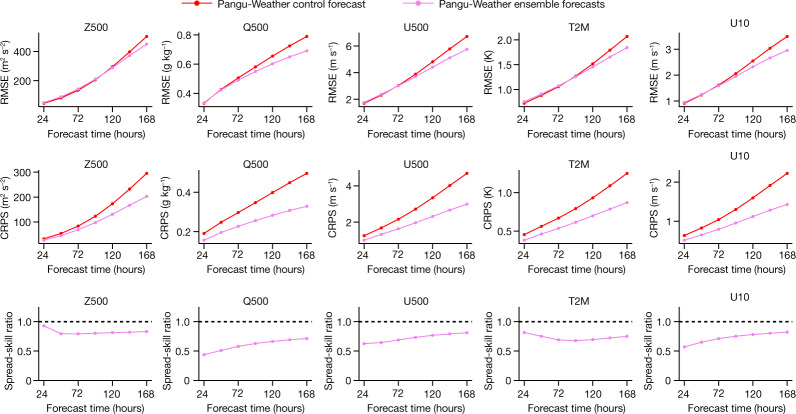
Weather forecasting is important for science and society. At present, the most accurate forecast system is the numerical weather prediction (NWP) method, which represents atmospheric states as discretized grids and numerically solves partial differential equations that describe the transition between those states1. However, this procedure is computationally expensive. Recently, artificial-intelligence-based methods2 have shown potential in accelerating weather forecasting by orders of magnitude, but the forecast accuracy is still significantly lower than that of NWP methods. Here we introduce an artificial-intelligence-based method for accurate, medium-range global weather forecasting. We show that three-dimensional deep networks equipped with Earth-specific priors are effective at dealing with complex patterns in weather data, and that a hierarchical temporal aggregation strategy reduces accumulation errors in medium-range forecasting. Trained on 39 years of global data, our program, Pangu-Weather, obtains stronger deterministic forecast results on reanalysis data in all tested variables when compared with the world's best NWP system, the operational integrated forecasting system of the European Centre for Medium-Range Weather Forecasts (ECMWF)3. Our method also works well with extreme weather forecasts and ensemble forecasts. When initialized with reanalysis data, the accuracy of tracking tropical cyclones is also higher than that of ECMWF-HRES.


Conflict of interest statement

K.B., L.X., H.Z., X.C., X.G. and Q.T. are employees of Huawei Cloud. A provisional patent (not granted an ID yet) was filed covering the generative algorithm described in this paper, listing the authors K.B., L.X. and Q.T. as inventors.

Figures

Fig. 1
Fig. 1. Network training and inference strategies.
a, 3DEST architecture. Based on the standard encoder–decoder design of vision transformers, we adjusted the shifted-window mechanism and applied an Earth-specific positional bias. b, Hierarchical temporal aggregation. Once given a lead time, we used a greedy algorithm to perform forecasting with as few steps as possible. We use FM1, FM3, FM6 and FM24 to indicate the forecast models with lead times being 1 h, 3 h, 6 h or 24 h, respectively. A0 is the input weather state and Aˆt denotes the predicted weather state at time t (in hours).
Fig. 2
Fig. 2. Pangu-Weather produces higher accuracy than the operational IFS and FourCastNet in deterministic forecasts on the ERA5 data.
Ten variables were compared in terms of latitude-weighted RMSE (lower is better) and ACC (higher is better), where the first five variables were reported in FourCastNet and the last five were not. Here, Z500, T500, Q500, U500 and V500 indicate the geopotential, temperature, specific humidity, and the u-component and v-component of wind speed at 500 hPa, respectively. Z850 and T850 indicate the geopotential and temperature at 850 hPa, respectively. T2M indicates the 2-m temperature, and U10 and V10 indicate the u-component and v-component of 10-m wind speed, respectively. Source data
Fig. 3
Fig. 3. Visualization of forecast results.
The 3-day forecast of two upper-air variables (Z500 and T850) and two surface variables (2-m temperature and 10-m wind speed). For each case, Pangu-Weather (left), the operational IFS (middle) and the ERA5 ground truth (right) are shown. For all cases, the input time is 00:00 UTC on 1 September 2018.
Fig. 4
Fig. 4. Pangu-Weather is more accurate at early-stage cyclone tracking than ECMWF-HRES.
a,b, Tracking results for two strong tropical cyclones in 2018, that is, Typhoon Kong-rey (2018–25) and Yutu (2018–26). The initial time point is shown below each panel. The time gap between neighbouring dots is 6 h. Pangu-Weather forecasts the correct path of Yutu (that is, it goes to the Philippines) at 12:00 UTC on 23 October 2018, whereas ECMWF-HRES obtains the same conclusion 2 days later, before which it predicts that Yutu will make a big turn to the northeast. c, A comparison between Pangu-Weather and ECMWF-HRES in terms of mean direct position error over 88 cyclones in 2018. Each number in brackets in the x-axis indicates the number of samples used to calculate the average. For example, ‘(788)’ means that there are in total 788 initial points from which the typhoon lasts for at least 24 hours, and the 788 direct position errors of Pangu-Weather and ECMWF-HRES were averaged into the final results. Panels a and b were plotted using the Matplotlib Basemap toolkit. Source data
Fig. 5
Fig. 5. Ensemble forecast results of Pangu-Weather.
The RMSE of the ensemble mean forecast (lower is better) for three upper-air variables (Z500, Q500 and U500) and two surface variables (T2M and U10). We also followed a recent work to plot two metrics, the CRPS (lower is better) and the spread-skill ratio (an ideal ensemble model produces spread-skill ratios of 1.0, shown as the dashed lines), which further demonstrate the properties of our ensemble forecast results. Here, Z500, Q500 and U500 indicate the geopotential, temperature and the u-component of wind speed at 500 hPa, respectively. T2M indicates the 2-m temperature and U10 indicates the u-component of 10-m wind speed. Source data
Extended Data Fig. 1
Extended Data Fig. 1. Deterministic forecast results in the Northern Hemisphere.
We only compared Pangu-Weather to operational IFS because FourCastNet did not report the breakdown results. We followed ECMWF to define the “Northern Hemisphere” to be the region between latitude of 20° (exclusive) and 90° (inclusive). Here, Z500/T500/Q500/U500/V500 indicates the geopotential, temperature, specific humidity, and u-component and v-component of wind speed at 500 hPa. Z850/T850 indicates the geopotential and temperature at 850 hPa. T2M indicates the 2 m temperature, and U10/V10 indicates the u-component and v-component of 10 m wind speed. Source data
Extended Data Fig. 2
Extended Data Fig. 2. Deterministic forecast results in the Southern Hemisphere.
We only compared Pangu-Weather to operational IFS because FourCastNet did not report the breakdown results. We followed ECMWF to define the “Northern Hemisphere” to be the region between latitude of −20° (exclusive) and −90° (inclusive). Here, Z500/T500/Q500/U500/V500 indicates the geopotential, temperature, specific humidity, and u-component and v-component of wind speed at 500 hPa. Z850/T850 indicates the geopotential and temperature at 850 hPa. T2M indicates the 2 m temperature, and U10/V10 indicates the u-component and v-component of 10 m wind speed. Source data
Extended Data Fig. 3
Extended Data Fig. 3. Deterministic forecast results in the tropics.
We only compared Pangu-Weather to operational IFS because FourCastNet did not report the breakdown results. We followed ECMWF to define the “tropics” to be the region between latitude of +20° (inclusive) and −20° (inclusive). Here, Z500/T500/Q500/U500/V500 indicates the geopotential, temperature, specific humidity, and u-component and v-component of wind speed at 500 hPa. Z850/T850 indicates the geopotential and temperature at 850 hPa. T2M indicates the 2 m temperature, and U10/V10 indicates the u-component and v-component of 10 m wind speed. Source data
Extended Data Fig. 4
Extended Data Fig. 4. Deterministic forecast results of Pangu-Weather in 2018, 2020 and 2021.
The RMSE and ACC values and trends are close among the three years, indicating Pangu-Weather’s stable forecasting skill over different years. Here, Z500/T500/Q500/U500/V500 indicates the geopotential, temperature, specific humidity, and u-component and v-component of wind speed at 500 hPa. Z850/T850 indicates the geopotential and temperature at 850 hPa. T2M indicates the 2 m temperature, and U10/V10 indicates the u-component and v-component of 10m wind speed. Source data
Extended Data Fig. 5
Extended Data Fig. 5. Breakdowns of the mean direct position errors of tracking tropical cyclones.
a) The breakdown into six oceans. b) The breakdown into three intensity intervals. The overall statistics is displayed in Fig. 4c. Source data
Extended Data Fig. 6
Extended Data Fig. 6. The motivation of using an Earth-specific positional bias.
a) The horizontal map corresponds to an uneven spatial distribution on Earth’s sphere. b) The geopotential height is closely related to the latitude. c) The mean wind speed and temperature are closely related to the height (formulated as pressure levels). Sub-figures b) and c) were plotted using statistics on the ERA5 data.
Extended Data Fig. 7
Extended Data Fig. 7. Properties of deterministic forecast results.
a) Single-model test errors. It shows the test errors (in RMSE) with respect to forecast time using single models (i.e., lead times being 1 h, 3 h, 6 h, and 24 h, respectively). Mind the accumulation of forecast errors as forecast time increases. b) Visualization of the trend of quantiles with respect to lead time. It shows the trend of all the variables displayed in Fig. 2 and the comparisons to operational IFS and ERA5. Pangu-Weather often reports lower quantile values because AI-based methods tend to produce smooth forecasts. Here, Z500/T500/Q500/U500/V500 indicates the geopotential, temperature, specific humidity, and u-component and v-component of wind speed at 500 hPa. Z850/T850 indicates the geopotential and temperature at 850 hPa. T2M indicates the 2 m temperature, and U10/V10 indicates the u-component and v-component of 10 m wind speed. Source data
Extended Data Fig. 8
Extended Data Fig. 8. Visualization of tracking tropical cyclones.
a) The tracking results of cyclone eyes for Hurricane Michael (2018–13) and Typhoon Ma-on (2022–09) by Pangu-Weather and ECMWF-HRES, with a comparison to the ground-truth (by IBTrACS,). b) An illustration of the tracking process, where we used Pangu-Weather as an example. The algorithm locates the cyclone eye by checking four variables (from forecast results), namely, mean sea level pressure, 10 m wind speed, the thickness between 850 hPa and 200 hPa, and the vorticity of 850 hPa). The displayed figures correspond to the forecast results of these variables at a lead time of 72 h, and the tracked cyclone eyes are indicated using the tail of arrows. c) The procedural tracking results of Typhoon Kong-rey (2018–25). The results of Pangu-Weather were compared to that of ECMWF-HRES and the ground-truth (by IBTrACS,). We show six time points with the first one being 12:00 UTC, September 29th, 2018, and the time gap between neighboring sub-figures being 12 h. The historical (observed) path of cyclone eyes is shown in dashed. Mind the significant difference between the tracking results of Pangu-Weather and ECMWF-HRES (Pangu-Weather is more accurate) at the middle four sub-figures. The sub-figures with maps were plotted using the Matplotlib Basemap toolkit. Source data

References

    1. Bauer P, Thorpe A, Brunet G. The quiet revolution of numerical weather prediction. Nature. 2015;525:47–55. doi: 10.1038/nature14956. - DOI - PubMed
    1. Pathak, J. et al. FourCastNet: a global data-driven high-resolution weather model using adaptive Fourier neural operators. Preprint at https://arxiv.org/abs/2202.11214 (2022).
    1. Bougeault P, et al. The THORPEX interactive grand global ensemble. Bull. Am. Meteorol. Soc. 2010;91:1059–1072. doi: 10.1175/2010BAMS2853.1. - DOI
    1. Skamarock, W. C. et al. A Description of the Advanced Research WRF Version 2 (National Center For Atmospheric Research Mesoscale and Microscale Meteorology Division, 2005).
    1. Molteni F, Buizza R, Palmer TN, Petroliagis T. The ECMWF ensemble prediction system: methodology and validation. Q. J. R. Meteorol. Soc. 1996;122:73–119. doi: 10.1002/qj.49712252905. - DOI