. 2023 Jul 5;11(1):108.
doi: 10.1186/s40478-023-01601-1.

Mechanisms of metabolic stress induced cell death of human oligodendrocytes: relevance for progressive multiple sclerosis

Affiliations

Mechanisms of metabolic stress induced cell death of human oligodendrocytes: relevance for progressive multiple sclerosis

Milton Guilherme Forestieri Fernandes et al. Acta Neuropathol Commun. .

Abstract

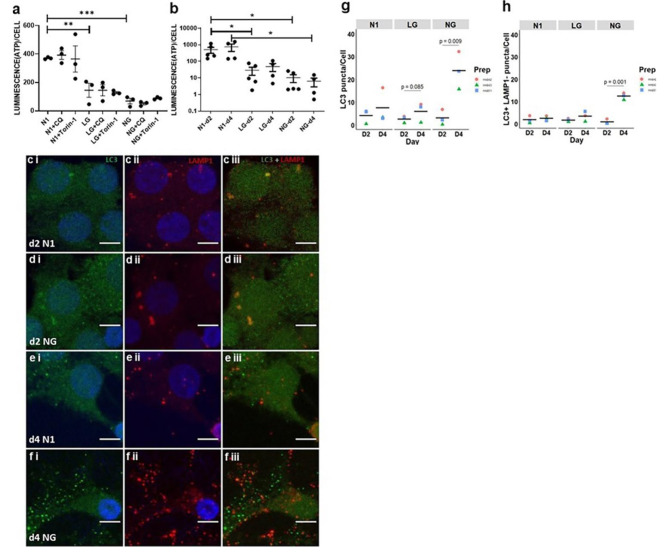
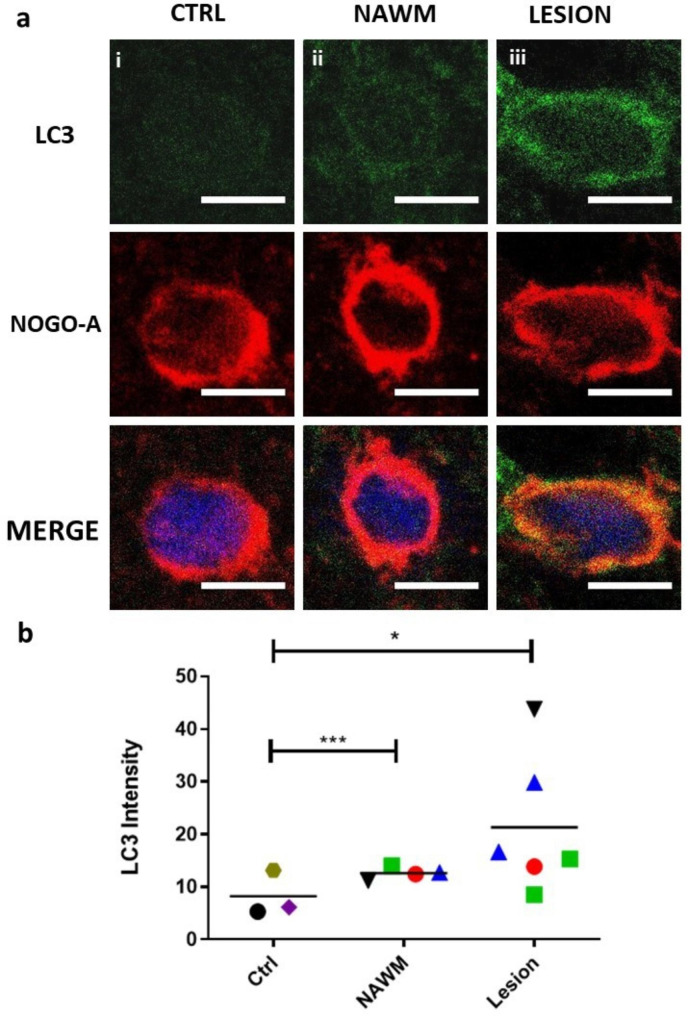
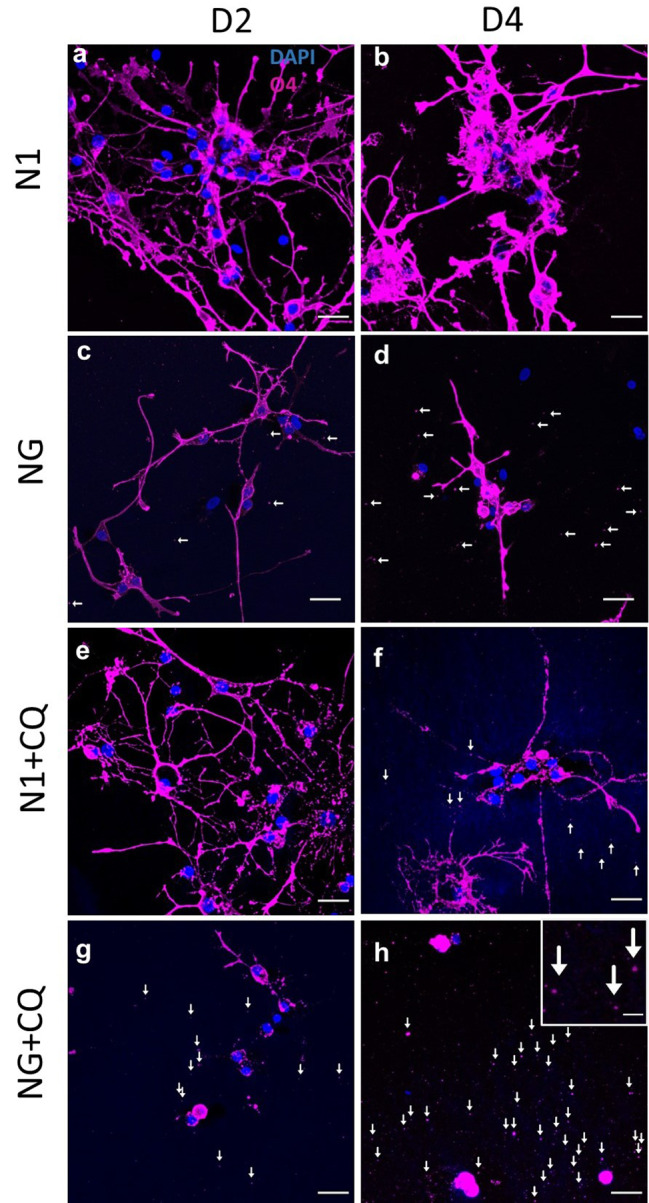
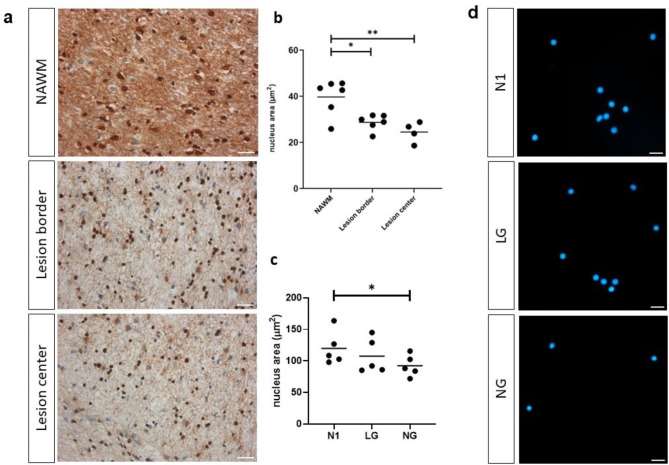
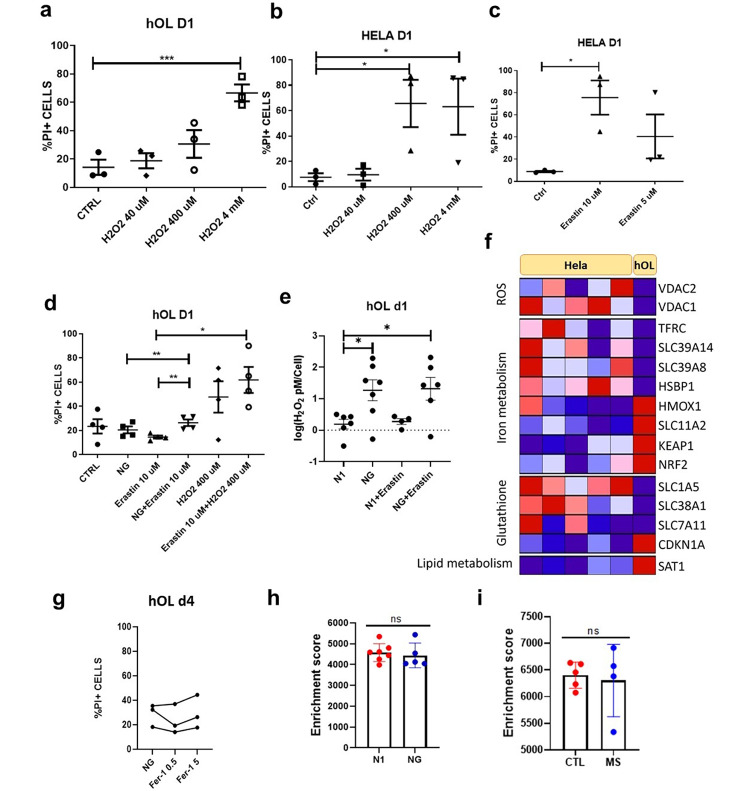
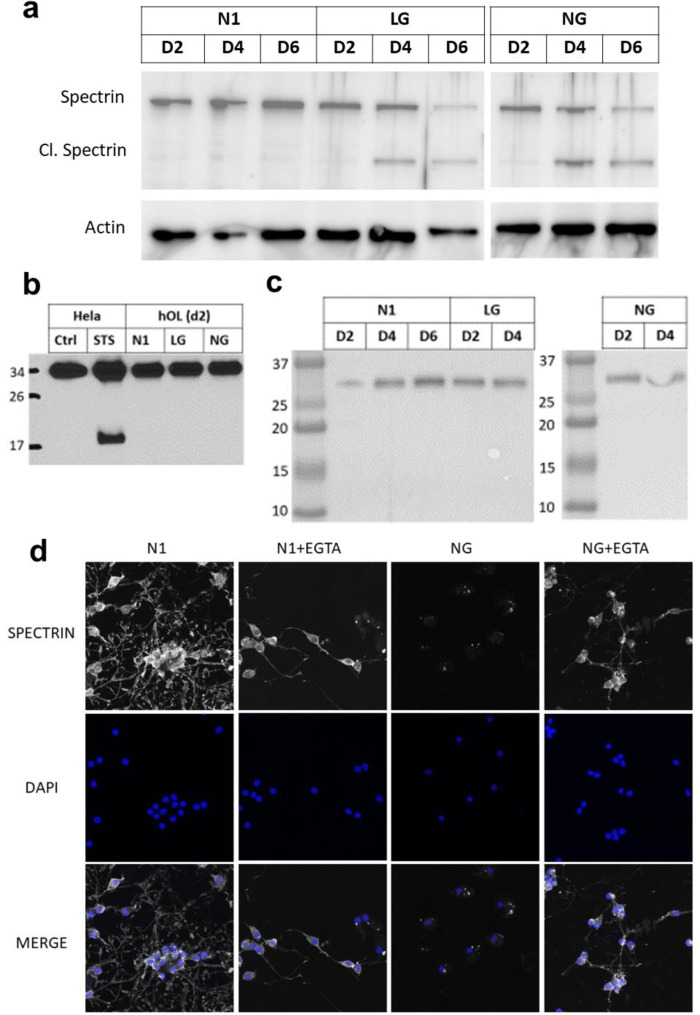
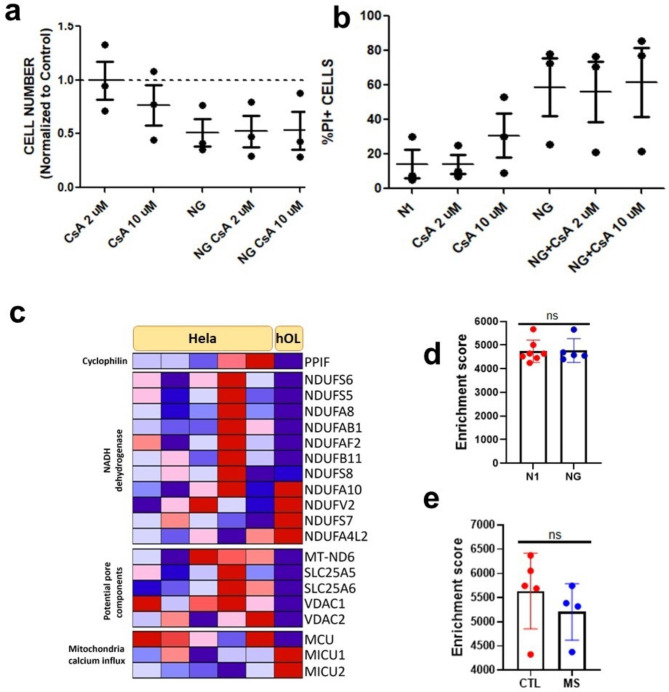
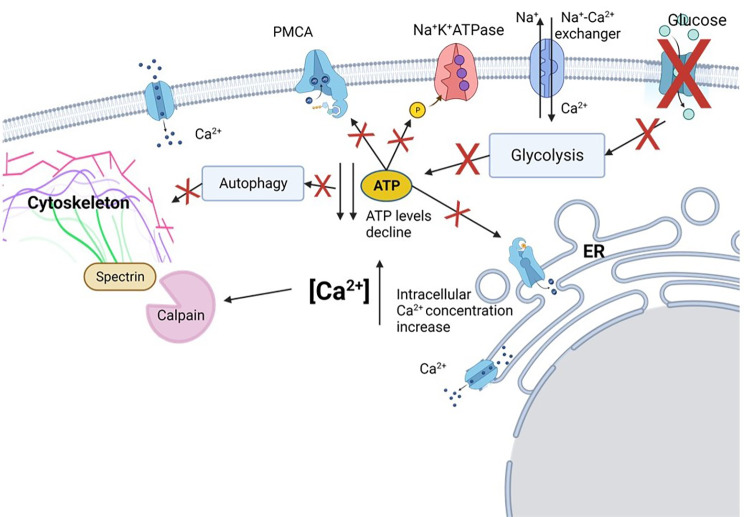
Oligodendrocyte (OL) injury and loss are central features of evolving lesions in multiple sclerosis. Potential causative mechanisms of OL loss include metabolic stress within the lesion microenvironment. Here we use the injury response of primary human OLs (hOLs) to metabolic stress (reduced glucose/nutrients) in vitro to help define the basis for the in situ features of OLs in cases of MS. Under metabolic stress in vitro, we detected reduction in ATP levels per cell that precede changes in survival. Autophagy was initially activated, although ATP levels were not altered by inhibitors (chloroquine) or activators (Torin-1). Prolonged stress resulted in autophagy failure, documented by non-fusion of autophagosomes and lysosomes. Consistent with our in vitro results, we detected higher expression of LC3, a marker of autophagosomes in OLs, in MS lesions compared to controls. Both in vitro and in situ, we observe a reduction in nuclear size of remaining OLs. Prolonged stress resulted in increased ROS and cleavage of spectrin, a target of Ca2+-dependent proteases. Cell death was however not prevented by inhibitors of ferroptosis or MPT-driven necrosis, the regulated cell death (RCD) pathways most likely to be activated by metabolic stress. hOLs have decreased expression of VDAC1, VDAC2, and of genes regulating iron accumulation and cyclophilin. RNA sequencing analyses did not identify activation of these RCD pathways in vitro or in MS cases. We conclude that this distinct response of hOLs, including resistance to RCD, reflects the combined impact of autophagy failure, increased ROS, and calcium influx, resulting in metabolic collapse and degeneration of cellular structural integrity. Defining the basis of OL injury and death provides guidance for development of neuro-protective strategies.

Keywords: Cell survival; Demyelination; Myelin; Neurodegeneration; Neurodegenerative disease.


Conflict of interest statement

The authors declare that they have no competing interests.

Figures

Fig. 1
Fig. 1
Metabolic stress reduces ATP resulting in failure of autophagic flux in hOLs. a ATP levels in hOLs cultured in optimal (N1), low glucose (LG), and no glucose (NG) conditions combined with chloroquine (CQ) or Torin-1. 6 h of treatment resulted in a significant decline in ATP under LG and NG conditions without an additive effect of CQ or Torin-1. Statistical significance was verified by ANOVA/Dunnett’s test: **(< 0.01), ***(< 0.001) b ATP levels in hOL cultured in N1, LG, and NG conditions. After 2 and 4 days of treatment, ATP levels continue to decline in LG and NG conditions. Mean ± SEM for each condition shown in the figure. Statistical significance was verified by ANOVA/Dunnett’s test: *(< 0.05). c-f Confocal images of autophagosomes (LC3 - green) and lysosomes (LAMP1 – red) in hOLs under control (N1) or no glucose (NG) conditions. After 2 days of treatment under N1 c and NG d conditions, few autophagosomes (LC3 puncta) were detected (c i, d i). The majority of these autophagosomes were fused with lysosomes (LAMP1 puncta) (c iii, d iii). e After 4 days of treatment under N1 conditions, few autophagosomes (LC3 puncta) were detected (e i). The majority of these autophagosomes were fused with lysosomes (LAMP1 puncta) (e iii). f After 4 days of treatment under NG conditions, many autophagosomes (LC3 puncta) were detected (f i); most were not fused with lysosomes (LAMP1 puncta) (f iii). g Quantification of autophagosomes (LC3 puncta) per cell in N1, LG and LG conditions after 2 and 4 days of treatment. After 2 days, in all conditions, the number of autophagosomes per cell was low. After 4 days, this number was slightly increased in LG conditions and strongly increased in NG conditions. Statistical significance was verified by Student’s t-test. h Quantification of autophagosomes not fused with lysosomes (LC3 + ve LAMP1 -ve puncta) per cell in N1, LG and NG conditions after 2 and 4 days of treatment. After 2 days, in all conditions, the number of autophagosomes not fused with lysosomes per cell was low. After 4 days, this number increased in NG conditions. Each dot-color corresponds to an independent biological sample. Bar indicates the mean. hOLs were marked with DAPI (blue), indicating the cell nucleus. Statistical significance was verified by Student’s t-test.
Fig. 2
Fig. 2
Increased expression of the autophagy marker LC3 in MS lesions and NAWM compared to controls. a Sample images showing relative expression of LC3 in a non-MS CTRL case, in NAWM from an MS case, and in a chronic active lesion of an MS case. Scale bars correspond to 5 μm. b Quantification of LC3 expression as measured by average immunofluorescence intensity of LC3 in OLs in healthy controls, NAWM, and chronic active MS lesions. Individual regions of interest are indicated by color and shape corresponding to 3 non-MS controls, 4 NAWM regions, and 6 lesions from 4 individuals with MS. Statistical significance was assessed using Student’s t-test: * (< 0.05), *** (< 0.001)
Fig. 3
Fig. 3
No glucose conditions and treatment with chloroquine cause cell process loss and shedding of membrane fragments. a, b hOLs project long processes in N1 conditions at 2 and 4 days in vitro (DIV). c, d With NG, processes show signs of contraction. O4 positive fragments are visible in the media (indicated by arrows). e In N1 conditions combined with chloroquine, the morphology of hOLs was similar to N1 conditions without chloroquine after 2 DIV. f After 4 days of treatment in N1 combined with chloroquine, some process retraction and some O4 + fragments can be observed outside the cell (fragments indicated by arrows). g, h Combined treatment of NG and chloroquine after 2 and 4 DIV resulted in greater retraction of processes and the presence of many fragments outside the cell. Cell size was decreased. The inset picture in h illustrates a magnified view of the O4 positive fragments. Scale bars correspond to 20 μm in the large figures and 2.5 μm in the inset in panel h
Fig. 4
Fig. 4
Shrinkage of hOL nuclear size in MS lesions and under metabolic stress in vitro. a Sample images of an MS case showing nucleus size in NAWM, lesion edge, and lesion center. Scale bars correspond to 10 μm. b Quantification of nuclear size (surface area) in NAWM, lesion edge, and lesion center, showing nuclear size reduced in the lesion center and edge compared to NAWM. Statistical significance was assessed using ANOVA/Dunnett’s test: *(< 0.05), **(< 0.01). c Quantification of nuclear size in optimal (N1), low glucose (LG) and no glucose (NG) conditions at 4 days, showing nuclear size reduced under metabolic stress. Statistical significance was assessed using ANOVA/Dunnett’s test: *(< 0.05). d Sample images illustrating nucleus size (DAPI staining) in vitro under N1, LG and NG conditions. Scale bars correspond to 20 μm
Fig. 5
Fig. 5
ROS mediates limited damage in hOL following metabolic stress. a-b hOLs and HeLa cells were treated with hydrogen peroxide for 1 day at different concentrations and rate of cell death was measured by PI assay. a hOL cell death was increased only by 4 mM H2O2. b HeLa cell death was substantially increased by 400 μm of H2O2. Statistical significance was assessed using an ANOVA/Tukey test: *(< 0.05), ***(< 0.001). c HeLa cells were treated with Erastin at different concentrations for 1 day. Cell death was significantly increased by treatment with 10 µM of erastin. Statistical significance was assessed using a Student’s t-test: *(< 0.05). d hOLs were treated with Erastin, NG, H2O2 or combination of these treatments for 1 day. Cell death was only significantly increased with the combined treatment of Erastin with NG and not with NG or Erastin alone. Statistical significance was assessed using a Student’s t-test: *(< 0.05), **(< 0.01). e H2O2 levels measured in hOLs treated with Erastin in optimal and NG conditions. H2O2 levels were increased under NG conditions alone. No additional effect of Erastin was detected. Statistical significance was assessed using an ANOVA/Dunnett’s test: *(< 0.05). f Genes presenting significant difference in their transcriptional expression in hOLs compared to HeLa cells were categorised according to the pathway involved in ferroptosis. Genes upregulated are shown in red and downregulated in blue. HeLa cell data were obtained from publicly available databases [1, 10, 17]. hOLs data was obtained from a bulk RNA sequencing database that we have previously published [31]. g Rate of hOL cell death under NG conditions following treatment with Ferrostatin-1 for 4 days, measured by PI assay. No significant differences were observed between treatment conditions. Each dot/line in the graphs corresponds to an independent biological sample. Statistical significance was assessed using an ANOVA/Dunnett’s test. h Comparison of the enrichment score of genes related to ferroptosis in N1 and NG conditions in vitro. Mean ± SEM for each condition shown in the figure. Statistical significance was assessed using a Student’s t-test: *(< 0.05). i Enrichment score of genes related to ferroptosis in MS cases compared to “control” individuals. Mean ± SEM for each condition shown in the figure. Statistical significance was assessed using a Student’s t-test: *(< 0.05)
Fig. 6
Fig. 6
hOL cytoskeleton is degraded by a mechanism dependent on calcium activation. a hOLs were cultured in N1, LG and NG conditions for 2, 4 and 6 days. Spectrin cleavage was assessed by Western Blot. b Hela cells were treated with the apoptosis activator staurosporine and hOL were cultured in N1, LG and NG conditions for 2 days. Procaspase-3 is detected at 32 kDa, while cleaved caspase-3 at 17 kDa. c In the same sample used in a), cleavage of caspase-3 was not detected after 4 days in low and no glucose conditions. d hOLs were treated under N1 and NG conditions in combination with EGTA for 4 days and immunocytochemistry for Spectrin and O4 (hOL marker) was performed, followed by confocal imaging.
Fig. 7
Fig. 7
Metabolic stress triggers spectrin cleavage without activation of MPT-driven necrosis. a-b hOLs treated with CsA at 2 µM and 10 µM in combination with N1 and NG conditions did not cause a reduction in cell number or increase in PI-positive cells after 4 days of treatment. Each dot in the graphs corresponds to an independent biological sample. Mean ± SEM for each condition is shown in the figure. Statistical significance was assessed using a ANOVA/Dunnett’s test. c Genes presenting significant differences in their transcriptional expression in hOLs compared to HeLa cells were categorised according to pathways involved in MPT-driven necrosis. Genes upregulated are shown in red and downregulated in blue. HeLa cell data was obtained from publicly available databases [1, 10, 17]. hOLs data was obtained from a bulk RNA sequencing database that we have previously published [31]. d Comparison of the enrichment score of genes related to MPT-driven necrosis in N1 and NG conditions in vitro. Mean ± SEM for each condition shown in the figure. Statistical significance was assessed using a Student’s t-test: *(< 0.05). e Enrichment score of genes related to MPT-driven necrosis in MS cases compared to “control” individuals. Mean ± SEM for each condition shown in the figure. Statistical significance was assessed using a Student’s t-test: *(< 0.05)
Fig. 8
Fig. 8
Mechanisms of human OL lethal injury. In the absence of glucose uptake, glycolysis, the main source of ATP in hOL, is reduced. As ATP is necessary for the transport and fusion of autophagosomes and lysosomes, autophagy is impaired. Autophagy blockage results in process disruption in OLs, indicating that this mechanism is important for the structural integrity of the cell. Reduction in ATP levels also causes a decrease in the activity of ATP-dependent Ca2+ pumps, like plasma membrane calcium ATPase (PMCA), and the Na+K+ATPase, leading to an increase in cytosolic Ca2+ and Na+. The raise in intracellular Na+ increases the activity of Na+-Ca2+ exchangers, what causes an additional influx of Ca2+. High levels of Ca2+ activate Ca2+-dependent proteases as calpain, which cleave spectrin, an essential component for the integrity of the cytoskeleton. These mechanisms initially contribute to loss of hOL processes (sub-lethal injury) and subsequently to cell death. Figure created using Biorender.

References

    1. Batie M, Frost J, Shakir D, Rocha S. Regulation of chromatin accessibility by hypoxia and HIF. Biochem J. 2022;479:767–786. doi: 10.1042/BCJ20220008. - DOI - PMC - PubMed
    1. Bauer TM, Murphy E. Role of mitochondrial calcium and the permeability transition pore in regulating cell death. Circ Res. 2020;126:280–293. doi: 10.1161/circresaha.119.316306. - DOI - PMC - PubMed
    1. Bitsch A, Kuhlmann T, Stadelmann C, Lassmann H, Lucchinetti C, Brück W. A longitudinal MRI study of histopathologically defined hypointense multiple sclerosis lesions. Ann Neurol. 2001;49:793–796. doi: 10.1002/ana.1053. - DOI - PubMed
    1. Bonetti B, Raine CS. Multiple sclerosis: oligodendrocytes display cell death-related molecules in situ but do not undergo apoptosis. Ann Neurol. 1997;42:74–84. doi: 10.1002/ana.410420113. - DOI - PubMed
    1. Burgoyne LA. The mechanisms of pyknosis: hypercondensation and death. Exp Cell Res. 1999;248:214–222. doi: 10.1006/excr.1999.4406. - DOI - PubMed

Publication types

MeSH terms

Substances