. 2023 Jul 5;20(1):32.
doi: 10.1186/s12979-023-00351-x.

The use of alpha 1 thymosin as an immunomodulator of the response against SARS-Cov2

Affiliations

The use of alpha 1 thymosin as an immunomodulator of the response against SARS-Cov2

M S Espinar-Buitrago et al. Immun Ageing. .

Abstract

Background: Since the beginning of SARS-CoV2 pandemic, the mortality rate among elderly patients (60-90 years) has been around 50%, so age has been a determining factor of a worse COVID-19 prognosis. Associated with age, the thymic function involution and depletion plays an important role, that could be related to a dysregulated and ineffective innate and adaptive immune response against SARS-CoV2. Our study aims to further in vitro effect of human Thymosin-alpha-1 (α1Thy) treatment on the immune system in population groups with different thymic function levels in the scenario of SARS-CoV2 infection.

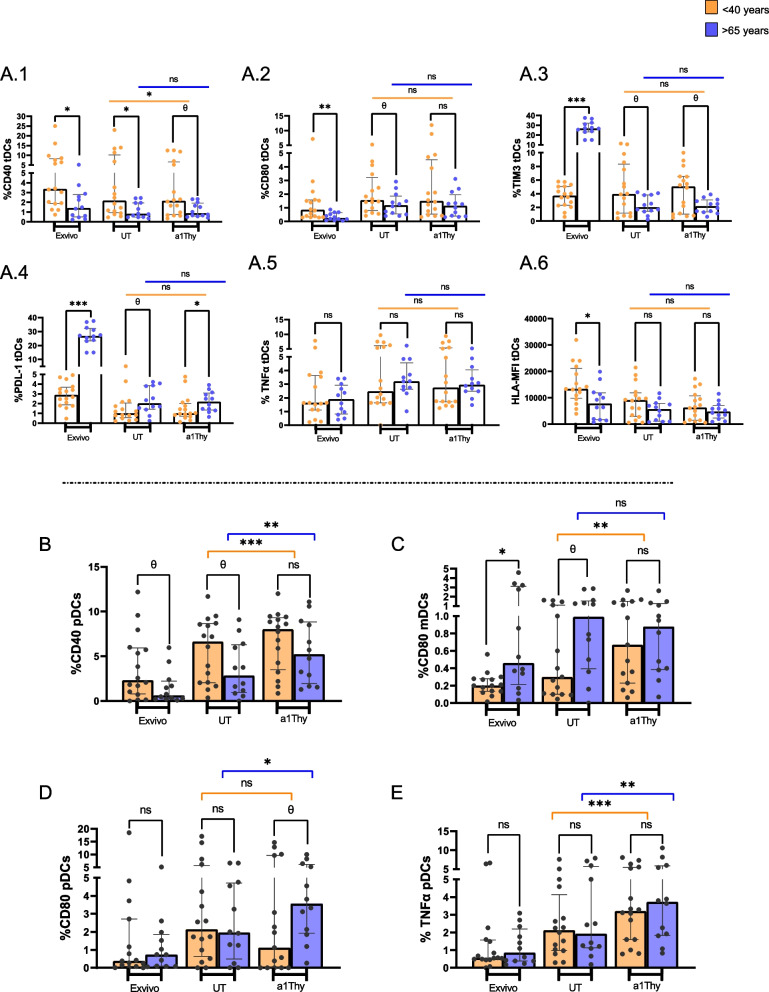
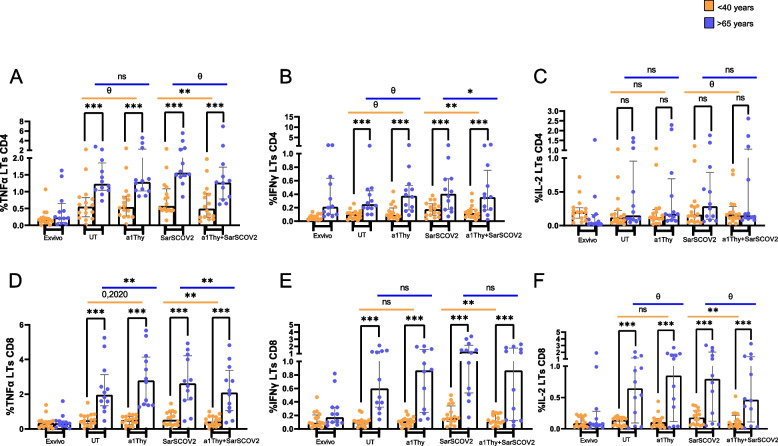
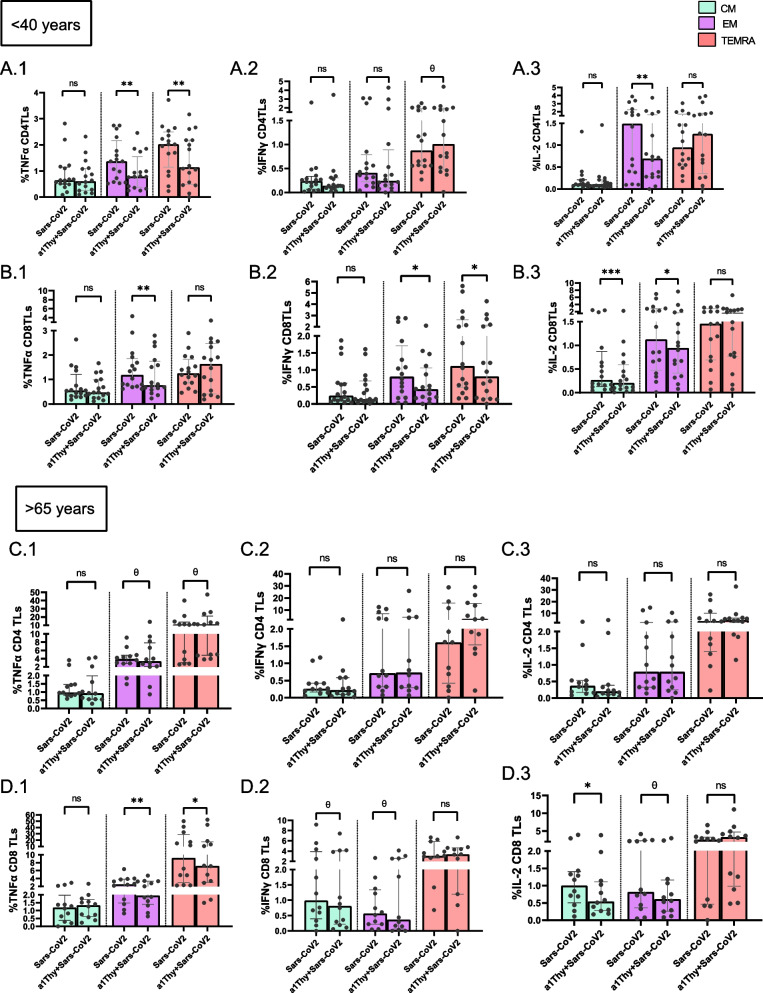
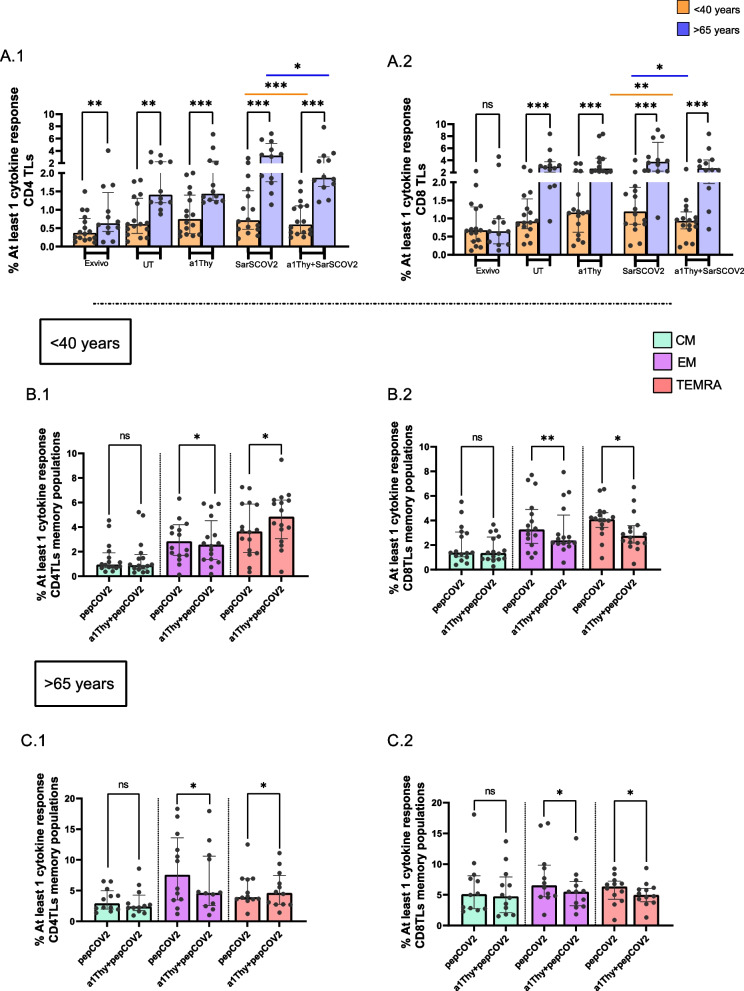
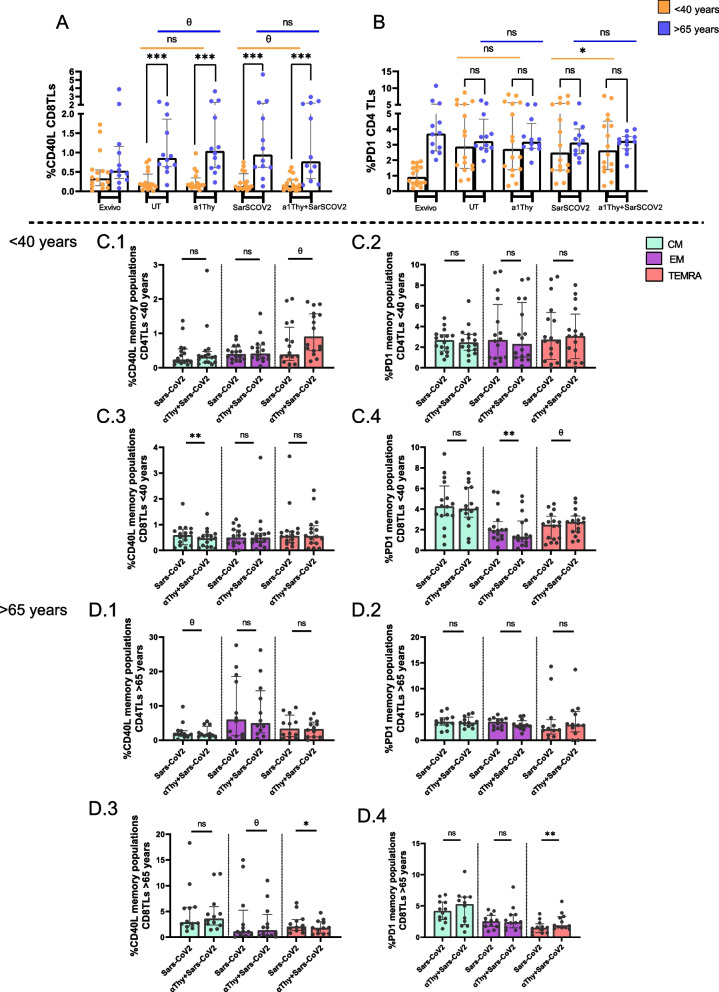
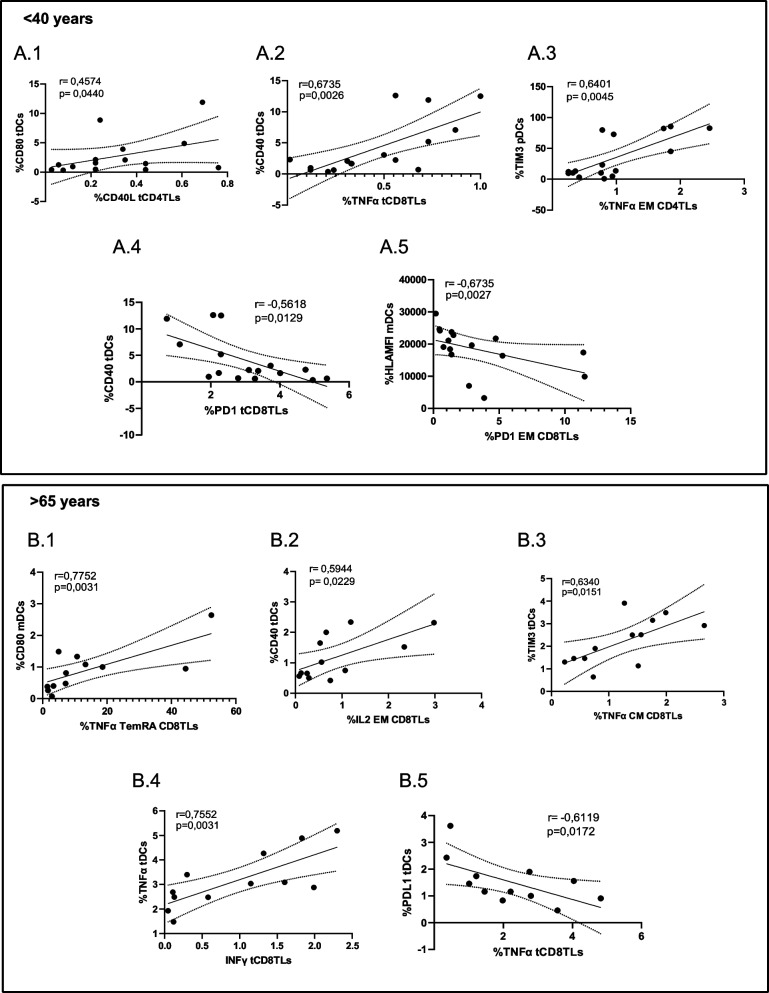
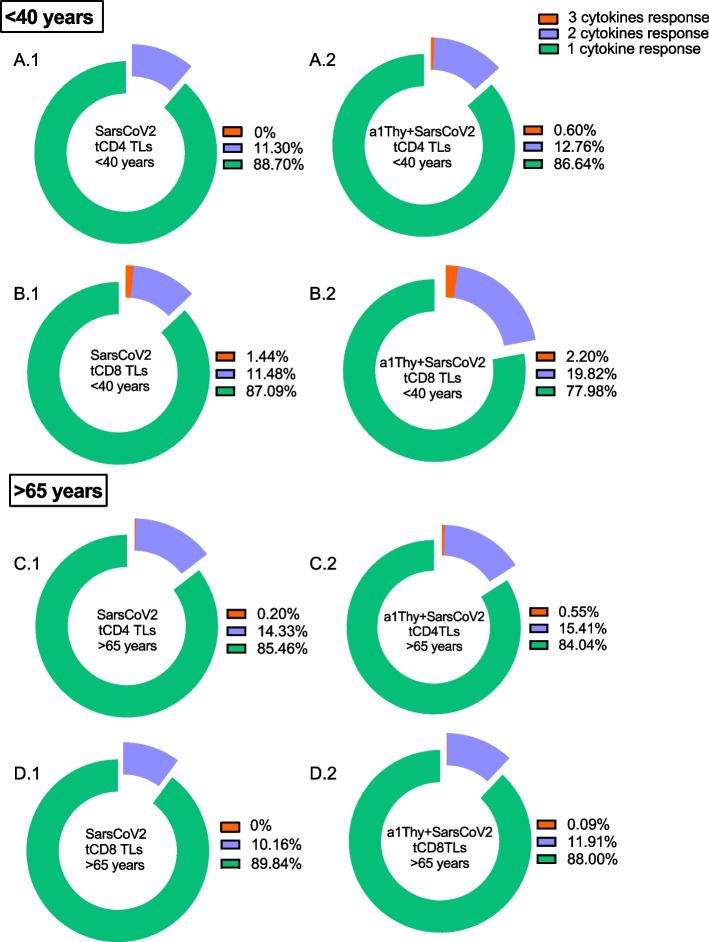
Results: Activation markers such as CD40, CD80 and TIM-3 were upregulated in α1Thy presence, especially in plasmacytoid dendritic cells (pDCs) and, with increased TNFα production was observed compared to untreated condition. Co-cultures of CD4 + and CD8 + T cells with DCs treated with α1Thy in response to SARS-CoV2 peptides showed a decrease in the cytokine production compared to the condition without α1Thy pre-treated. A decrease in CD40L activation co-receptor expression in CD8 + LTs was also observed, as well as an increase in PD1 in CD4 + TLs expression in both age groups. In fact, there are no age-related differences in the immunomodulatory effect of the hormone, and it seems that effector memory and terminally differentiated memory T lymphocyte subsets were the most actively influenced by the immunomodulatory α1Thy effect. Finally, the polyfunctionality measured in SARS-CoV2 Specific-T cells response was maintained in α1Thy presence in total and memory subpopulations CD4 + and CD8 + T-cells, despite decreased proinflammatory cytokines production.

Conclusion: The hormone α1Thy could reduce, through the modulation of DCs, the amount of proinflammatory cytokines produced by T cells. Moreover, α1Thy improve lymphocyte functionality and could become a beneficial therapeutic alternative as an adjuvant in SARS-CoV2 treatment either in the acute phase after infection or reinfection. In addition, the effect on the T immune response means that α1Thy can be incorporated into the vaccination regimen, especially in the most immunologically vulnerable individuals such as the elderly.

Subjects: Thymosin alpha 1, Dendritic cells, SARS-CoV2-specific T cells response, Immunomodulation.


Conflict of interest statement

The authors declare no competing interests.

Figures

Fig. 1
Fig. 1
Immunophenotyping of DCs. DCs phenotype and activation, maturation and exhaustion markers and intracellular production of TNFα on DCs. Bar and scatter dots graphs represent the expression of each biomarker in total DCs: CD40, CD80, TIM-3, PDL-1 (A.1-A.4); TNFα intracellular production (A.5); HLA-MFI (A.6). The bar graphs represent marker expression: CD40 on plasmacytoid dendritic cells (pDCs) (B); CD80 on myeloid dendritic cells (mDCs) (C); CD80 on pDCs (D) and intracellular production of TNFα on pDCs (E). The medians with the interquartile ranges are shown. Ex-vivo: Ex-vivo condition; UT: Untreated condition; α1Thy: α1Thy treated condition. Each dot represents an individual. Orange dots represent < 40 years (n = 18) and > 65 years (n = 16) are highlighted with blue dots. Wilcoxon test was used comparing condition in the same group and U-Mann Whitney test was used comparing condition between different group (ns: not statistically significative, θ: p > 0.05 and < 0.1 *p < 0.05; **p < 0.01; ***p < 0.001)
Fig. 2
Fig. 2
Immunophenotyping and cytokine production on total CD4 + and CD8 T cells. Intracellular production of TNFα, IFNγ, and IL-2 in T cells was evaluated from co-culture of CD4 + or CD8 + TLs in response to SARS-CoV2 peptides with autologous DCs previously treated with α1Thy. Bar and Scatter plots graphs represent percentage of cytokine production: in total CD4 TLs TNFα, IFNγ, and IL-2 (A-C); in total CD8 TLs: TNFα, IFNγ, and IL-2 (D-F). The medians with the interquartile ranges are shown. Ex-vivo: Ex-vivo condition; UT: Untreated condition; α1Thy: α1Thy treated condition; SARS-CoV2: SARS-CoV2 peptides stimulation condition; α1Thy + SARS-CoV2: α1Thy treated and SARS-CoV2 peptides stimulation condition. Each dot represents an individual. Orange dots represent < 40 years (n = 18) and > 65 years (n = 16) are highlighted with blue dots. Wilcoxon test was used comparing condition in the same group and U-Mann Whitney test was used comparing condition between different group (ns: not statistically significative, θ: p > 0.05 and < 0.1 *p < 0.05; **p < 0.01; ***p < 0.001)
Fig. 3
Fig. 3
Immunophenotyping and cytokine production on CD4 + and CD8 memory T cells. Intracellular production of TNFα, IFNγ, and IL-2 in T cells was evaluated from co-culture of CD4 + or CD8 + TLs in response to SARS-CoV2 peptides with autologous DCs previously treated with α1Thy. Bar and Scatter plots graphs represent percentage of cytokine production: in memory populations of CD4 + TLs in < 40 years’ group: TNFα, IFNγ, and IL-2 (A.1-A.3); in memory populations CD8 + TLs in < 40 years’ group: TNFα, IFNγ, and IL-2 (B.1-B.3); in memory populations of CD4 + TLs in > 65 years’ group: TNFα, IFNγ, and IL-2 (C.1-C.3); in memory populations CD8 + TLs in > 65 years’ group: TNFα, IFNγ, and IL-2 (D.1-D.3). The medians with the interquartile ranges are shown. Ex-vivo: Ex-vivo condition; UT: Untreated condition; α1Thy: α1Thy treated condition; SARS-CoV2: SARS-CoV2 peptides stimulation condition; α1Thy + SARS-CoV2: α1Thy treated and SARS-CoV2 peptides stimulation condition. Each dot represents an individual. Memory populations represented in green central memory T-cells (CM), in violet effector memory T-cells (EM) and in red terminally differentiated effector memory T cells (TEMRA). Wilcoxon test was used comparing condition in the same group and U-Mann Whitney test was used comparing condition between different group (ns: not statistically significative, θ: p > 0.05 and < 0.1 *p < 0.05; **p < 0.01; ***p < 0.001)
Fig. 4
Fig. 4
At least 1 cytokine production in total and memory populations of T lymphocytes. Bar graphs represent percentage of at least 1 cytokine production in total CD4 TLs and total CD8 TLs (A.1 and A.2). Bar graphs describe the percentage of at least 1 cytokine production in memory populations includes central memory T-cells (CM), effector memory T-cells (EM) and terminally differentiated effector memory T cells (TEMRA)for CD4 and CD8 T cells in < 40-years group (B.1 and B.2) and for CD4 and CD8 T cells in > 65-years group (C.1 and C.2). The medians with the interquartile ranges are shown. Ex-vivo: Ex-vivo condition; UT: Untreated condition; α1Thy: α1Thy treated condition; SARS-CoV2: SARS-CoV2 peptides stimulation condition; α1Thy + SARS-CoV2: α1Thy treated and SARS-CoV2 peptides stimulation condition. Each dot represents an individual. Orange dots represent < 40 years (n = 18) and > 65 years (n = 16) are highlighted with blue dots. Memory populations represented in green (CM), in violet (EM) and in rose (TEMRA). Wilcoxon test was used comparing condition in the same group and U-Mann Whitney test was used comparing condition between different group (ns: not statistically significative, θ: p > 0.05 and < 0.1 *p < 0.05; **p < 0.01; ***p < 0.001)
Fig. 5
Fig. 5
Expression of activation and exhaustion markers in T cells. Co-receptors were evaluated from co-culture of CD4 or CD8 TLs in response to SARS-CoV2 peptides with autologous DCs previously treated with α1Thy. Bar and scatter plots graphs represent the expression of CD40L co-receptor CD8 total T cells (A) and PD1 co-receptor in CD4 T cells (B). Bar graphs describe the expression of each co-receptor in memory populations: In < 40 years’ group CD40L expression in Central Memory, Effector Memory and Terminally Differentiated Memory (CM, EM and TemRA, respectively) CD4 T-cells (C.1); PD1 expression in CM, EM and TemRA CD4 T-cells respectively (C.2); CD40L expression in CM, EM and TemRA, respectively in CD8 T-cells (C.3); PD1 expression in CM, EM and TemRA, respectively CD8 T-cells (C.4). In > 65 years’ group CD40L expression in CM, EM and TemRA, respectively CD4 T-cells (D.1); PD1 expression in CM, EM and TemRA CD4 T-cells respectively (D.2); CD40L expression in CM, EM and TemRA, respectively in CD8 T-cells (D.3); PD1 expression in CM, EM and TemRA, respectively CD8 T-cells (D.4) The medians with the interquartile ranges are shown. Ex-vivo: Ex-vivo condition; UT: Untreated condition; α1Thy: α1Thy treated condition; SARS-CoV2: SARS-CoV2 peptides stimulation condition; α1Thy + SARS-CoV2: α1Thy treated and SARS-CoV2 peptides stimulation condition. Each dot represents an individual. Orange dots represent < 40 years (n = 18) and > 65 years (n = 16) are highlighted with blue dots. Memory populations represented in green (CM), in violet (EM) and in rose (TEMRA). Wilcoxon test was used comparing condition in the same group and U-Mann Whitney test was used comparing condition between different group (ns: no statistically significative, θ: p > 0.05 and < 0.1 *p < 0.05; **p < 0.01; ***p < 0.001)
Fig. 6
Fig. 6
Correlations between markers in DCs and cytokines production, activation and exhaustion of TLs. In < 40 age group, association between CD80 in total DCs and CD40L in total CD4 T cells, respectively (A.1); CD40 in total DCs and TNFα production in total CD8 T cells (A.2); TIM-3 in pDCs and TNFα production in EM of CD4 TLs (A.3); CD40 in total DCs and PD1 in CD8 in TLs (A.4) and between HLA fluorescence intensity in mDCs and PD1 in EM of CD8 TLs (A.5). In > 65 age group, association between CD80 in mDCs and of TNFα production in TEMRA CD8 TLs (B.1); CD40 in total DCs and IL-2 production in EM CD8 TLs (B.2); TIM-3 in total DCs and of TNFα production in CM CD8 TLs (B.3); TNFα in total DCs and IFNγ production in CD8 TLs (B.4) and PDL-1 in total DCs and the TNFα production in CD8 TLs (B.5). The spearman rho correlation coefficient was used
Fig. 7
Fig. 7
Polyfunctionality in CD4 + and CD8 + T cells. Polyfunctionality patterns of CD4 and CD8 total T cells response to SARS-CoV2 producing one (green), two (blue) or three (orange) functions (combination of TNFα, IFNγ and IL2) among the different condition (with or without α1Thy treatment) for the two study groups: < 40 years (CD4 TLs: A.1-A.2; CD8 TLs: B.1-B.2) and > 65 years (CD4 TLs: C.1-C.2; CD8 TLs: D.1-D.2)

Similar articles

Cited by

References

    1. Darif D, Hammi I, Kihel A, El Idrissi SI, Guessous F, Akarid K. The pro-inflammatory cytokines in COVID-19 pathogenesis: What goes wrong? Microb Pathog. 2021;153:104799. doi: 10.1016/j.micpath.2021.104799. - DOI - PMC - PubMed
    1. Schultze JL, Aschenbrenner AC. COVID-19 and the human innate immune system. Cell. 2021;184(7):1671–1692. doi: 10.1016/j.cell.2021.02.029. - DOI - PMC - PubMed
    1. Ponnappan S, Ponnappan U. Aging and immune function: molecular mechanisms to interventions. Antioxid Redox Signal. 2011;14(8):1551–1585. doi: 10.1089/ars.2010.3228. - DOI - PMC - PubMed
    1. Thomas R, Wang W, Su DM. Contributions of Age-Related Thymic Involution to Immunosenescence and Inflammaging. Immun Ageing. 2020;17:2. doi: 10.1186/s12979-020-0173-8. - DOI - PMC - PubMed
    1. Wang W, Thomas R, Oh J, Su DM. Thymic aging may be associated with COVID-19 pathophysiology in the elderly. Cells. 2021;10(3):628. doi: 10.3390/cells10030628. - DOI - PMC - PubMed