

Gut microbiome modulates tacrolimus pharmacokinetics through the transcriptional regulation of ABCB1
- PMID: 37408070
- PMCID: PMC10324113
- DOI: 10.1186/s40168-023-01578-y
Gut microbiome modulates tacrolimus pharmacokinetics through the transcriptional regulation of ABCB1
Abstract
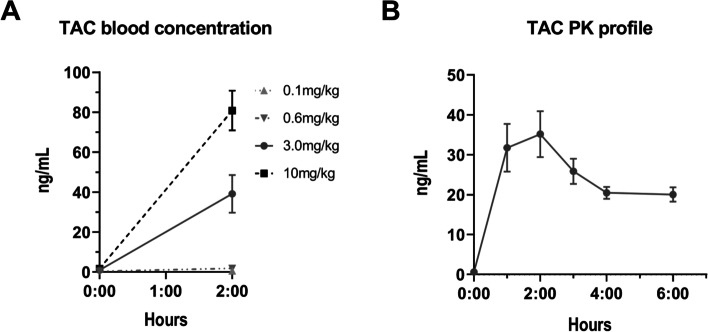
Background: Following solid organ transplantation, tacrolimus (TAC) is an essential drug in the immunosuppressive strategy. Its use constitutes a challenge due to its narrow therapeutic index and its high inter- and intra-pharmacokinetic (PK) variability. As the contribution of the gut microbiota to drug metabolism is now emerging, it might be explored as one of the factors explaining TAC PK variability. Herein, we explored the consequences of TAC administration on the gut microbiota composition. Reciprocally, we studied the contribution of the gut microbiota to TAC PK, using a combination of in vivo and in vitro models.
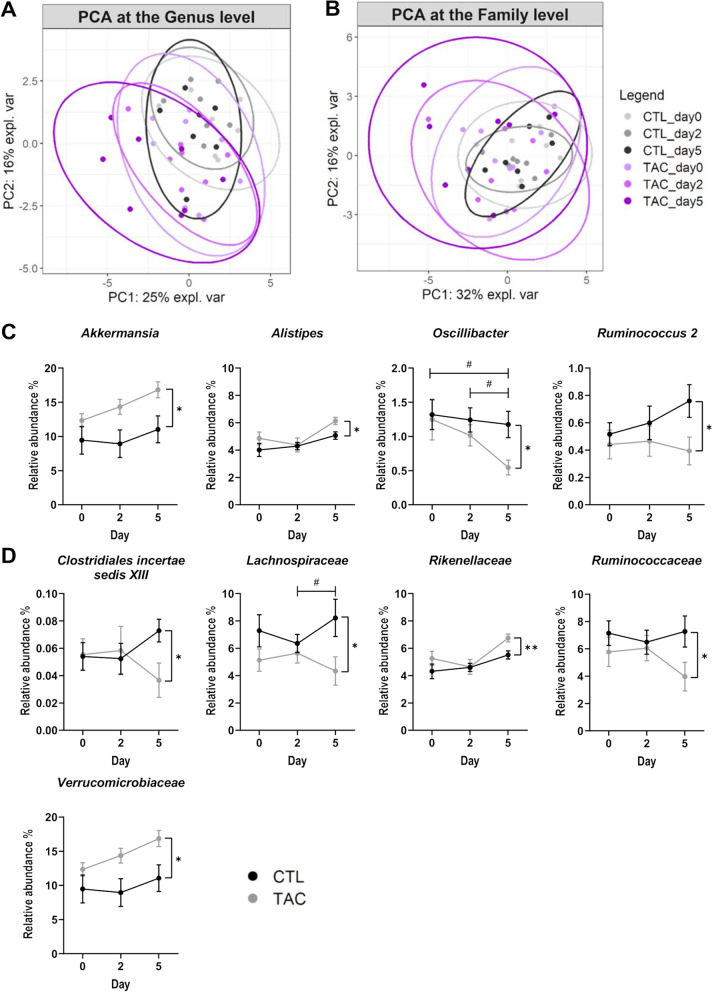
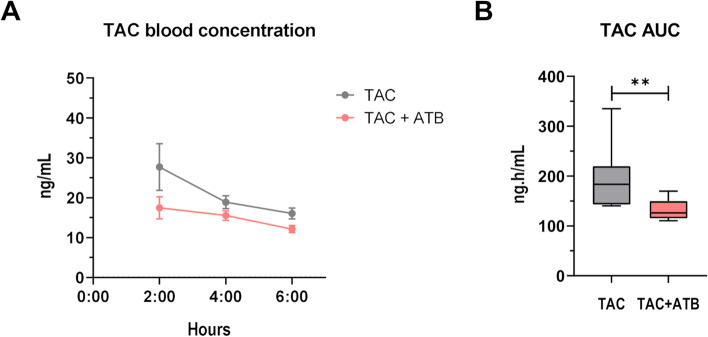
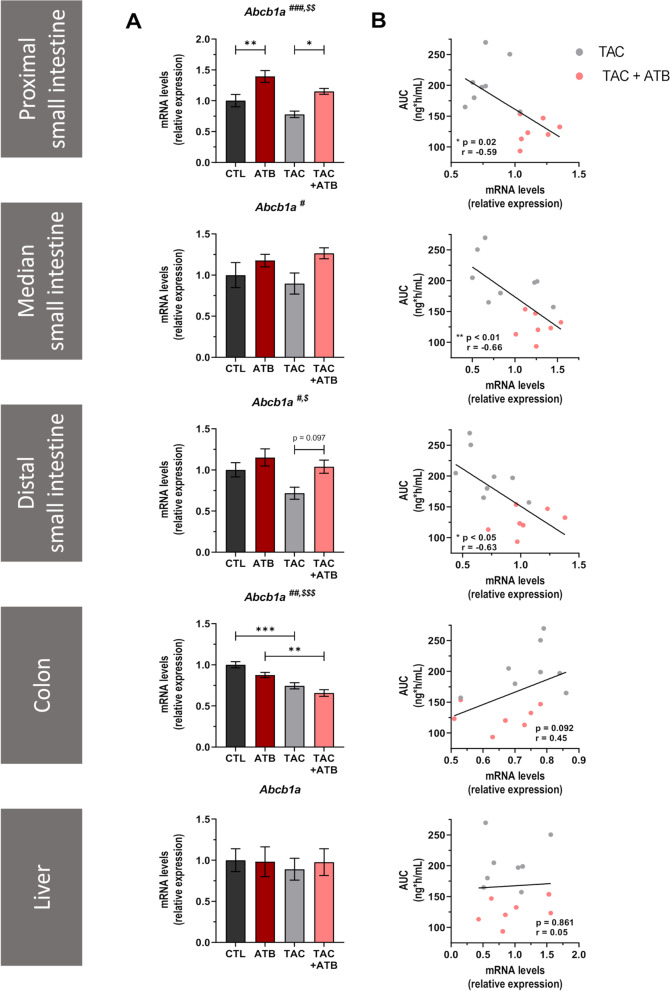
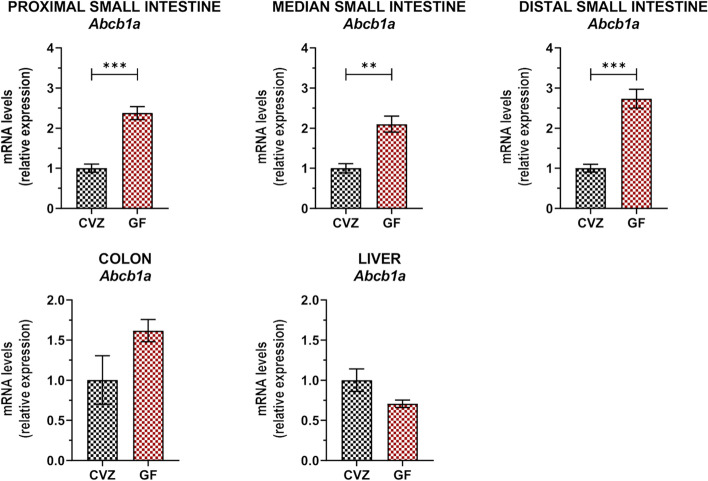
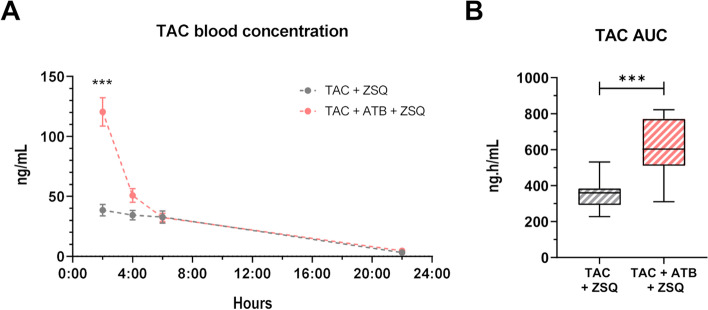
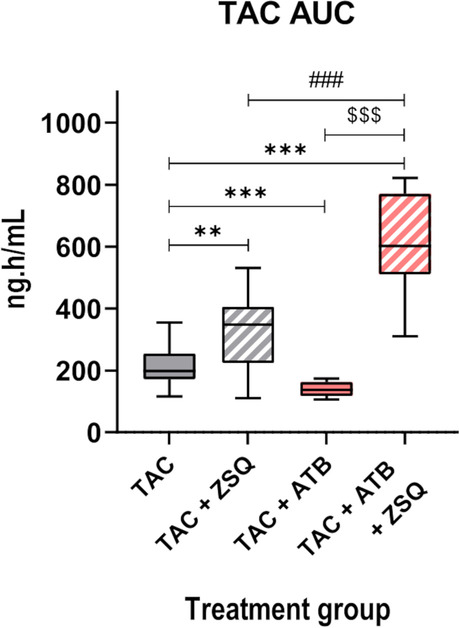
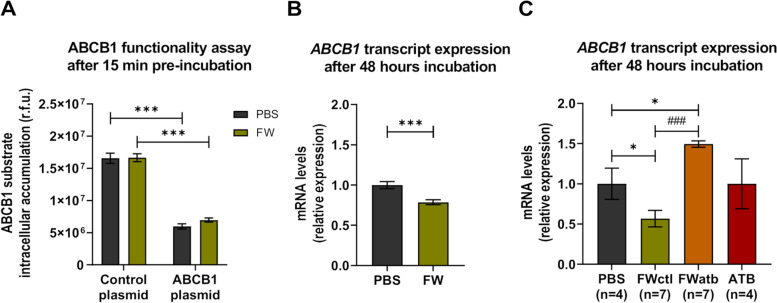
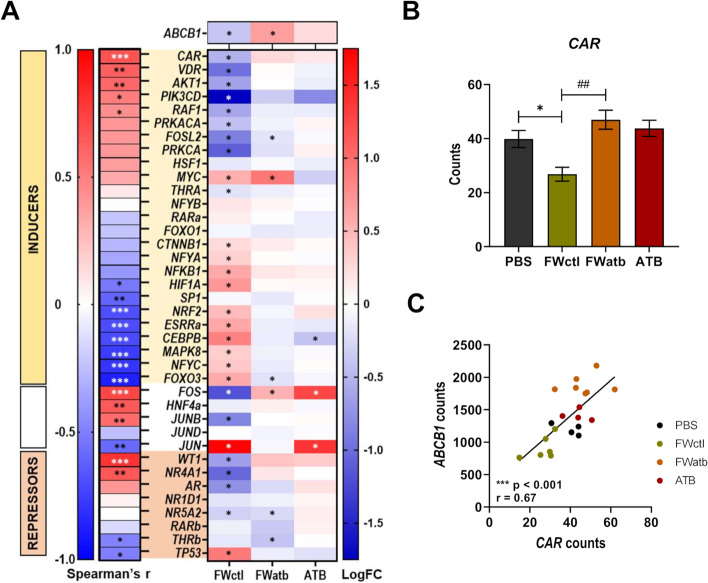
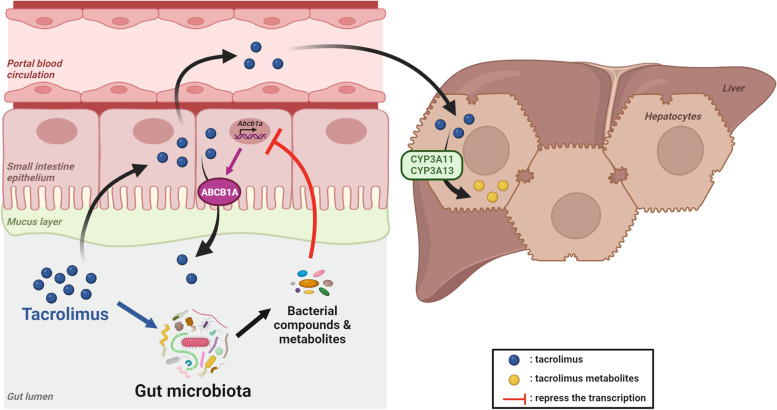
Results: TAC oral administration in mice resulted in compositional alterations of the gut microbiota, namely lower evenness and disturbance in the relative abundance of specific bacterial taxa. Compared to controls, mice with a lower intestinal microbial load due to antibiotics administration exhibit a 33% reduction in TAC whole blood exposure and a lower inter-individual variability. This reduction in TAC levels was strongly correlated with higher expression of the efflux transporter ABCB1 (also known as the p-glycoprotein (P-gp) or the multidrug resistance protein 1 (MDR1)) in the small intestine. Conventionalization of germ-free mice confirmed the ability of the gut microbiota to downregulate ABCB1 expression in a site-specific fashion. The functional inhibition of ABCB1 in vivo by zosuquidar formally established the implication of this efflux transporter in the modulation of TAC PK by the gut microbiota. Furthermore, we showed that polar bacterial metabolites could recapitulate the transcriptional regulation of ABCB1 by the gut microbiota, without affecting its functionality. Finally, whole transcriptome analyses pinpointed, among others, the Constitutive Androstane Receptor (CAR) as a transcription factor likely to mediate the impact of the gut microbiota on ABCB1 transcriptional regulation.
Conclusions: We highlight for the first time how the modulation of ABCB1 expression by bacterial metabolites results in changes in TAC PK, affecting not only blood levels but also the inter-individual variability. More broadly, considering the high number of drugs with unexplained PK variability transported by ABCB1, our work is of clinical importance and paves the way for incorporating the gut microbiota in prediction algorithms for dosage of such drugs. Video Abstract.
Keywords: Cytochrome P-450 CYP3A; Immunosuppressive therapy; Inter-individual pharmacokinetic variability; Intra-individual pharmacokinetic variability; Narrow therapeutic index; Therapeutic drug monitoring.
© 2023. The Author(s).
Conflict of interest statement
The authors declare no competing interests.
Figures
Similar articles
-
Association of ABCB1, CYP3A4*18B and CYP3A5*3 genotypes with the pharmacokinetics of tacrolimus in healthy Chinese subjects: a population pharmacokinetic analysis.J Clin Pharm Ther. 2011 Oct;36(5):614-24. doi: 10.1111/j.1365-2710.2010.01206.x. Epub 2010 Oct 5. J Clin Pharm Ther. 2011. PMID: 21916909
-
Tacrolimus Pharmacokinetics is Associated with Gut Microbiota Diversity in Kidney Transplant Patients: Results from a Pilot Cross-Sectional Study.Clin Pharmacol Ther. 2024 Jan;115(1):104-115. doi: 10.1002/cpt.3077. Epub 2023 Oct 30. Clin Pharmacol Ther. 2024. PMID: 37846607
-
Population pharmacokinetic analysis and dosing guidelines for tacrolimus co-administration with Wuzhi capsule in Chinese renal transplant recipients.J Clin Pharm Ther. 2021 Aug;46(4):1117-1128. doi: 10.1111/jcpt.13407. Epub 2021 Mar 25. J Clin Pharm Ther. 2021. PMID: 33768546
-
Effect of CYP3A and ABCB1 single nucleotide polymorphisms on the pharmacokinetics and pharmacodynamics of calcineurin inhibitors: Part I.Clin Pharmacokinet. 2010 Mar;49(3):141-75. doi: 10.2165/11317350-000000000-00000. Clin Pharmacokinet. 2010. PMID: 20170205 Review.
-
[Individualized dosage regimen of immunosuppressive drugs based on pharmacokinetic and pharmacodynamic analysis].Yakugaku Zasshi. 2007 Jul;127(7):1081-9. doi: 10.1248/yakushi.127.1081. Yakugaku Zasshi. 2007. PMID: 17603267 Review. Japanese.
Cited by
-
Microbial metabolism marvels: a comprehensive review of microbial drug transformation capabilities.Gut Microbes. 2024 Jan-Dec;16(1):2387400. doi: 10.1080/19490976.2024.2387400. Epub 2024 Aug 16. Gut Microbes. 2024. PMID: 39150897 Free PMC article. Review.
-
Case report: Tracing in parallel the salivary and gut microbiota profiles to assist Larotrectinib anticancer treatment for NTRK fusion-positive glioblastoma.Front Oncol. 2024 Nov 20;14:1458990. doi: 10.3389/fonc.2024.1458990. eCollection 2024. Front Oncol. 2024. PMID: 39634265 Free PMC article.
-
Gut Microbial Dysbiosis and Implications in Solid Organ Transplantation.Biomedicines. 2024 Dec 9;12(12):2792. doi: 10.3390/biomedicines12122792. Biomedicines. 2024. PMID: 39767699 Free PMC article. Review.
-
Gut microbiota modulation in cardiac cell therapy with immunosuppression in a nonhuman primate ischemia/reperfusion model.NPJ Regen Med. 2025 Jan 15;10(1):2. doi: 10.1038/s41536-025-00390-6. NPJ Regen Med. 2025. PMID: 39809790 Free PMC article.
-
The interplay between gut bacteria and targeted therapies: implications for future cancer treatments.Mol Med. 2025 Feb 13;31(1):58. doi: 10.1186/s10020-025-01108-6. Mol Med. 2025. PMID: 39948481 Free PMC article. Review.
References
-
- Lentine K, Smith J, Hart A, Miller J, et al. OPTN/SRTR 2020 annual data report: kidney. Am J Transplant. 2022;22:21–136. - PubMed
-
- Velickovic-Radovanovic RM, Paunovic G, Mikov M, Djordjevic V, et al. Clinical pharmacokinetics of tacrolimus after the first oral administration in renal transplant recipients on triple immunosuppressive therapy. Basic Clin Pharmacol Toxicol. 2010;106(6):505–510. doi: 10.1111/j.1742-7843.2009.00535.x. - DOI - PubMed
Publication types
MeSH terms
Substances
LinkOut - more resources
Full Text Sources
Molecular Biology Databases
Research Materials
Miscellaneous
