. 2023 Jul;12(7):e12338.
doi: 10.1002/jev2.12338.

Chemotherapy-induced release of ADAM17 bearing EV as a potential resistance mechanism in ovarian cancer

Affiliations

Chemotherapy-induced release of ADAM17 bearing EV as a potential resistance mechanism in ovarian cancer

Gerrit Hugendieck et al. J Extracell Vesicles. 2023 Jul.

Abstract

Ovarian cancer (OvCa) is the gynaecological disorder with the poorest prognosis due to the fast development of chemoresistance. We sought to connect chemoresistance and cancer cell-derived extracellular vesicles (EV). The mechanisms of how chemoresistance is sustained by EV remained elusive. One potentially contributing factor is A Disintegrin and Metalloprotease 17 (ADAM17)-itself being able to promote chemoresistance and inducing tumour cell proliferation and survival via the Epidermal Growth Factor Receptor (EGFR) pathway by shedding several of its ligands including Amphiregulin (AREG). We now demonstrate that upon chemotherapeutic treatment, proteolytically active ADAM17 is released in association with EV from OvCa cells. In terms of function, we show that patient-derived EV induce AREG shedding and restore chemoresistance in ADAM17-deficient cells. Confirming that ADAM17-containing EV transmit chemoresistance in OvCa, we propose that ADAM17 levels (also on EV) might serve as an indicator for tumour progression and the chemosensitivity status of a given patient.

Keywords: ADAM17; ascites; chemoresistance; extracellular vesicles; ovarian cancer.


Conflict of interest statement

The authors report no conflict of interest.

Figures
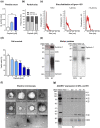
FIGURE 1
FIGURE 1
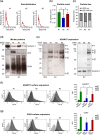
Cisplatin induces ADAM17‐containing EV release from Igrov‐1 cells. Igrov‐1 cells were grown in EV‐depleted medium and stimulated with 1–7.5 μM cisplatin or NaCl solvent control (0 μM). 48 h after treatment, EV were enriched from supernatants and characterised. EV concentration and particle size were assessed by nanoparticle tracking analysis (NTA) and displayed as (a) bar charts of concentration, (b) the relative fraction of EV < 200 nm and 200–1000 nm in size, (c) histograms of size distribution. Size distribution and EV concentration were standardised to the number of seeded cells (3.5 × 106), the corresponding data represent mean values of five independent experiments + SEM. (d) Cell viability was assessed via trypan blue staining and quantified by automatic imaging. (e) Marker protein expression of Syntenin‐1, CD9, CD63 and Calnexin of cis‐EV and whole cell lysate (WCL) of untreated cells was analysed by WB. The depicted blot is representative of three independent experiments. For WCL, 1 μg per lane was loaded. For EV samples the maximum of available EV‐concentrate was loaded; this varied depending on EV yield of the preceding cell culture experiments. 3,6 × 109 EV were included in the CD63 and CD9 blot, 3,6 × 109 in the Calnexin and 1,8 × 108 in the Syntenin‐1 blot (left side). As for restricted material of NaCl‐EV, material corresponding to 3.75 × 106 EV were loaded (right blot). For cis‐EV, material corresponding to 1.5 × 107 EV was used and 2 μg WCL per lane were loaded (E, right blot). (f) Electron micrographs of NaCl‐EV and cis‐EV (7.5 μM) were investigated by transmission electron microscopy (TEM). White and black arrowheads indicate lipid bilayer. Scalebar = 100 nm (upper rows) and 400 nm (lower row). (g) ADAM17 and CD63 abundance in EV and WCL were analysed by WB. 2 μg of WCL and the entirety of enriched EV generated by 1,75 × 106 Igrov‐1 cells within 72 h were subjected to SDS–PAGE, these corresponded to an average amount of 7.7 × 107 EV per lane with approximately 3 × 107 for NaCl‐EV and up to 1.3 × 108 EV for 7.5 cis‐EV. The depicted blot is representative of three independent experiments. Pro‐form of ADAM17 (1), mature form (2) and fragments at approx. 65 kDa (3) and approx. 20 kDa (4) were detected. These forms are in concordance with the antibody datasheet. Based on the Shapiro–Wilk normality test, statistical significance of five biological replicates was analysed by Friedman's test followed by Dunn´s multiple comparison test, not normally distributed (a) or RM‐one‐way‐ANOVA following Dunnett's multiple comparison test, normally distributed (b). Significance is displayed as **p < 0.01; ***p < 0.001; ****p < 0.0001.
FIGURE 2
FIGURE 2
Cisplatin treatment induces the release of ADAM17‐containing EV from patient‐derived cells. KI‐OC‐11‐cells were incubated in EV‐depleted medium and stimulated with 7.5 μM cisplatin or NaCl as solvent control for 48 h. EV were enriched from supernatants by differential ultracentrifugation. (a) EV concentration was determined by NTA. The number of extracted EV was standardised to 3.5 × 10⁶ cells. (b) Marker protein (Syntenin‐1, CD9, CD63, Calnexin) and (c) ADAM17 (A17) expression in OC‐11‐EV (0 μM (NaCl), 7.5 μM cisplatin) and cellular lysates (WCL) of vesicle‐treated OC11 cells were analysed by WB. Approximately 5 × 10⁸ NaCl‐EV and 9.7 × 10⁸ cis‐EV were loaded. Pro‐form of ADAM17 (1), mature form (2) and fragments at approx. 65 kDa (3) and approx. 20 kDa (4) were detected. These forms are in concordance with the antibody datasheet. The data represents the mean value of three independent experiments + SEM. Based on Shapiro–Wilk normality test, statistical significance of four biological replicates was analysed by ratio paired t‐test. Statistical significance is displayed as *p < 0.05.
FIGURE 3
FIGURE 3
Native ascites‐derived EV contain mature ADAM17. Ascites‐EV derived from three ovarian cancer patients (#1, #2, #3) were isolated by differential ultracentrifugation and characterised. Size distribution and concentration of ascites‐EV were determined by NTA and displayed as (a) histograms of size distribution, (b) bar charts of concentration and (c) the relative fraction of EV < 200 nm and 200–1000 nm in size. Size distribution and EV concentration were adjusted to the EV extracted from 1 ml ascites. (d) Marker protein expression of Syntenin‐1, CD9 and CD63 was analysed in EV and whole cell lysates (WCL) by WB. (e) Relative ADAM17 abundance in purified EV was assessed by WB analysis. EV purified from 0.5 mL ascites were loaded on the gel. Pro‐form of ADAM17 (1), mature form (2) and fragments at approx. 65 kDa (3) and approx. 20 kDa (4) were detected. (f) As benign controls, flushing fluid derived from patients undergoing surgical procedures for benign gynaecological diseases such as fibroids were used (#4 and #5). The maximum amount of EV derived from ∼1.4 to 1.9 mL flushing fluid was loaded on the gel. Marker protein and ADAM17 (A17) expression were analysed in comparison to EV derived from patient #3. The marker protein Syntenin‐1 and ADAM17 (A17) are displayed and run in the same blot as EV derived from patient #3 for a direct comparison. (g, h) Surface expression of ADAM17 and CD63 on ascites‐EV was evaluated via FC using Phycoerythrin (PE)‐conjugated anti‐ADAM17 and anti‐CD63 antibodies. FC data are presented as mean fluorescence intensities (MFI). NTA and FC data are represented as mean + SEM of three independent experiments. Based on the Shapiro–Wilk normality test, statistical significance was analysed by RM one‐way‐ANOVA following Tukey's multiple comparison test (b, g). Statistical significance is displayed as *p < 0.05.
FIGURE 4
FIGURE 4
Comparison of ex vivo native ascites‐derived EV before and after chemotherapeutic treatment of an OvCa patient. Ascites‐EV derived from one individual OvCa patient before and after therapy were isolated by differential ultracentrifugation and characterised. The first sample was taken at primary diagnosis (chemo–naïve) (OC) and the second sample after chemotherapeutic treatment at the time of recurrence (1 year later) (rOC)(a). The concentration of ascites‐EV was investigated by NTA (n = 4 measurements) and displayed as bar charts. (b) EV purified from 0.75 mL ascites, corresponding to 5.32 × 10⁸ EV for the OC sample and 1.06 × 10⁹ for the rOC sample were subjected to gel electrophoresis and relative ADAM17 abundance in purified EV was assessed by WB analysis. Pro‐form of ADAM17 (1), mature form (2) and fragments at approx. 65 kDa (3) and approx. 20 kDa (4) were detected. (c) ADAM17 was quantified by ELISA using EV purified from 0.375 mL ascites, which corresponds to a total number of 2.66 × 10⁸ EV for OC and 5.3 × 10⁸ EV for rOC.
FIGURE 5
FIGURE 5
ADAM17 is proteolytically active on isolated ascites‐EV. ADAM17 proteolytic activity of ascites‐EV was quantified using a cell‐free ADAM17 activity assay. 1 × 10⁹ ascites‐EV of three OvCa patients (#1, #2 and #3) or PBS as a control were incubated at 37°C for 80 min with a fluorogenic substrate. Relative fluorescence units (RFU) were measured every 30 s. RFU of the PBS control was subtracted from the RFU of the EV incubation. (a) Kinetics of ADAM17 activity in ascites‐EV, one representative of three biological replicates is shown. (b) Mean RFU (endpoint) of the cleavage product of three biological replicates + SEM is displayed. Based on the Shapiro–Wilk normality test, statistical significance was analysed by RM one‐way‐ANOVA following Tukey's multiple comparison test. *p < 0.05, **p < 0.01.
FIGURE 6
FIGURE 6
Generation and characterisation of ADAM17–deficient cells. ADAM17‐deficient cells (KO) were generated using CRISPR/Cas9 technology. ADAM17‐positive parental cells (WT) and ADAM17‐deficient cells (KO) were characterised in parallel to verify knockout efficiency. (a) Surface expression of ADAM17 on Igrov‐1 WT and KO cells was investigated via FC using a Phycoerythrin (PE)‐conjugated anti‐ADAM17 antibody (black) or IgG control (grey). Data represents the mean value of the fluorescence intensity (MFI) of three independent experiments + SEM. (b) ADAM17 protein levels were evaluated using WB analysis of whole cell lysates (WCL) of Igrov‐1 WT and KO cells with β‐Tubulin as loading control (LC). Pro‐form of ADAM17 (1), mature form (2) and fragments at approx. 65 kDa (3) and approx. 20 kDa (4) were detected. These forms are in concordance with the antibody datasheet. EV of WT and KO cells were quantified by NTA and a particle number of 7.7 × 10⁷ loaded per lane. ADAM17 expression was analysed and EV marker protein Syntenin‐1 served as loading control (LC). (c) Surface expression of ADAM17 on Igrov‐1 WT and KO cells was investigated via imaging FC using a PE‐conjugated anti‐ADAM17 antibody. Representative images are shown. Scale bars represent 10 μm. Statistical significance was analysed by ratio paired t‐test and statistical significance is displayed as **p < 0.01.
FIGURE 7
FIGURE 7
ADAM17‐containing ascites‐EV induce AREG shedding and mediate resistance in ADAM17‐deficient recipient cells. Functional characterisation of ADAM17‐deficient KO cells compared to ADAM17‐positive WT cells. WT cells were treated with indicated concentrations of cisplatin and GW280264X (GW) as a control for ADAM17 activity. (a) AREG release was assessed by ELISA after 48 h of treatment. (b) Caspase activity of Igrov‐1 cells was quantified after 48 h of treatment. (c) 1 × 10⁵ ADAM17‐deficient cells were seeded in 12‐well plates and treated with 1 × 10⁹ ascites‐EV of OvCa patient #3 and PBS as a control for 24 h. Thus, the ratio of cells to EV was 10,000 EV per cell. Each day (starting at day 2) 250 μL supernatant were removed from each well and stored for ELISA. The wells were again supplemented with 250 μL medium containing either 1 × 10⁹ ascites‐EV or the equivalent volume of PBS. AREG levels were quantified at days 2, 3, and 4. (d) Patient #3‐derived EV were cultivated with and without cells to analyse EV‐dependent AREG release. (e) ADAM17‐deficient cells were seeded at a density of 1.5 × 10⁴ cells per well (96‐well plate) and pre‐treated for 24 h with 1.5 × 10⁸ ascites‐EV and PBS as a control corresponding to a ratio of 10,000 EV per cell. Caspase activity was assessed 48 h after cisplatin treatment. Mean + SEM of three biological replicates is displayed, except for d (technical replicates). Statistical significance was calculated by ANOVA following Tukey's multiple comparison test (a, b) or ratio paired t‐test (c, d). Statistical significance is displayed as *p < 0.05, **p < 0.01, ***p < 0.001, ****p < 0.0001.

References

    1. Ab Razak, N. S. , Ab Mutalib, N. S. , Mohtar, M. A. , & Abu, N. (2019). Impact of chemotherapy on extracellular vesicles: Understanding the chemo‐EVs. Frontiers in Oncology, 9, 1113. 10.3389/fonc.2019.01113 - DOI - PMC - PubMed
    1. Adriaenssens, E. , Mougel, A. , Goormachtigh, G. , Loing, E. , Fafeur, V. , Auriault, C. , & Coll, J. (2004). A novel dominant‐negative mutant form of Epstein‐Barr virus latent membrane protein‐1 (LMP1) selectively and differentially impairs LMP1 and TNF signaling pathways. Oncogene, 23, 2681–2693. 10.1038/sj.onc.1207432 - DOI - PubMed
    1. Ahmed, N. , & Stenvers, K. L. (2013). Getting to know ovarian cancer ascites: Opportunities for targeted therapy‐based translational research. Frontiers in Oncology, 3, 256. 10.3389/fonc.2013.00256 - DOI - PMC - PubMed
    1. Altevogt, P. , Bretz, N. P. , Ridinger, J. , Utikal, J. , & Umansky, V. (2014). Novel insights into exosome‐induced, tumor‐associated inflammation and immunomodulation. Seminars in Cancer Biology, 28, 51–57. 10.1016/j.semcancer.2014.04.008 - DOI - PubMed
    1. Armstrong, D. K. , Alvarez, R. D. , Bakkum‐Gamez, J. N. , Barroilhet, L. , Behbakht, K. , Berchuck, A. , Chen, L.‐M. , Cristea, M. , DeRosa, M. , Eisenhauer, E. L. , Gershenson, D. M. , Gray, H. J. , Grisham, R. , Hakam, A. , Jain, A. , Karam, A. , Konecny, G. E. , Leath, C. A. , Liu, J. , … Engh, A. M. (2021). Ovarian cancer, Version 2.2020, NCCN Clinical practice guidelines in oncology. Journal of the National Comprehensive Cancer Network: JNCCN, 19, 191–226. 10.6004/jnccn.2021.0007 - DOI - PubMed

Publication types